Ultimate Guide: 3 Main Financial Statements
Bookkeeping is a detailed and multi-statement process. But there are three must-have financial statements and today we’ll provide an ultimate guide for these 3 Financial Statements.
Table Of Content
What are the 3 Main Financial Statements?
1. Income Statement
2. Balance Sheet
3. Cash Flow Statement
How these 3 Financial Statements used together?
Conclusion
These three sheets are very important for financial to help people make smart choices. If you’re planning a career in accounting and finance, you will need a clear understanding of these three main statements.

What are the 3 Main Financial Statements?
3 major financial statements are Income Statement, Balance Sheet and the Cash Flow Statement. No matter the size, the type or the industry of the company, all businesses prepare these papers. And, this is not only for financial analysis purpose, but also for interested parties such as lenders, stakeholders, customers, etc.
Let’s get deeper into these statements.
1. Income Statement
The income statement is a financial report that shows how much money a company made, how much it spent, and whether it made a profit or lost money over a certain time period. You can see Income Statement also as Profit and Loss (P&L) statement.
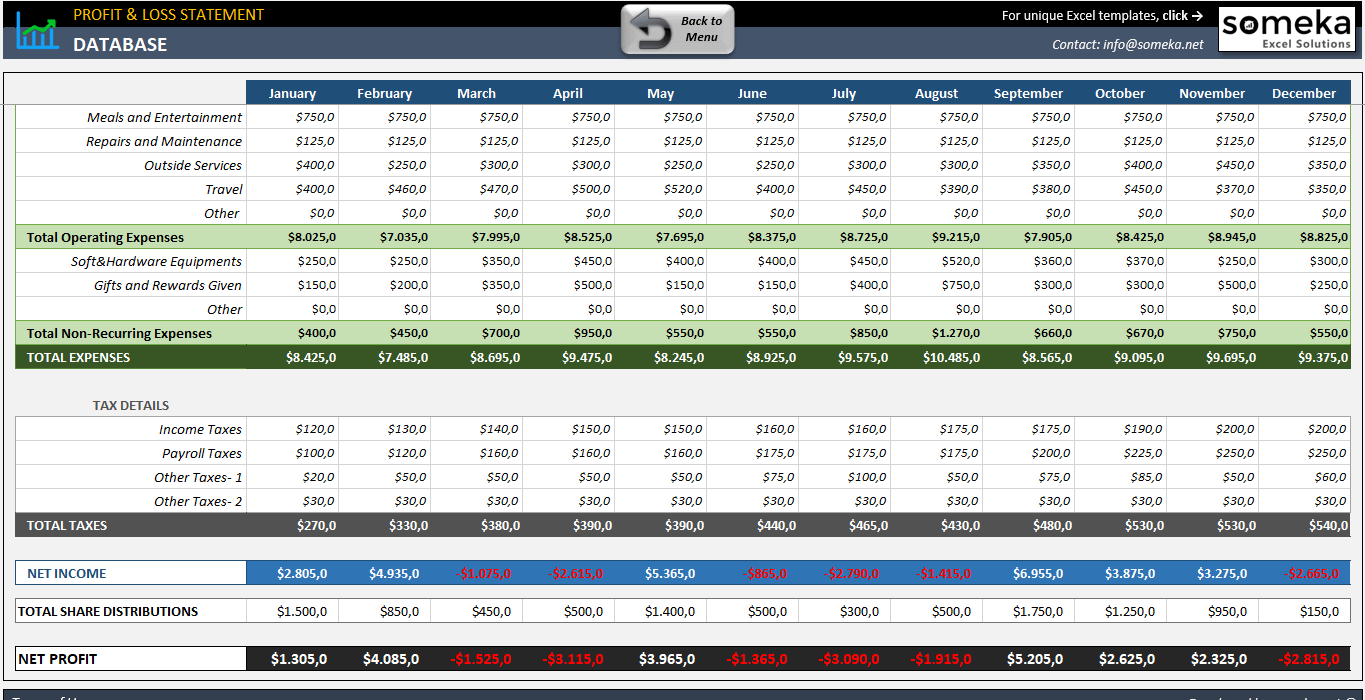
>> Download Profit and Loss Statement Template
Also, this report from 3 Financial Statements makes it easy to see how efficiently a business runs by showing how revenue is turned into net income.
Key Elements of Income Statement:
- Revenue: This is the total amount of money the business makes from its main activities, like selling goods or providing services. Other types of income, like interest on investments, may also be included, but they are usually shown separately as “non-operating revenue.”
- Cost of Goods Sold (COGS): The direct costs that the company has to pay to make the goods it sells, such as labor and materials. When you take COGS away from revenue, you get gross profit.
- Gross Profit: This number shows how much money a company makes after taking out the costs of making and selling its products but before it pays for indirect costs.
- Operating Expenses: These are costs that aren’t directly related to making goods or providing services. Costs for things like selling, general, and administrative (SG&A), depreciation and amortization, and research and development (R&D) are some examples.
- EBIT: EBIT abbreviation stands for “earnings before interest and taxes.” Insummary, this is the money that a business makes from running its normal operations, minus the money it spends on things that aren’t related to running its business. Additionally, you can see EBITDA for earnings before interest, taxes, depreciation, and amortization as one of the main financial kpi’s.
- Net Income: To find the last line on an income statement, called “net income,” take the total income and subtract all costs, such as taxes and interest. It’s how much money the business made during a certain time period, after all costs were taken into account.
2. Balance Sheet
At a certain point in time, the balance sheet shows a company’s assets, liabilities, and shareholders’ equity. So, it gives a detailed picture of the company’s financial situation.
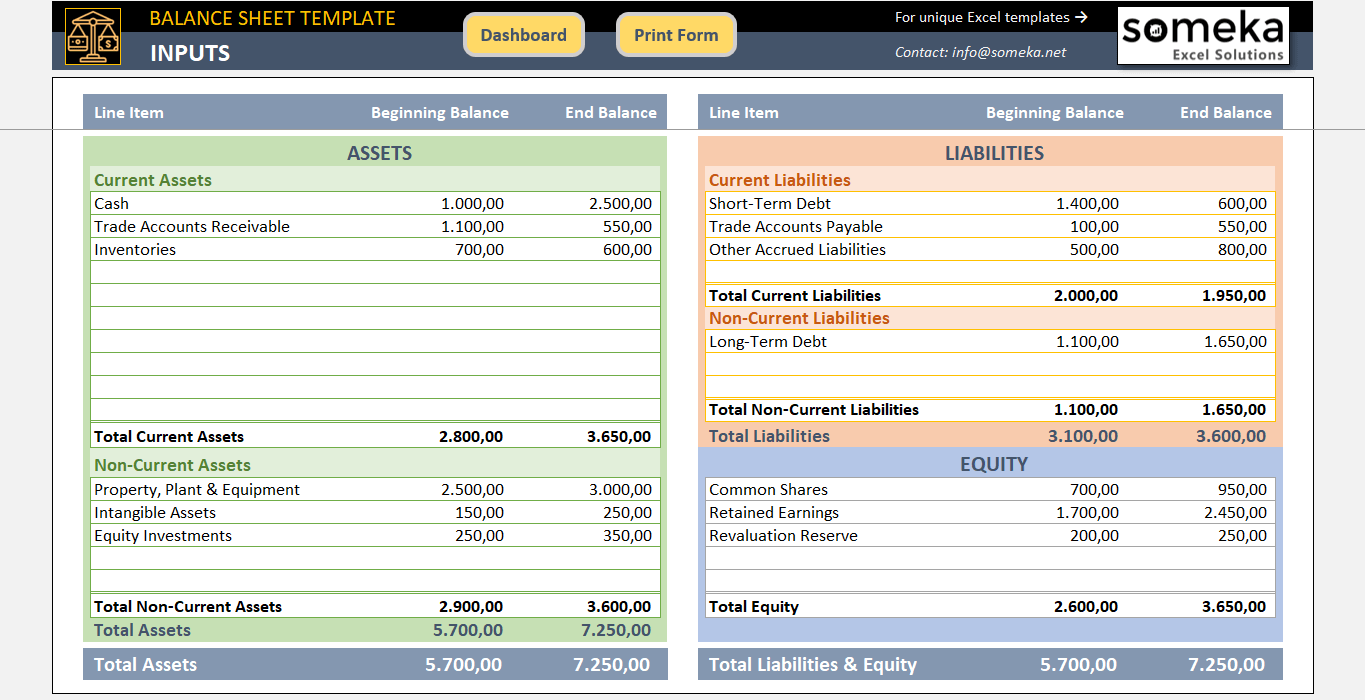
>> Download Balance Sheet Template in Excel
Firstly, a company’s assets, which are its resources, are balanced against its liabilities, which are its debts, and its equity, which is its share of the assets left over after its liabilities have been paid off.
Above is the basic equation that a balance sheet as one of the major 3 Financial Statements. This statement is important for financial analysis because it shows what the company owns, what it owes, and how much money the shareholders have put in.
Key Elements of Balance Sheet:
- Assets: These are things that the business owns that it thinks will bring it money in the future. Current assets are things like cash and other liquid assets that can be turned into cash within a year. Non-current assets are things like long-term investments, machinery, land, and other things that are used over a long period of time.
- Liabilities: These are debts that the business will have to pay off in the future because of things that happened in the past. There are two types of debts: current debts (due within a year) and long-term debts (due after more than a year).
- Equity: This is the owners’ claim after all debts have been paid off. It is also called “net assets.” Stock capital, retained earnings, and other reserves are all part of it.
3. Cash Flow Statement
The cash flow statement shows how much cash came in and went out during a certain time period. Thus, as one of the main 3 Financial Statements, the cash flow statement shows how much cash was used for three main things: operating, investing, and financing.

>> Download Cash Flow Statement Excel Template with dashboard
Firstly, the non-cash transactions and changes in working capital in the operating activities section will affect the net income. Also, the investing activities list the money for things like equipment or to make money from the sales of other businesses and investments. So, the deals involving debt, equity, and dividends are all examples of financing activities.
Finally, you can’t understand how a company handles its cash without this statement, which is important for figuring out its liquidity, solvency, and overall financial flexibility.
Key Elements of Cash Flow Statement:
Operating Activities: This part of the report takes into account non-cash transactions and changes in working capital when figuring out net income. It shows how much cash the company’s main business activities bring in or spend.
Investing Activities: These show how much cash is being used to buy and sell long-term assets and investments in order to make or keep the company’s ability to make money.
Financing Activities: This area records flows of cash between the company and its owners and creditors. It includes dividends paid, repayments of debt, and proceeds from issuing new shares.

Each of these 3 Financial Statements gives different but connected information about a business’s finances, and when looked at together, they give a full picture. They are necessary for anyone who wants to fully understand how a business’s finances work.
How these 3 Financial Statements used together?
First of all, it is important to understand the three main financial statements on their own, but looking at how they work together gives you even more information about a business’s financial health.
The income statement, balance sheet, and cash flow statement all show how a business is doing financially right now and what its plans are for the future.
-
Linking the Income Statement and Balance Sheet:
The income statement’s net income also affects the balance sheet. So, this changes the company’s equity. Also, the losses take away from equity, while gains add to it.
Thus, linking balance sheet to the income statement helps us understand how operational performance (making money) changes over time and how that changes the company’s net worth.
-
From the Balance Sheet to the Cash Flow Statement:
As mentioned, the balance sheet shows a fixed picture as of a certain date. On the other hand, the cash flow statement shows how cash comes into and goes out of the business during operating, investing, and financing activities.
So, the balance sheet shows how the amounts of assets and debt have changed from one period to the next. This is often where the calculation of cash flow starts.
This is something that will be taken into account by the cash flow from operations to show how much cash was actually received.

-
Interpreting Cash Flows in Context:
The profitability metrics from the income statement and the solvency ratios from the balance sheet affect what the cash flow statement says about a company’s liquidity.
For example: A company can have a liquidity crisis even if it is making money if it can’t turn its sales or assets into cash quickly.
-
Strategic Decision-Making
Financial statements are not only important for the company itself, but also for the third-parties and interest groups.
Firstly, the stakeholders can figure out if a company is on solid financial ground by looking at all three statements. Additionally, the investors may look for companies that make good profits and have a steady flow of cash from operations. Also, the creditors could use this combined data to see how risky it is to lend money to the business. Also, the management can use it to plan how to invest or pay for things.
So, you can combine all there financial statements with other reporting tools like break-even analysis or NPV and IRR calculations in complex financial models.
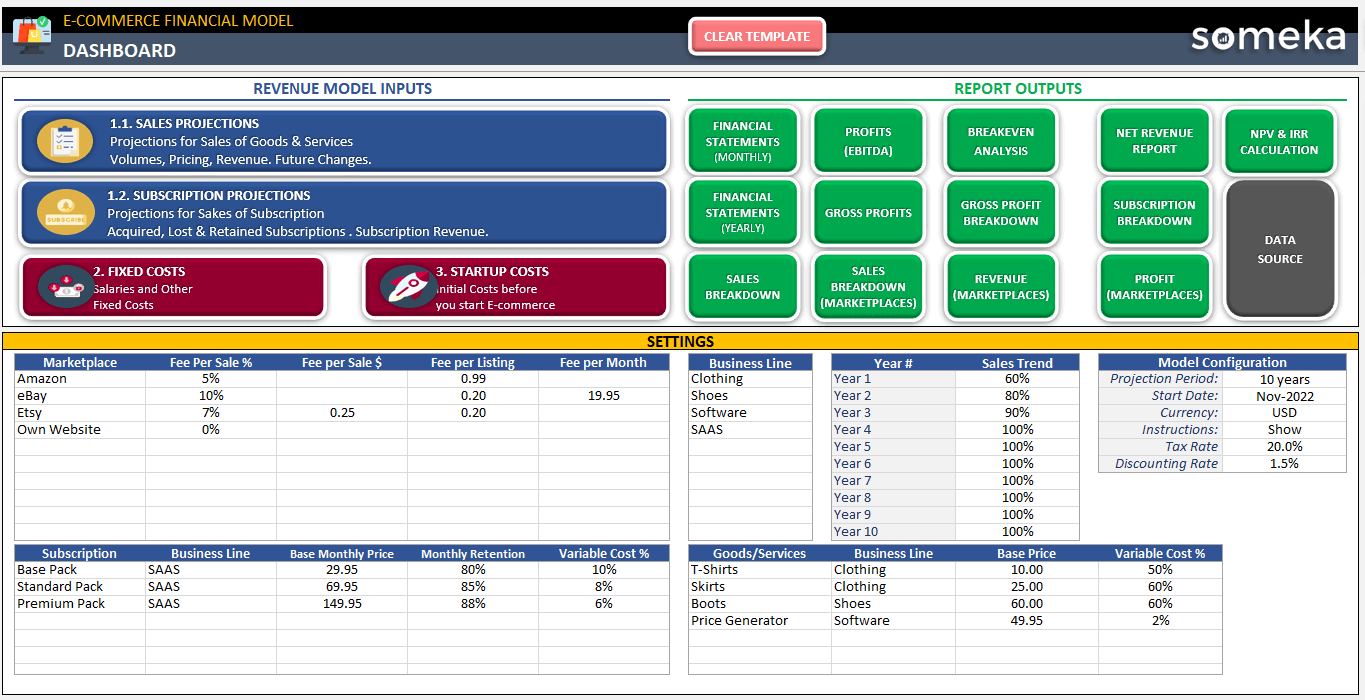
>>A Dashboard Example from Someka’s Financial Model Portfolio
With these financial models, you will be able to create monthly financial statements. Also you’ll have your sales and cost breakdown, asset structure and other financial transactions.
All of these financial statements together give a full picture of a business’s money-related activities. And this is very helpful for both insiders and people outside the business.
Conclusion on 3 Financial Statements
In summary, we have tried to provide you full understanding of 3 Financial Statements in this article.
Besides giving detailed explanations abut the key elements of each statement, it is also important to link these three reports. Each statement does a different job and have common elements to comment. When used together, they give a full picture of how well a business is running, how stable its finances are, and how liquid it is.
For everyone involved, from investors to management, understanding these statements together is important for making smart decisions. So, hope you enjoy this article to get a holistic view of these financial reporting tools.
Recommended Readings:
How to Make a Balance Sheet in Excel?
20 Most Asked Excel Job Interview Questions for Financial Analysts
Related Posts


