ABC Analysis in Inventory Management: Definition, Methods and Examples
ABC Analysis is one of the most common techniques for an efficient inventory management. So we’ll try to discover this ABC Analysis concept with examples, step-by-step methodology and templates.
Table Of Content
1. What’s ABC Analysis in Inventory Management?
2. ABC Analysis and Pareto Principle
3. How to make ABC Classification?
4. ABC Analysis Example
5. How to manage ABC groups?
6. Why to use ABC Analysis?
7. ABC Analysis Benefits and Limitations
8. Someka ABC Analysis Template
9. Conclusion
1. What’s ABC Analysis in Inventory Management?
ABC Analysis stands as a cornerstone in inventory management. Simply, with this ABC classification, stock is categorized according to how important it is to the company. Using this method, inventory is separated into three groups: A, B, and C.

This categorization might be based on the items’ value, volume, or frequency of use, according to the main purpose of the business.
In summary, this technique helps businesses manage their inventory more efficiently by categorizing items based on importance and value. So, it is a method used widely across various industries.
2. ABC Analysis and Pareto Principle
The Pareto Principle is closely related to ABC Analysis.
According to Pareto Rule, 20% of causes account for 80% of effects. When it comes to inventory, it means that a tiny fraction of items have a big impact on total expenses or income.

This concept is used by ABC Analysis to manage stock well. So, ABC analysis groups your inventory into three segments and gives you an analysis of how much of your inventory has the biggest value or effect on your business.
3. How to make ABC Classification?
So, ABC analysis is a very simple concept, but it’s not so easy to implement a ABC Classification from scratch. Here are some basic steps for you to create your analysis:
-
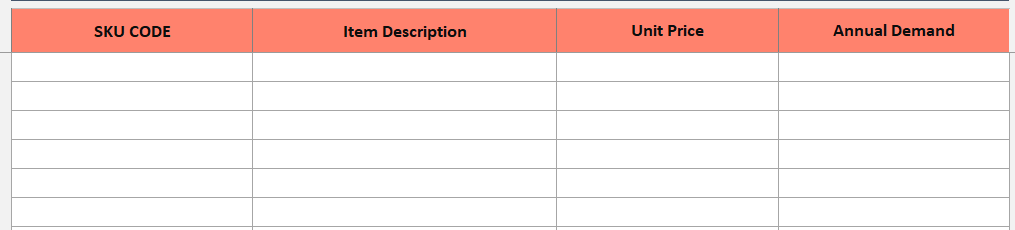
Step 1: Gather data for your inventory
Gathering data is the first stage in the ABC classification process. Therefore, you can include purchase prices, sales or demand volume, description and SKU codes as well as usage frequency in this data.
You can create your inventory list from scratch, or if you’re using an ERP tool, you can easily download this list from your database.
-
Step 2: Define ABC classification coefficients
Next, we will specify the requirements for every group. This entails establishing cutoff points for items A, B, and C.
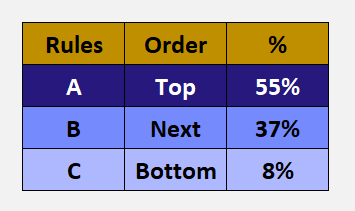
Additionally, you should also determine the ABC group percentages. If you’re looking for the most important 80%, then your A group will be 80%. But if you want to determine the most important 50% then you can configure your groups accordingly.
-
Step 3: Define Metric of Impact
Then, we will specify the requirements for every group. This entails establishing cutoff points for items A, B, and C. So, these standards might be determined by quantity used, total annual value, frequency of purchases, or sales value.
-
Step 4: Sort your inventory items
When we determine which metric to use in our metric of impact, we will use Excel SORT function for our items by decreasing order of impact. Then, we’ll sum up their aggregate impacts from top to down.
-
Step 5: Classify your items into ABC Groups
Now you know where your A group finishes and where B starts. So, label your items with ABC groups.
So, we will Classify each inventory item after the criteria have been established. Basically, the category A includes the items with the highest value or turnover rate. B items are those that have a moderate value or frequency. The remainder fall into category C.
-
Step 6: Visual representation with ABC chart
Lastly, we may create a visual chart to visualize our ABC analysis. Thus, you can use here a Combo chart with a custom combination of Clustered Column chart and line graph.
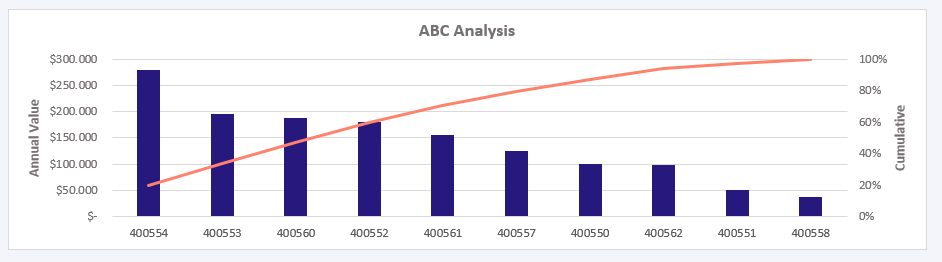
Each item is mapped into its category by this visual tool. It facilitates both strategic planning and the understanding of inventory distribution.
4. ABC Analysis Example
Let’s explain more about this analysis with an example.
Assume that you have a retail clothing store. You have different items in your stock from socks to fashionable outerwear. So, now we’ll make an ABC analysis for our inventories:
- Firstly, we’ll list down our items and prepare our data for their purchase prices and total annual demand.
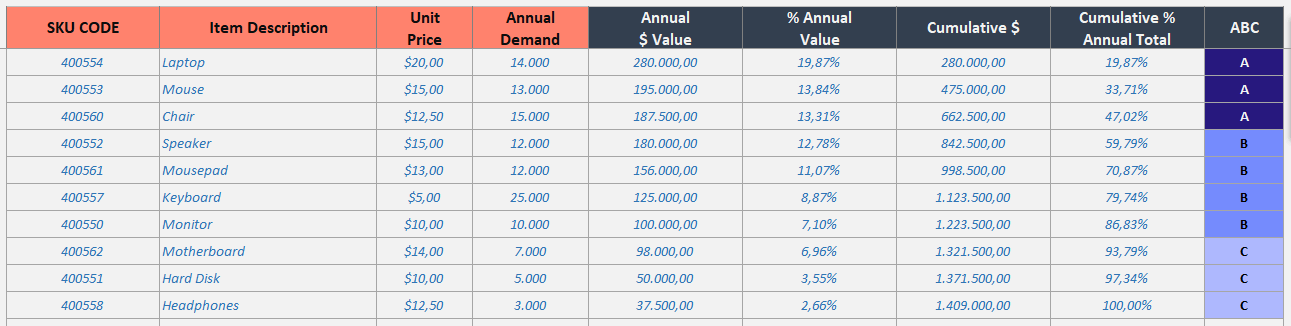
- Secondly, we have determined that our impact metric will be our annual value, so we will calculate Annual $ value of each item.
- Thirdly, we’ll sort them with decreasing order according to their annual value.
- Then, we’ll calculate the cumulative total for each row, and also compute the cumulative % for each row.
- Lastly, we’ll classify each item. According to your desired percentages for each group, now you can label each item according to their ABC segment.
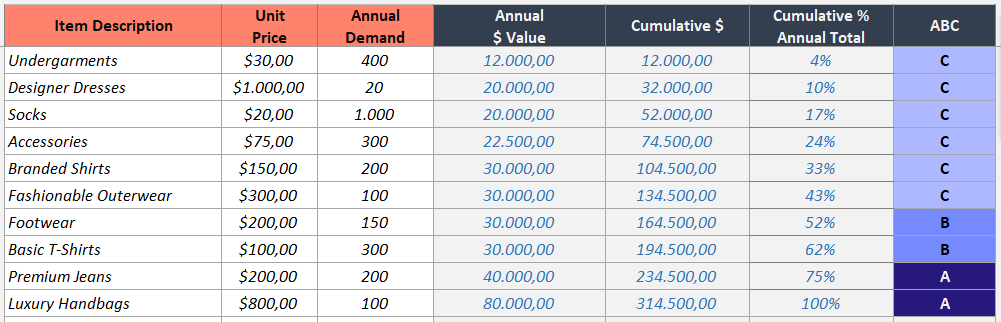
That’s an simple example of an ABC inventory analysis.
5. How to manage ABC groups?
As the main objective of ABC Analysis is a more effective inventory and warehouse management, we should implement different strategies for each group of stock items. So if we know that a group is far more important then the other, then we should focus our time, energy and money to the most important ones.
Group A
Group A have a high value and need to be closely watched. They require:
- Regular inventory inspections
- Solid supplier relationships
These products frequently need larger initial investments but offer substantial returns.

Group B
Also, Group B items require equal attention. They are somewhat significant. To maintain ideal stock levels, reorder strategies and regular reviews are crucial.
Group C
Lastly, less important things are in Group C. They need very little in the way of management work. For these products, buying in bulk and doing reviews less frequently are common practices
6. Why to use ABC Analysis?
ABC Analysis is essential to effective inventory control. Businesses can use it to focus on high-impact products and prioritize their resources. Businesses can make better decisions if they can determine which items account for the majority of their costs or revenue.
Better stock control and enhanced financial performance are the results of thi ABC Analysis technique.

7. ABC Analysis Benefits and Limitations
First of all, the inventory management is optimized by ABC Analysis. Because, it helps to improve cash flow and lower carrying costs. This approach also improves decision-making by pinpointing the essential elements that propel company success. Also, it helps stock categorization and product prioritization.
Additionally, this kind of analysis may help you optimize your inventory turnover.
It is not without limitations, though:
- It might simplify intricate inventory dynamics too much.
- For it to continue working, regular data updating is also necessary.
- Items may move between categories due to slight variations in inventory or market conditions.
8. Someka ABC Analysis Template
If you want a dynamic and easy-to-use supply chain management tool to calculate your ABC groups instantly, then you do not have to create a ABC Chart from scratch each time. Therefore, we have created a unique tool for ABC Analysis:
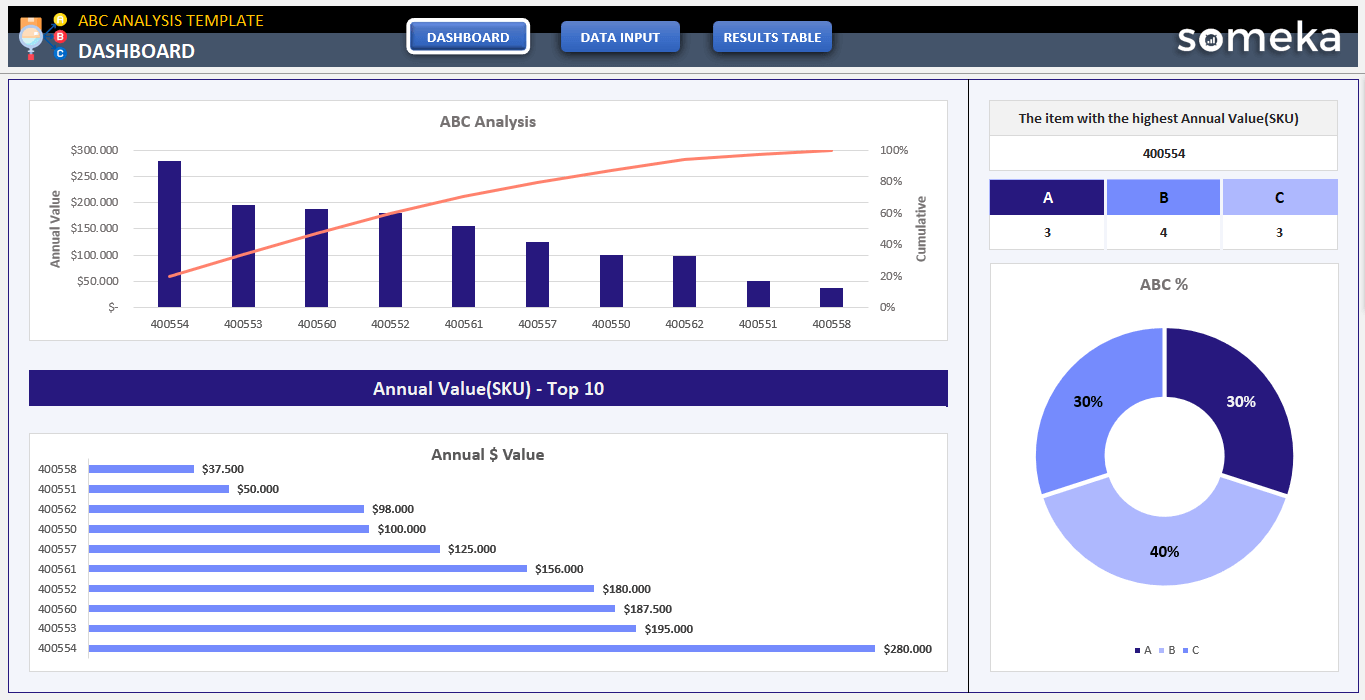
– The Dashboard of the ABC Analysis Excel Template by Someka –
This tool has three main parts:
- Input Data: You list your inventory items with unit prices and annual demands.
- Results Table: This sections gives an overall analysis of your entire inventory portfolio. This is an calculated area for you to make analysis.
- Dashboard: This tab includes visual charts and graphs to better understand your ABC classification.
This is an editable and printable worksheet in Excel. So, with this very easy-to-use tool you’ll be able to create dynamic ABC analysis.
9. Conclusion
ABC Analysis is a cutting-edge method for inventory management that effectively transforms ambiguity into clarity. So, businesses can concentrate their resources where they matter most by strategically categorizing their inventory into A, B, and C categories. This method aims to balance inventory management with business priorities and market demands, not just stock organization.
Retailers, manufacturers, or any other company managing a wide range of products can find a structured, data-driven way to manage their inventory with ABC Analysis.
However, it’s critical to keep in mind that ABC Analysis is a customized approach. Thus, it needs to be customized and updated frequently to take into account shifting business requirements and market trends. So, you should build a analysis generator from scratch or download Someka’s ready to use template for a dynamic ABC analysis tool.
Recommended Readings:
What’s SKU Number? Do we really need SKUs?
The Objectives of Inventory Management: Techniques, Challanges and Process in Detail!
Related Posts


