20 Most Used Call Center KPIs & Metrics
It can be a lot to track the overall performance of your call center due to its intense nature. If you would like to measure it accurately, you surely need to integrate call center KPIs and compare the call center key metric results in a tidy space.
To help you with this, we present the most used call center KPIs and explain them from the basics. Of course, you are always invited to check our Call Center Dashboard templates to ensure you perform the best with your call center.
What is KPI in Call Center?
KPIs for call centers are also called key performance indicators. Their purpose is to track the performance of Call Centers of an organization or a customer support department.
Why should you track call center KPIs?
Call centers are busy and highly performance-based businesses. So, tracking the key performance metrics is critical to see if the work is done successfully or not on the both real and virtual phone numbers.
What are the most important KPIs for call centers?
You should determine which Call Center KPIs are appropriate for your business or your customer support team. In this article, we present you 20 most used customer support metrics so that you can choose the fitting ones for your company.
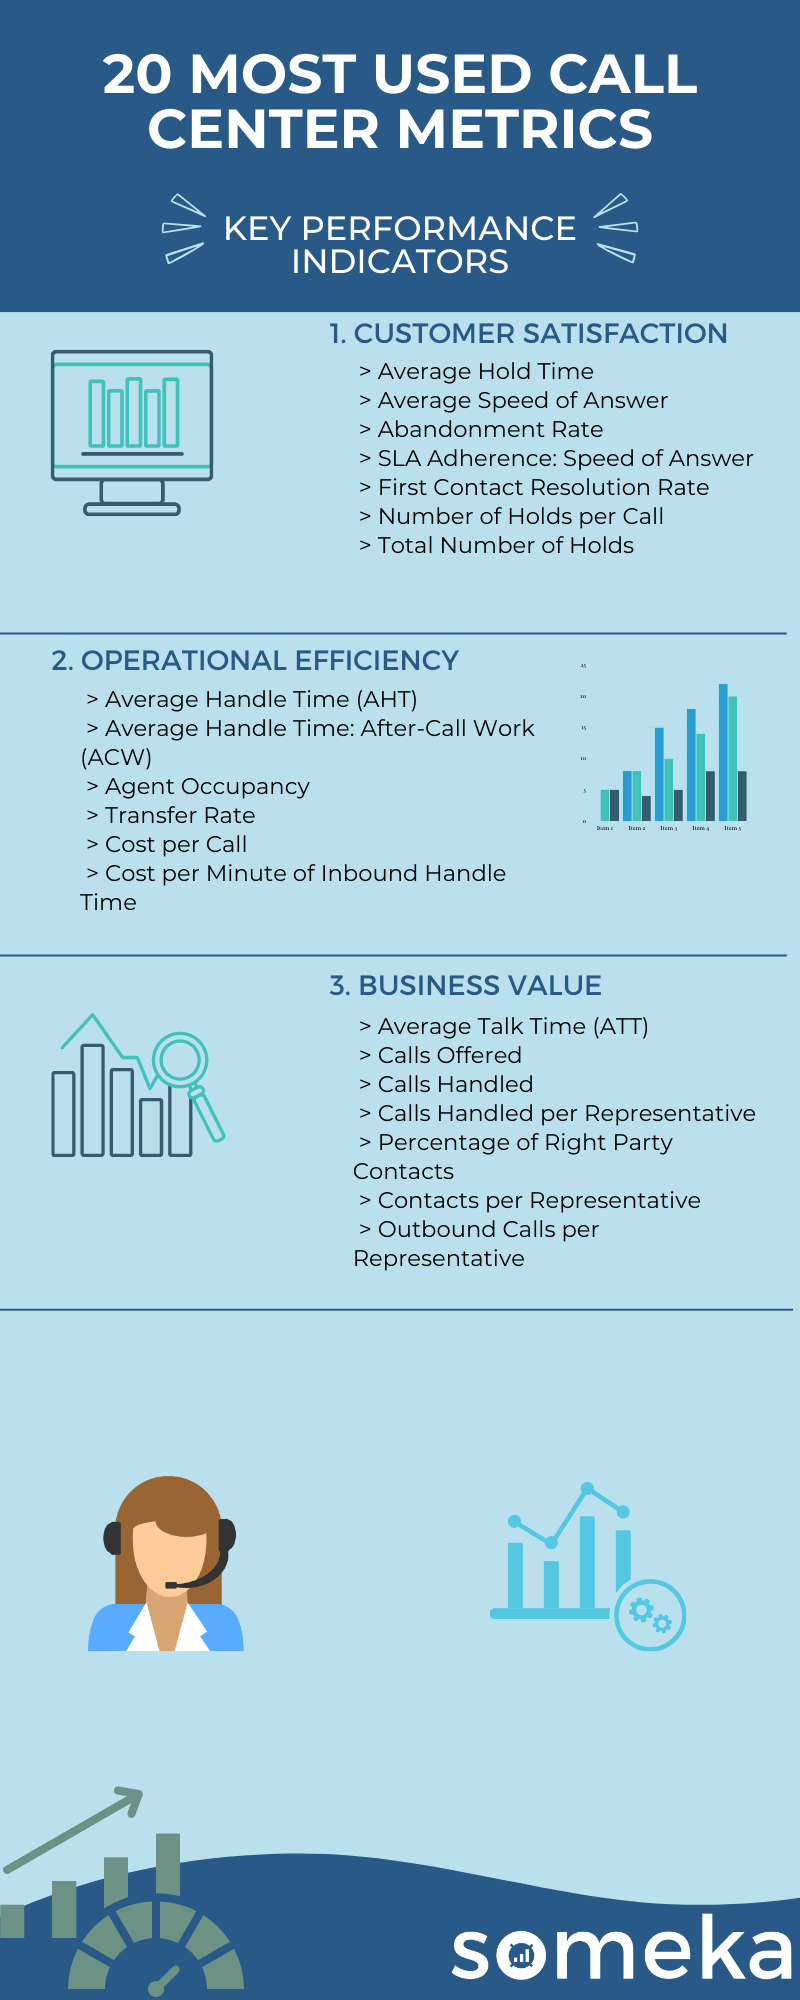
Call Center Metrics
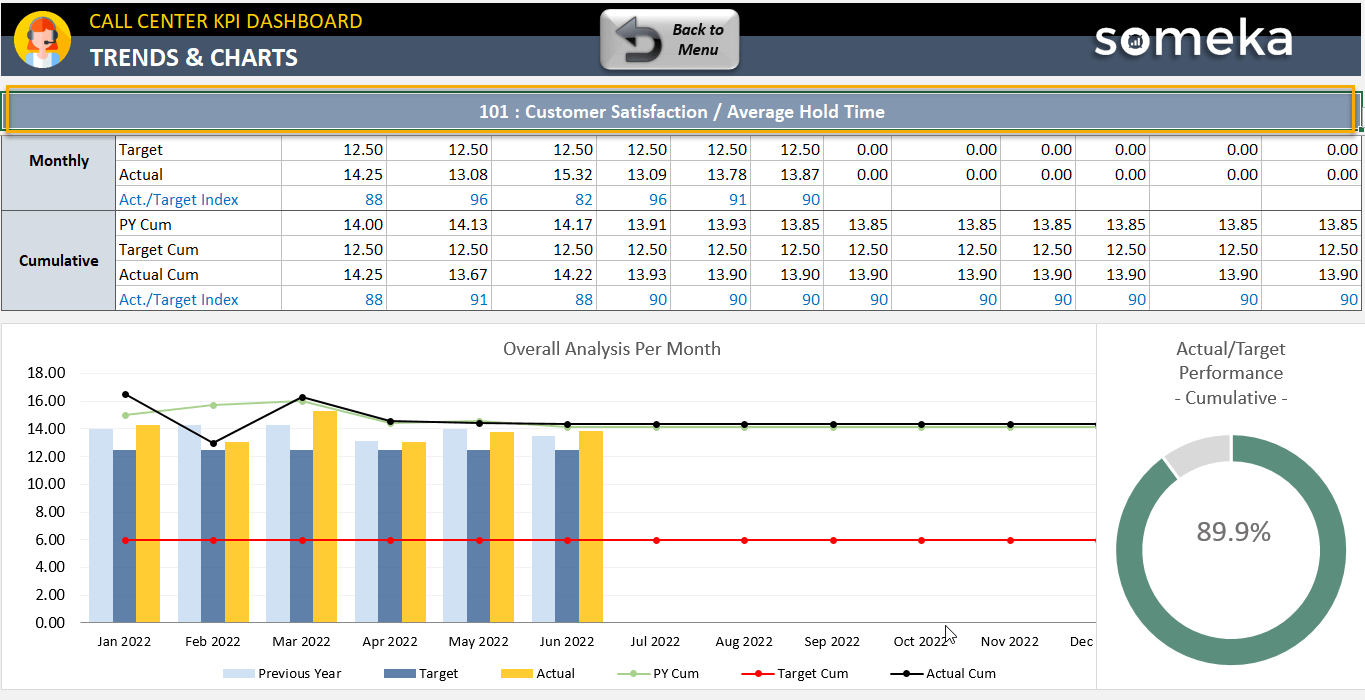
1. Average Hold Time
Call Center Metrics / Customer Satisfaction / Customer Relationship / Work Effectiveness / Work Efficiency
Description:It is an average total time that a customer is being put on hold and has to wait for an agent. Into the calculation includes the time in the queue waiting for a pick up the phone by an agent as well as time on hold between redirecting to another agent.
Should be High or Low?:If the customer must wait too long it may have a very big impact on the customer rating and increase the abandonment rate.
2. Average Speed of Answer (ASA)
Call Center Metrics / Customer Satisfaction / Work Efficiency / Quality
Description:It is one of the metrics used to keep your customer service level high. You should have a fixed standard and keep tracking results.
Should be High or Low?:If the time goes above your fixed standards you should probably consider enlarging your service team.
3. Abandonment Rate
Call Center Metrics / Customer Satisfaction / Work Effectiveness / Sales
Description:It is a ratio between all incoming calls and the calls where a customer hangs up before even talking to an agent. It may be caused by too long hold time, or too long and complicated automated procedure to reach the agent.
Should be High or Low?:if the ratio is growing there should be taken some steps because it can have influence on a customer satisfaction score
4. SLA Adherence: Speed of Answer (< 10 sec)
Call Center Metrics / Customer Satisfaction / Work Effectiveness / Sales
Description:This metrics is actually very similar to ASA. but here is represented as ratio comparing to the fixed answer time in service level agreement.
Calculation Method / Formula:ASA / fixed time in SLA
Should be High or Low?:If the time goes above your fixed standards you should probably consider enlarging your service team.
5. First Contact Resolution Rate
Call Center Metrics / Customer Satisfaction / Work Effectiveness / Sales
Description:The percentage of incoming calls correctly connected by the subject of the call. Those are the calls where is no need to redirect or follow-up an issue divided by the total number of incoming request/calls answered over the similar term. This metrics can depend on the Self-service rate and the customer awareness or the well-prepared contact form divided properly on possible subjects of issues.
Should be High or Low?:The high percentage tells that your company have a big knowhow and experience and is able to clarify and separate correctly the contact channels.
6. Number of Holds per Call
Call Center Metrics / Customer Satisfaction / Customer Relationship / Work Effectiveness / Work Efficiency
Description:Average number of keeping customer on hold.
7. Total Number of Holds
Call Center Metrics / Customer Satisfaction / Customer Relationship / Work Effectiveness / Work Efficiency
Description:Total number of keeping customers on hold.
8. Average Handle Time (AHT)
Call Center Metrics / Customer Satisfaction / Customer Relationship / Work Effectiveness / Work Efficiency
Description:Average Handle Time is a summary of time of the conversation with client (ATT) and time spent to finalize the task after the call (ACW).
Should be High or Low?:If the time is growing above expected target there might be some issues with product or the system availability.
9. Average Handle Time: After-Call Work (ACW)
Call Center Metrics / Work Efficiency / Sales / Time Management
Description:It is an average time that agents have to spent after the call with a client to finalize the transaction or a demand of calling client.
Should be High or Low?:If the time is growing above expected target there might be some issues with product or the system availability.
10. Agent Occupancy
Call Center Metrics / Work Efficiency / Time Management
Description:This metrics helps you to measure if you have enough employees hired. If their working time is fully used or not.
Calculation Method / Formula:Total Handle Time of all agents / Total Logged Time of all agents
Should be High or Low?:Their occupancy rate should be close to the upper limit but if the rate goes to 100% that mean most probably the customer’s time on hold is going up.
11. Transfer Rate
Call Center Metrics / Customer Satisfaction / Customer Relationship / Work Effectiveness
Description:That is a percentage of calls number that has to be redirected from one agent to another in order to be completed out of all calls. The remining part is being called First Contact Resolution Rate.
Should be High or Low?:If the ratio is high there must be some problematic channeling automation of the customers at the beginning of the call.
12. Cost per Call
Call Center Metrics / Cost / Marketing / Investment
Description:This is a total average cost related to one call. It is calculated by summing all the costs like together with electricity, equipment, wages, offices etc. And dividing it per all the calls in that time handled by all the agents. The cost depends on the time and how many calls can handle the agent. However, the time depends also on the employee experience and difficulty level of the incoming call.
Calculation Method / Formula:total costs per month / total number of calls in a month operated by the agents
Should be High or Low?:If the cost is growing you should investigate where the problem lies.
13. Cost per Minute of Inbound Handle Time
Call Center Metrics / Cost / Marketing / Investment
Description:This metrics can vary mainly if the occupancy rate will be going down. It is a measure of your total cost per total time of calls. If the agent occupancy rate is high that cost should stay the same. The other parameter is your fixed costs which shouldn’t vary too much.
Calculation Method / Formula:total costs per month / total time of calls in a month operated by the agents
Should be High or Low?:If the cost grows you may check the occupancy rate.
14. Average Talk Time (ATT)
Call Center Metrics / Customer Satisfaction / Customer Relationship / Work Effectiveness / Work Efficiency
Description:It is an average time that agents spent on the phone per customer to help with some problems of to close a transaction. It is a total time from the first moment of a call till the end of the call. We also include hold time or redirection to another agent.
Should be High or Low?:If the time is growing above expected target there might be some issues with product or the system availability.
15. Calls Offered
Call Center Metrics / Customer Relationship / Work Efficiency / Sales
Description:Total number of calls both handled by the agent and the abandoned ones.
Calculation Method / Formula:total number of calls
Should be High or Low?:Informative metrics.
16. Calls Handled
Call Center Metrics / Customer Relationship / Work Efficiency / Brand Value
Description:Total number of calls where a customer actually talked to an agent. It is a total number of calls minus the abandoned calls
Calculation Method / Formula:total number of calls – number of abondened calls
17. Calls Handled per Representative
Call Center Metrics / Customer Relationship / Work Efficiency / Sales
Description:It is an average number of calls per agent.
Calculation Method / Formula:Total number of calls / number of agents
18. Percentage of Right Party Contacts
Call Center Metrics / Work Effectiveness / Customer Relationship / Sales
Description:Those are contacts where an agent reaches the client, no meter of the result the call (sold or not sold services/product) out of total tries to contact the client. Total number includes the call backs and the no answered calls.
Calculation Method / Formula:number of an answered calls / (number of outcome calls + callbacks)
19. Contacts per Representative
Call Center Metrics / Work Effectiveness / Customer Relationship / Sales
Description:Average number of contacts divided by the number of agents in a period of time.
20. Outbound Calls per Representative
Call Center Metrics / Customer Relationship / Work Efficiency / Sales
Description:Average number of outcoming calls per agent.
Below is the summary of Call Center KPI metrics:
Most Important KPIs for Different Industries
Customer support metrics and Call Center KPIs are special for the niche. If you search for KPIs for other industries and departments, you are welcome to read our articles about KPIs!
Related Posts


