23 Most Used Construction KPIs & Metrics
Construction KPIs are metrics that are used to determine the success of a construction company and its projects. But which construction KPIs are the most fitting for your construction business? And what do they signify in your organization?
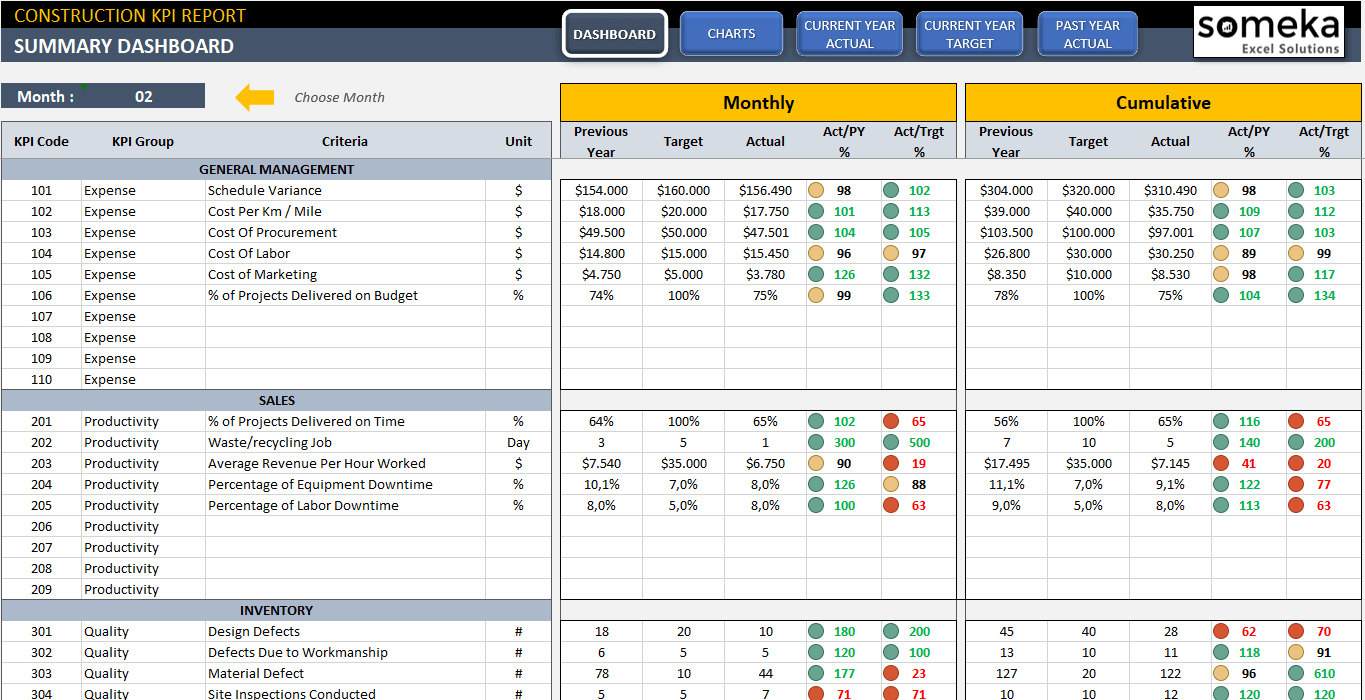
We answered these questions and explained the most significant construction key performance indicators below. Then, you can also download our Construction Dashboard templates to help you make the best KPI dashboard for your construction company.
What is KPI in construction?
Key performance indicators (KPIs) are used to track and improve the overall state of a business in construction.
Why should you track construction KPIs?
Construction companies need ongoing tracking of how successful they are with their targets and how they performed according to the previous years and months. Construction key metrics are used for this purpose.
What are the most important KPIs in construction?
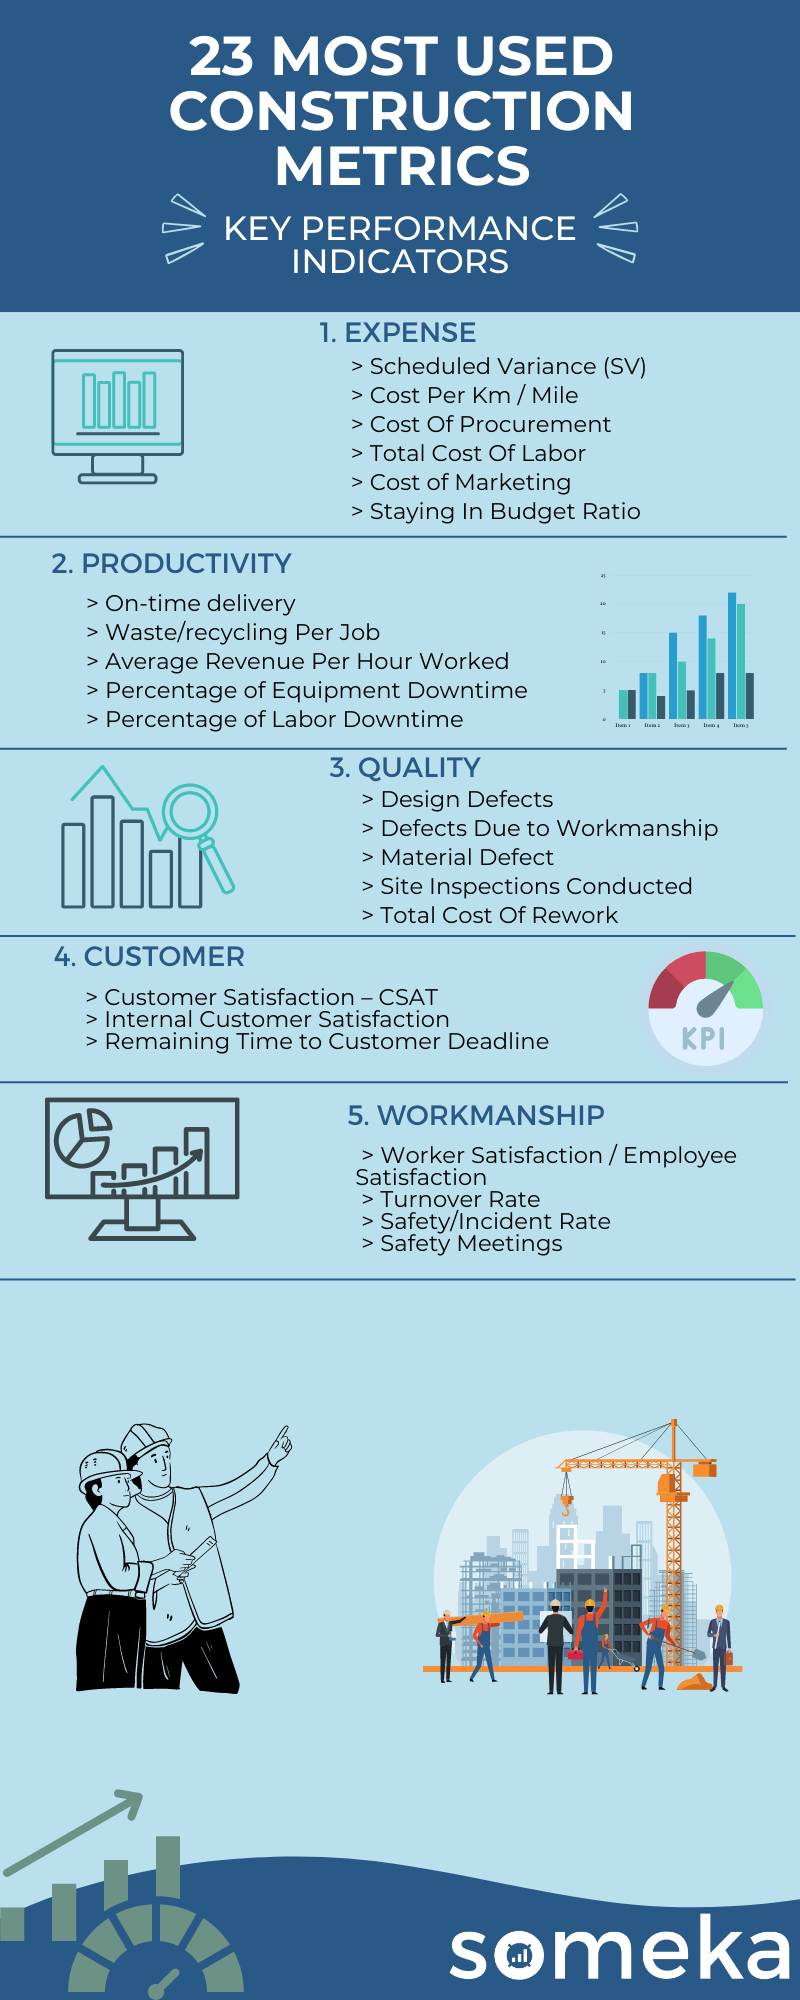
There are many different key metrics that are applicable for a construction company. We collected the most used 23 of them for you to check.
Construction Metrics

1. Scheduled Variance (SV)
Construction Metrics / Budget Management / Financial Performance / Revenue / Cost
Description:Schedule variance shows the differences in budget estimations and real situation. This metrics is calculated by the difference between EV and PV. Earned Value (EV) is the current value of the project in current form(status), other name Budgeted Cost of Work Performed. Planned Value (PV) is amount of money that were calculated to be spent on the project so far, other name: Budgeted Cost of Work Scheduled.
Calculation Method / Formula:Earned Value – Planned Value
Should be High or Low?:If the conclusion is: below 0 – you are behind the schedule – lost money; 0 – you are on schedule; above zero – ahead of schedule – earned money.
2. Cost Per Km / Mile
Construction Metrics / Work Efficiency / Cost
Description:The cost of 1 km or mile of building or construction. This metrics can be used for train station, subway system or an office tower. It depends on the project if the metrics is useful or not. Cost may depend on the materials and the robustness of the construction.
3. Cost Of Procurement
Construction Metrics / Cost / Financial Performance / Profitability
Description:The total cost of purchased goods or services depended on the project requirements. This number also includes all administrative costs, processing, shipping etc.
Should be High or Low?:If the cost excesses the budget, that should give fast reaction and recalculation for the possible budget.
4. Total Cost Of Labor
Construction Metrics / Employee Management / Employee Satisfaction / Investment
Description:The total cost of employee payments including taxes, bonus, benefits, etc. Total cost can grow for example if there is need to hire more people due to time limitations or due to hiring more experienced people.
Should be High or Low?:You can track if there is any budget left for extra hiring or rising salaries
5. Cost of Marketing
Construction Metrics / Cost / Marketing / Investment
Description:The total cost of all marketing activities such as an advertisement, promotion, customer support, etc. Good marketing is a base for high revenue.
Should be High or Low?:High budget may increase sales rate. It is good to remember that marketing cost is easy to underestimate (there is plenty of hidden factors in marketing).
6. Staying In Budget Ratio (Budget Discipline)
Construction Metrics / Budget Management / Planning Effectiveness / Cost / Savings
Description:How many projects out of total were delivered within set budget. It can give a projection on the further estimations. Projects overestimated are calculated as on budget, which can give a little false output value. If calculated just for one project it will just give the idea of percentage how accurate was the budget estimation in compare to reality.
Should be High or Low?:If the number is much below 100, it is also good to calculate % of projects with overestimated budget. That can give some lead for mistakes in estimation process itself.
7. On-time delivery (OTD)
Construction Metrics / Customer Satisfaction / Cost / Transport / Delivery Management / Inventory Management
Description:How many projects out of total were delivered on time. It can give a projection on the further estimations. Projects overestimated are calculated as on time, which can give a little false output value. If calculated just for one project it will just give the idea of percentage how fast project was completed in compare to the estimation.
Calculation Method / Formula:number of projects completed / number of sheduled projects to be completed
Should be High or Low?:If the number is much below 100, it is also good to calculate % of projects with overestimated time. That can give some lead for mistakes in estimation process itself.
8. Waste/recycling Per Job
Construction Metrics / Cost / Quality / Product Investment
Description:Also known as Mean Time Repair it is an average time between problem appearing and resolving it.
Should be High or Low?:If the number is growing it may suggest reorganizing work power or maybe extra hire.
9. Average Revenue Per Hour Worked
Construction Metrics / Work Efficiency / Financial Performance / Revenue / Profitability / Sales
Description:Total Revenue from a completed project per number of hours worked on that Project until complete. It can be calculated during the project, but then total revenue means revenue so far and the hours worked on the project so far.
Calculation Method / Formula:total revenue / total time (h) spent on the project
10. Percentage of Equipment Downtime
Construction Metrics / Work Efficiency / Cost / Equipment Efficiency / Work Time Management
Description:That metrics can show you in compare to previous year or a project your equipment productivity.
Calculation Method / Formula:down time / total working time (productive + nonproductive)
Should be High or Low?:If your ratio is too high, then you may reconsider to change your equipment. You should also compare the cost of maintenance old equipment. Right decision can be an advantage in the long term.
11. Percentage of Labor Downtime
Construction Metrics / Work Efficiency / Cost / Equipment Efficiency / Work Time Management
Description:This metrics compares nonproductive time within the working hours in compare to total number of working hours.
Calculation Method / Formula:down time / total working time (productive + nonproductive)
Should be High or Low?:Do you have too much unproductive time? You may reconsider your team management system.
12. Design Defects
Construction Metrics / Customer Satisfaction / Brand Value / Quality / Cost
Description:How many issues appear in a specific period of time. This metrics can include the defects of siding and fascia, windows, roofs, wood floors, ventilation, and drywall. Defects may also be related to design and engineering, soil, structure. Depending on the issue it may require some redesign and replacement, or it can be repaired by additional parts in the design.
Should be High or Low?:Unfortunately, not all the defects can be detected before the project is finished, but this number can be reduced if the hired employees have lots of experience and can project some of the possible issues.
13. Defects Due to Workmanship
Construction Metrics / Customer Satisfaction / Brand Value / Quality / Cost
Description:It is a number of problems appeared due to low qualification of the employees. The problem may come up due to lack of skills, expertise, or technique.
Should be High or Low?:Growing number might be caused by hiring new unexperienced people and lack of proper work organization. It is important to have highly skilled people in the team that can teach and check after the other workers.
14. Material Defect
Construction Metrics / Customer Satisfaction / Brand Value / Quality / Cost
Description:This metrics can measure the defects of materials that seemed to be according to the specification, but they cause problems after installation. You can also include the number of materials that were mistaken: wrong material number, color, wrong dimensions etc.
Should be High or Low?:If the number is going up time after time you may consider making a research on other suppliers or having an extra people responsible for checking the correct and well manufactured materials/components. Make sure to have all the product cards with specifications assured by manufacturer.
15. Site Inspections Conducted
Construction Metrics / Customer Satisfaction / Brand Value / Quality / Cost
Description:Regular inspections are an important part of the workplace. Inspections allows to measure all the other metrics like downtime or locate some defects but also helps to prevent any health and safety problems.
Should be High or Low?:In case of some accidents you should consider increasing the number as well as organize some extra H&S trainings.
16. Total Cost Of Rework
Construction Metrics / Cost / Quality / Product Investment
Description:Total cost of defects caused by supplier, material, or workmanship. But also, you may need to count the cost of rework due to customer complaints.
Should be High or Low?:You should consider what actions may give you lower number of defects and if those actions are worth to implement in compare to cost of rework.
17. Customer Satisfaction – CSAT (1-5)
Construction Metrics / Customer Satisfaction / Customer Relationship / Brand Value
Description:Once, you supply a product or service to your customers, you should measure if you meet their expectation and compare if the rating is growing with your experience or what has the biggest impact on the client satisfaction.
Should be High or Low?:The important is to be able to achieve higher results to the previous measurements or keep the same high standards.
18. Internal Customer Satisfaction (1-5)
Construction Metrics / Customer Satisfaction / Customer Relationship / Brand Value
Description:Internal customers are important as much as the external customers for your continuity business health.
Should be High or Low?:The important is to be able to keep the high standards and be able to detect eventual change of direction of your cooperation with the internal customer
19. Remaining Time to Customer Deadline
Construction Metrics / Customer Satisfaction / Brand Value / Work Efficiency / Work Time Management
Description:The ratio in percent of the passed time and remaining time till the deadline so it can be useful for other metrics related to estimation of the project timing.
Should be High or Low?:This is just an orientation information. That can be base for tracking if the project has chance to be on time or there are some preventive actions needed.
20. Worker Satisfaction / Employee Satisfaction
Construction Metrics / Employee Satisfaction / Employee Management / Budget Management
Description:To decrease your turnover rate, you should measure the employees’ work satisfaction. Check on their needs, complaints and engagement at work. You may create and follow a survey among them to understand the level of their happiness and satisfaction.
Should be High or Low?:It is important to keep the rate high, because that usually means better work results, less mistakes, better work atmosphere etc.
21. Turnover Rate
Construction Metrics / Employee Satisfaction / Brand Value / Cost
Description:This is a percentage of workers who leave and are replaced by new employees within some period of time.
Calculation Method / Formula:# of Employees Separated / Average # of Employees
Should be High or Low?:High number may lower the qualifications or increase the defect ratio due to less experience. Also, it increases a cost of the labor due to much lower productivity of the new employees. You should reconsider your employment strategy.
22. Safety/Incident Rate
Construction Metrics / Safety / Employee Satisfaction / Brand Value
Description:This important metrics shows your safety performance level. You should track safety of your workplace and be able to compare your company’s safety performance with other companies in the same sector. You should always try to improve the safety of your workers.
Calculation Method / Formula:You may measure by:
1) number of days without an accident / total number of thays (in specyfic period of time or the whole curretn project)
2) number of accidents/number of days (in specyfic period of time or the whole curretn project)
Should be High or Low?:Lower number means high safety (low incident rate).
23. Safety Meetings
Construction Metrics / Safety / Employee Satisfaction / Brand Value
Description:You should create and improve your safety performances by providing sound guidelines to improve safety-related communications. Provide H&S trainings for the workers and check their practical knowledge on that matter.
Should be High or Low?:This is an important activity and should not be lower down to the minimum because it can cause increase the work incidents number.
Below is the summary of Construction KPI metrics:
Most Important KPIs for Different Industries
Performance seems different for every industry, so key metrics vary for each of them. Discover the KPIs of other industries with our KPI articles.
Related Posts


