
How to Make a Decision Tree in Excel? Step-by-Step Guide
Do you want to create a outcome diagram for an important decision? Then go through this step-by-step guide to learn how to create a Decision Tree Excel format?
We’ll provide you an ready-to-use solution in addition to two other options creating a decision tree in Excel from scratch.
Let’s go!
Table Of Content
2. What’s a Decision Tree used for?
3. What are the Elements of a Decision Tree?
4. How to Make a Decision Tree in Excel?
- Option 1: Using Someka Decision Tree Generator
- Option 2: Using Basic Shapes and Lines
- Option 3: Using SmartArt Graphics in Excel to Build a Decision Tree
1. What’s Decision Tree?
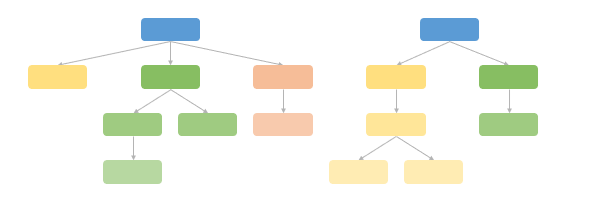
A decision tree is a structure that looks like a flowchart and shows the different outcomes that can happen when a series of choices are made. It’s like a plan that shows you all the possible outcomes of each choice you make. Each leaf in a decision tree shows a possible result of the decision. Each branch shows a choice between several options. A lot of people use this tool for strategic management, operational study, and making decisions.

2. What’s a Decision Tree used for?
Decision trees are very flexible and can be used in a wide range of situations. They’re mostly used to help people make decisions, especially when different options lead to different results. Businesses use decision trees to plan their strategies and handle risks.
In the tech world, they are essential for data mining and machine learning to create new algorithms. They make hard choices easier to understand by drawing out the results of each option, which helps you picture what might happen.
3. What are the Elements of a Decision Tree?
The elements of a decision tree include:
Nodes: These represent decisions, outcomes, or other key action points. There are two types of nodes: 1. Decision Node, 2. Chance Node. Decision nodes basically represents a decision needed to make, while the chance nodes show different possible results.
Branches: They symbolize the choices leading to different paths.
Leaves: The end points or final outcomes of each decision path.
4. How to Make a Decision Tree in Excel?
We’ll give you three options in this post to create decision tree excel diagrams.
- Ready template
- Basic shapes and lines
- Excel SmartArt Graphics
The first of these option is the easiest way of creating a dynamic decision tree. So we’ll start with this option before diving into the other two options creating decision tree matrixes from scratch.
Option 1: Using Someka Decision Tree Generator
Someka has a unique Decision Tree Generator in the project management portfolio. This tool with help you create your decision tables in seconds.
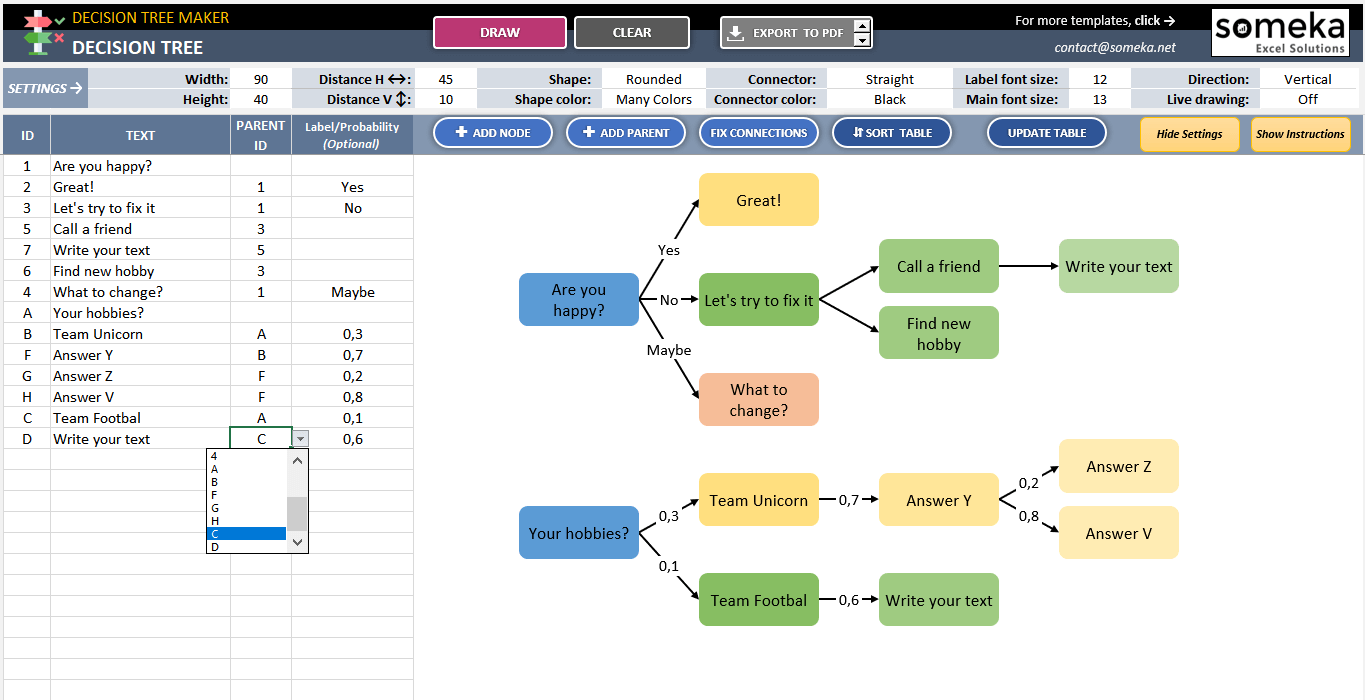
– This image is from Decision Tree Generator in Excel by Someka –
#Step1 – Prepare Your List:
You’ll first prepare your list for tasks, options, ideas or any other texts. These will be names of the each shape on your decision tree.
Now add the parent ID to each task. So, this column lets you design the order of your shapes.
Optionally, you can add labels which can be Yes/No or Maybe in addition to some probability ratios.
#Step2 – Draw Your Decision Tree:
When you’re done with your list, just click on the Draw button. That’s all!

#Step3 – Configuration:
- If you want to modify your tree, you can use configuration buttons to make design change. Here’s some of the options you can do with only button clicks:
- Select your desired connector type.
- Adjust the width and height of the text box.
- Define the layout type and customize the gap size between shapes.
- Customize the font size to suit your preference.
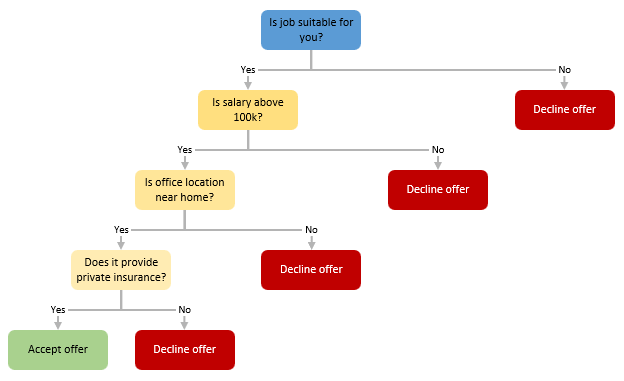
#Step3 – Print:
Now your decision tree is ready to print or use in your presentations. Use the Export button to export your diagram to PDF, PNG, or JPG formats for easy sharing or printing.
Option 2: Using Basic Shapes and Lines
One of the most common ways of creating a decision tree on an Excel workbook is using basic shapes and lines.
#Step1 – Adding Shapes:
Please find the shapes gallery in the Illustrations group under the Insert tab. You’ll see a shapes group under this gallery. Select the shapes according to your decision tree design.
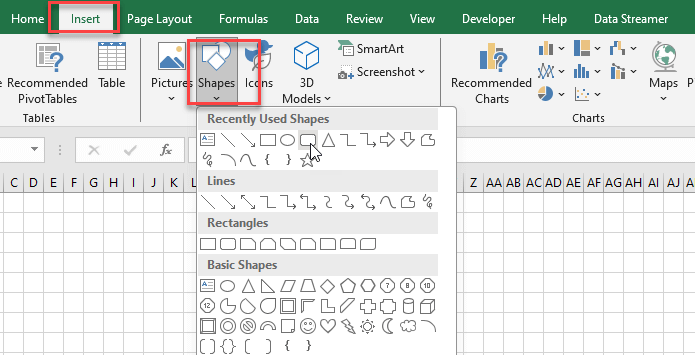
Begin by inserting various shapes to represent nodes and decisions.
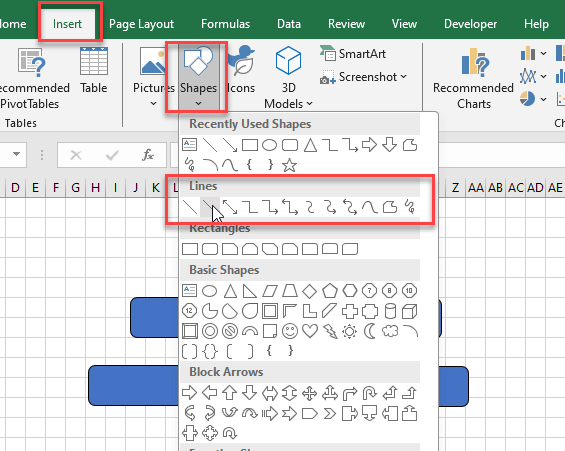
#Step2 – Adding Connector Lines:
So, now you can connect the shapes with lines to illustrate the decision paths. You can add arrows also under the Shapes Gallery. Just select Line Arrows to connect your shapes.
#Step3 – Adding Texts:
Insert text to describe each decision and outcome. Double click on the shapes and start to write your texts.
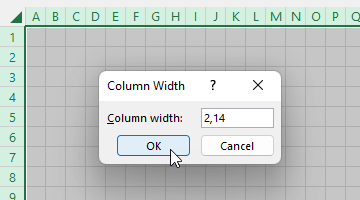
#Step4 – Customizing Shapes:
Now it’s time to apply some make-up on our decision tree. So feel free to select each shape and customize the colors, size, and fonts.
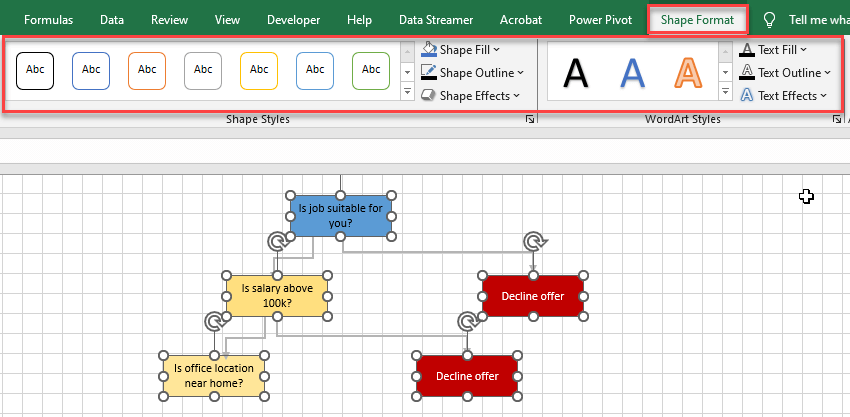
Here remember that the colors and the fonts of your shapes signifies the importance of your shapes.
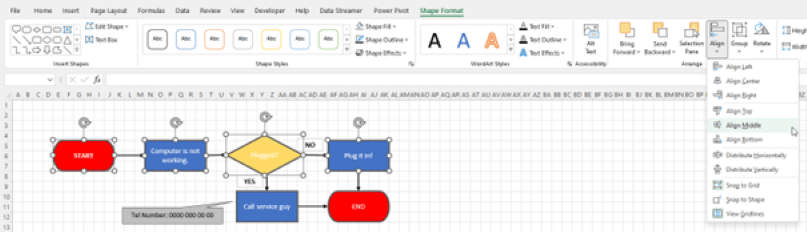
#Step5 – Aligning the Shapes:
Lastly, we can align and organize the shapes to ensure the tree is coherent and easy to follow.
To make an alignment, select the targeted shapes, and go to Shape Format > Align. In addition, you may align your shapes in the center or in the middle, or you can distribute them vertically/horizontally. This is totally up to your choice.
Also, don’t forget to use Snap to Grid or Snap to Shape options for more easy dragging. Select a shape and go to Shape Format > Align and click Snap to Grid and Snap to Shape.
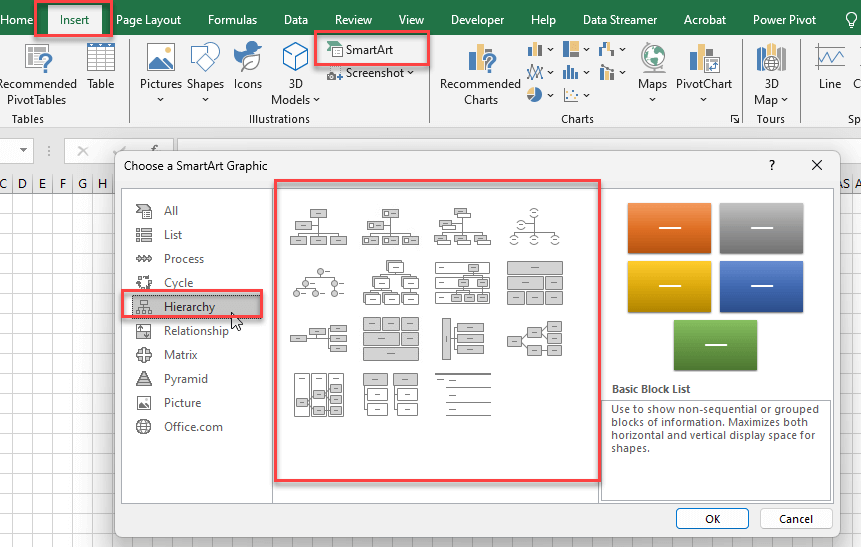
Option 3: Using SmartArt Graphics in Excel to Build a Decision Tree
Another common way of creating decision trees, and also other diagrams like org chart, flowcharts or family trees is the Smart Art add-in in Excel.
Open SmartArt Graphic Gallery under Insert > Illustrations > SmartArt section. Now you can choose an option under the Hierarchy group on the left pane:
You can choose the best hierarchy diagram for your decision tree. After adding a SmartArt diagram, you can easily add new shapes. In addition, you can customize your decision tree under the SmartArt Design tab.

5. Wrap Up
It’s easy to make a decision tree in Excel, whether you use SmartArt Graphics, a special tool like Someka Decision Tree Generator or Shapes/Lines and SmartArt methods. You can choose which way to use based on your needs and how comfortable you are with Excel.
Benefits of using a ready-to-use template:
- Save time and energy
- Dynamic diagram – you can add new shapes even after creating the whole decision tree
- Easy-to-customize
- Sleek-design
- Works in Excel
- Visio Alternative for Mac users
Along with decision matrix tool, the decision trees can be very helpful when you’re trying to make a choice because they can help you understand your options and guess what will happen. There are many ways to make decision trees in Excel that look good and are full of useful information. This can help you with both strategic planning and data analysis.

6. FAQ’s on Decison Tree Excel
Here are some of the most common questions on Excel decision trees.
How do you create a decision in Excel?
To create a decision tree in Excel, you can follow these methods:
- Use Shapes and Lines
- Using SmartArt
- Ready-to-use templates
Can Excel make a tree diagram?
Yes, Excel can be used to make a tree diagram. While it doesn’t offer a direct tree diagram tool, you can create one using the ‘Shapes’ feature to draw the tree structure. Another method is using the SmartArt graphics option, where you can choose a hierarchical layout to represent a tree diagram. These tools allow you to customize and build a tree diagram suited to your specific needs.
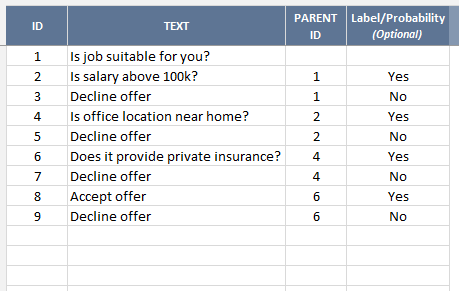
How do I create a decision table in Excel?
Creating a decision table in Excel involves organizing your data into a structured format:
- Set Up Your Table
- Input Conditions and Actions
- Define Rules
- Format for Clarity
- Use cell formatting options like borders, colors, and text styles to make the table easy to read and understand.
This method allows you to clearly define and visualize the decision-making criteria and the corresponding actions in a logical, tabular format.
Recommended Readings:
Related Posts


