11 Most Important Finance KPIs & Metrics
Are the metrics you use to track your finance team’s performance right for you? Every organization will need certain key metrics and the correct finance KPIs to measure its success. Find the correct path you need to track with this guide we prepared for you. It consists of the what and whys of finance metrics and the most used finance KPIs.
And after reading this post, don’t forget to check our Finance Dashboard templates we developed to make finance easy for you!
What is KPI in finance?
A finance KPI (key performance indicator) is a metric that helps you to assess a financial project, financial organization, or finance departments in companies. There are many different KPIs and metrics that you can use to analyze financial performance.
Why should you track finance KPIs?
Finance is a very demanding area and related processes should be improved on a daily basis. That’s why you should be tracking and improving the most important finance KPIs regularly.
What are most important KPIs in finance?
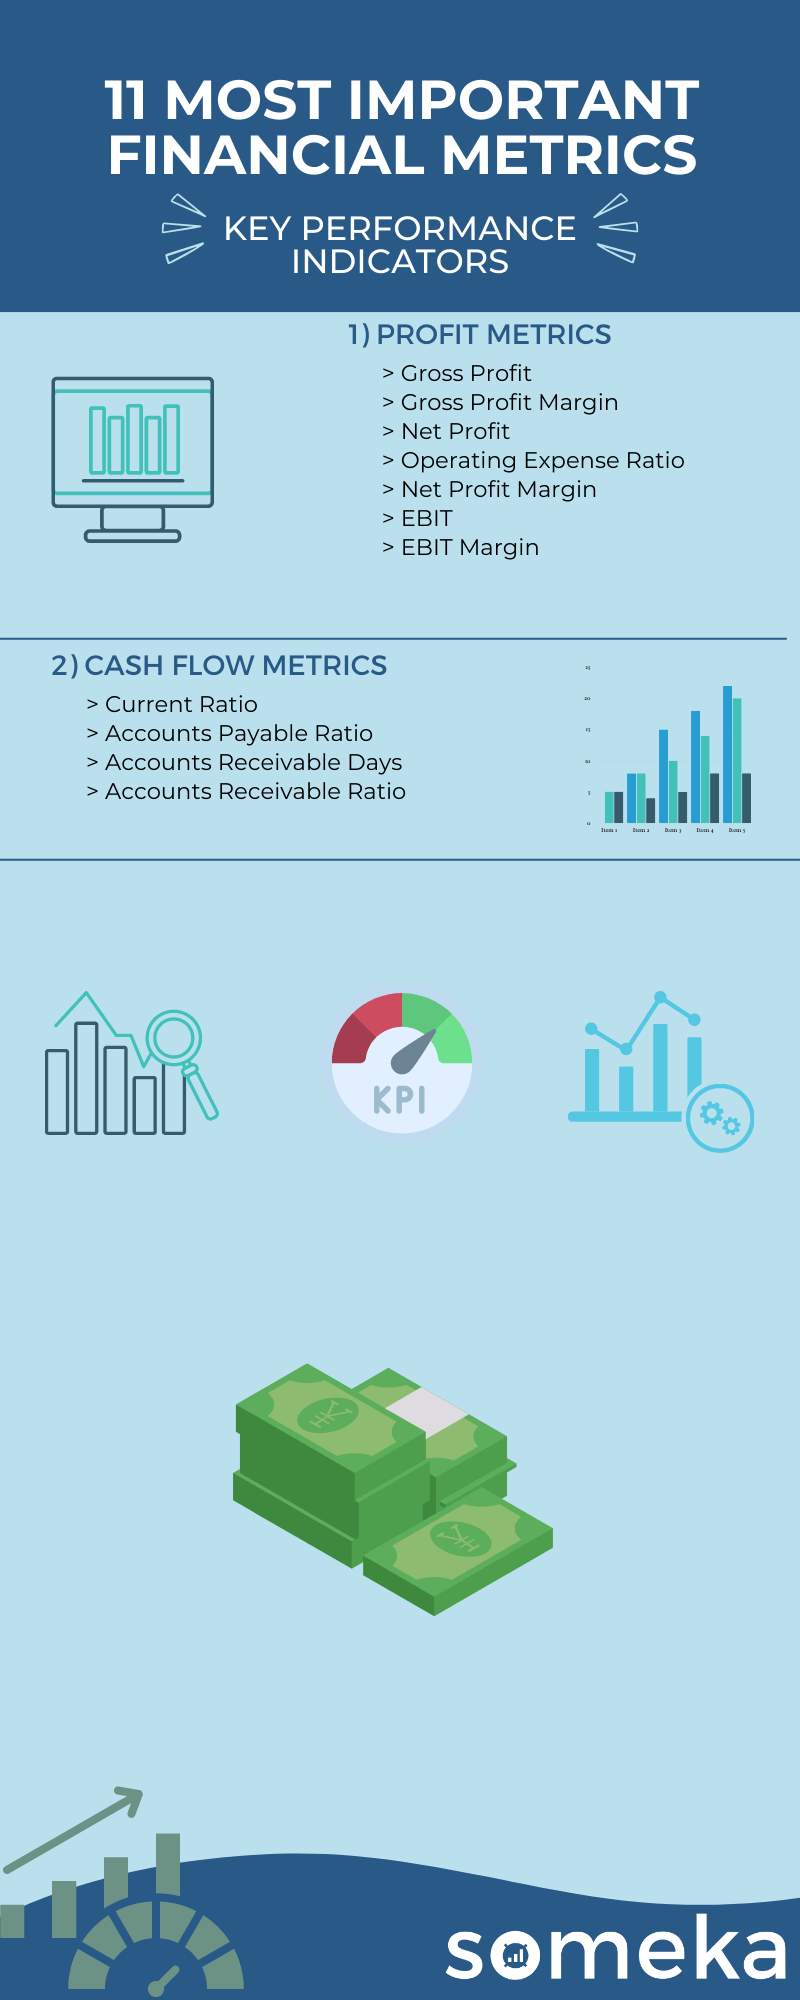
While there are many KPIs that you can use for finance, we gathered the most used ones below. There 11 critical KPIs which you shouldn’t ignore when you assess your finance success in your finance KPI dashboard.
Finance Metrics
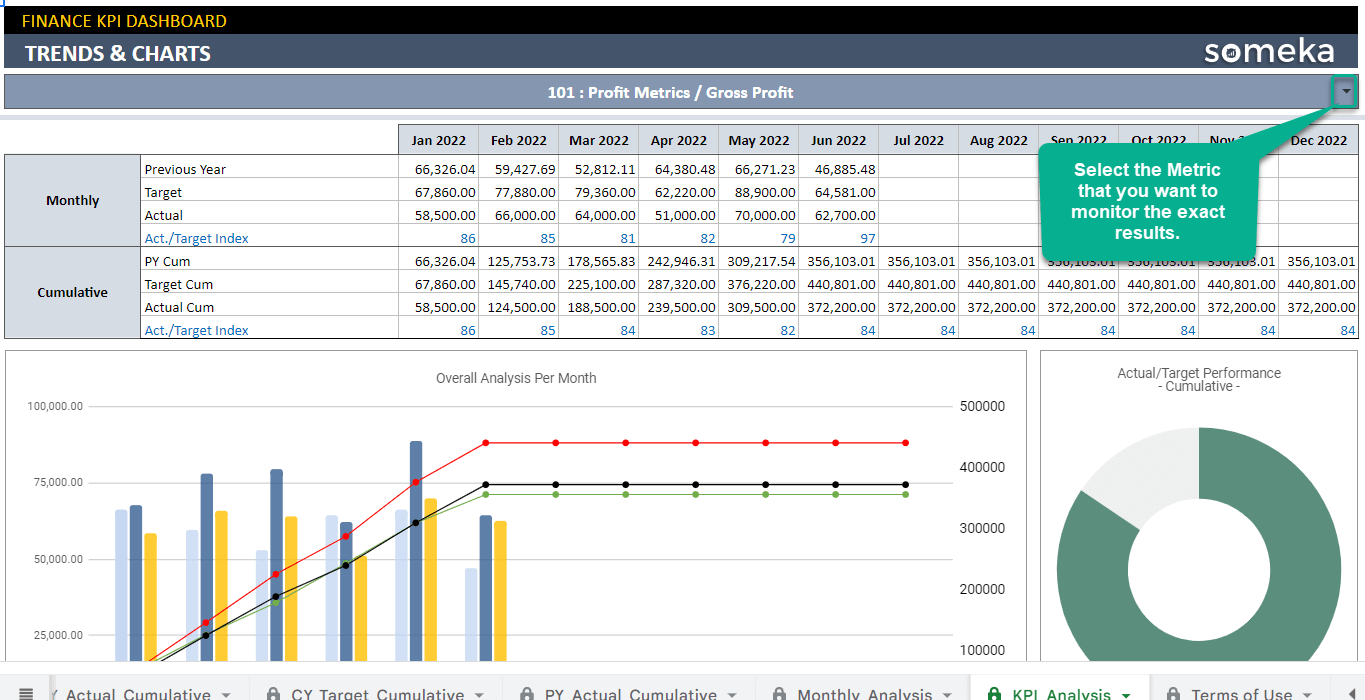
1. Gross Profit
Finance Metrics / Budget Management / Financial Performance / Revenue / Profitability
Description:Gross profit is the profit a company makes after deducting the costs associated with making and selling its products, or the costs associated with providing its services. Net sales revenue minus its cost of goods sold
Calculation Method / Formula:Net Sales – COGS (Cost Of Goods Sold)
2. Gross Profit Margin
Finance Metrics / Budget Management / Financial Performance / Revenue / Profitability
Description:How much profit you make on each dollar of sales before most of the expenses. The gross profit is calculated by the total revenue reduced by the cost of sale of those goods. Comparing this metrics with Net Profit margin you can also track all the other expenses that are not directly related to COGS.
Calculation Method / Formula:(Sales Revenue-COGS)/Revenue.
Should be High or Low?:If the number is going down, you should consider maybe removing products that doesn’t bring enough income but generates some problems and cost for improvement and customer support. If the gross margin is growing that means the investment in COGS is bringing high income and allows to improve and grow your product and services.
3. Net Profit
Finance Metrics / Revenue / Financial Performance / Profitability
Description:It is the total profit made at the end of the month. It is calculated as total income minus total costs including tax. It shows how profitable is your company month by month. Depend on the size of the company costs will not only grow but they might be quite complex to follow.
Calculation Method / Formula:Revenue – Total Expenses (taxes included)
Should be High or Low?:It may vary depending many factors, like time of the year, new competitors on the market etc. But in case dropping dangerously it may give a strong hint to study the reasons.
4. Operating Expense Ratio (OER)
Finance Metrics / Budget Management / Revenue / Sales / Business Performance / Work Efficiency
Description:It’s important to understand your operational effectiveness by tracking the operating expense ratio. It is related to daily company’s core operations. The lower those expenses are, the higher profit is made. operating revenue and operating expenses are related to your company’s main activity
Calculation Method / Formula: Operating Expenses / Revenue
Should be High or Low?:You can track changes and estimate possible outcomes on operating improvements.
5. Net Profit Margin
Finance Metrics / Budget Management / Financial Performance / Revenue / Profitability
Description:It is a measure of how profitable your company is. The metrics is a percentage of net income out of total income and the main factor here are the costs of that income. If you are able to reduce costs your profit margin will grow visible.
Calculation Method / Formula:Net Profit / Revenue
Should be High or Low?:It is impossible to eliminate costs and reach 100% but general analysis of your marketing strategies and company targets may give you a good direction how to increase your revenue. Sometimes decreasing costs may be a good option but sometimes increasing budget may give you much higher revenue than the investment.
6. EBIT
Finance Metrics / Budget Management / Financial Performance / Revenue / Profitability / Sales
Description:This metrics shows financial performance of the company as level of generated profits from sales. Can be used to compare profitability between companies or industries. Counting total as operating revenue is important to understand how big percentage of the total income coming from your company’s main activity. This way you can see real productivity and profitability of the main business operations.
Calculation Method / Formula:Revenue coming from company’s primary business – COGS – Operating Expenses
Should be High or Low?:This metrics depending on many factors can be very suitable for measuring performance of the company, but it can also give false readings of real financial performance. Some of the companies
7. EBIT Margin
Finance Metrics / Budget Management / Financial Performance / Revenue / Profitability / Sales
Description:It is a measure of how profitable your company’s main activity is. The metrics is a percentage of operating income to the value of net sales. Operating income (EBIT) exclude cost of goods and operating expenses so if you are able to reduce those costs your profit margin will grow visible.
Calculation Method / Formula:EBIT / Net sales
Should be High or Low?:If the value drops you may have look closer on your investments, marketing and budget planning.
8. Current Ratio
Finance Metrics / Assets / Inventory Management / Sales / Business Management
Description:This metrics checks how likely you company can pay all its liabilities in a short time (less than one year). It is a ratio between your company’s liabilities, credits, obligations etc. and the total assets value owned by the company.
Calculation Method / Formula:current assets / current liabilities
9. Accounts Payable Ratio
Finance Metrics / Assets / Inventory Management / Sales / Business Management
Description:It measures how fast a company pays off its suppliers.
Calculation Method / Formula:Supplier Purchases / Average Accounts Payable
Should be High or Low?:A high result means that the time between purchasing goods and paying for them is short. And the opposite the lower ratio means longer time to pay to suppliers.
10. Accounts Receivable Days /
Days Sales Outstanding (DSO)
Finance Metrics / Revenue / Financial Strategies / Sales / Work Effectiveness
Description: It is the average length of time to collect accounts receivable, or in other words how long it takes to receive the money for goods that was sold.
Calculation Method / Formula:(Accounts Receivable / Revenue) x Number of Days In Year
Should be High or Low?:Below 45 days Is considered as very good.
11. Accounts Receivable Ratio
Finance Metrics / Assets / Inventory Management / Sales / Business Management
Description:This metrics shows effectiveness of a company at issuing credits and collecting debts in a specific period of time.
Calculation Method / Formula:Credit Sales / Average Accounts Receivable
Below is the summary of Finance KPI metrics:
Most Important KPIs for Different Industries
KPIs differ from industry to industry due to different natures of different industries. If you’d like to discover which KPIs are used for other fields, we collected them for you.
Related Posts


