Financial Statement Templates: Free Excel and Google Sheets Formats
Understanding financial statements is essential to determining the health of a business. In this article, you’ll find Financial Statement Template formats in Excel and Google Sheets for the all main financial tables with detailed guidance.
Table Of Content
1. Understanding Financial Statements
2. Profit and Loss Statement Template
3. Balance Sheet Template
4. Cash Flow Statement
5. How to read financial statements?
6. Conclusion
1. Understanding Financial Statements
The foundation of financial analysis is the financial statement. Basically, financial statement templates provide information about the cash flows, profitability, and stability of an organization’s finances.
Financial statements offer a quick glance at the financial health of an organization. So for anyone involved in business or finance, understanding these templates is essential.

What are the three 3 most common financial statements?
The cash flow statement, balance sheet, and profit and loss statement are the three main statements.
Besides those, break-even analysis, equity change tables aging reports and tax returns are among the other important financial statements.
While each one has a different function, they offer a thorough picture of the financial situation of an organization when taken as a whole. So, making educated decisions requires an understanding of these claims.
2. Profit and Loss Statement Template
Also known as Profit and Loss Statement (P&L), the income statement is one of the main financial statements and displays the company’s revenues and expenses during a particular period. Basically, it provides an overview of the earnings, outlays, and costs for a given time frame.
The Income Statement analysis the ability of the business to turn a profit in a given period.
Someka provides a ready-to-use Profit and Loss Template with instant download:
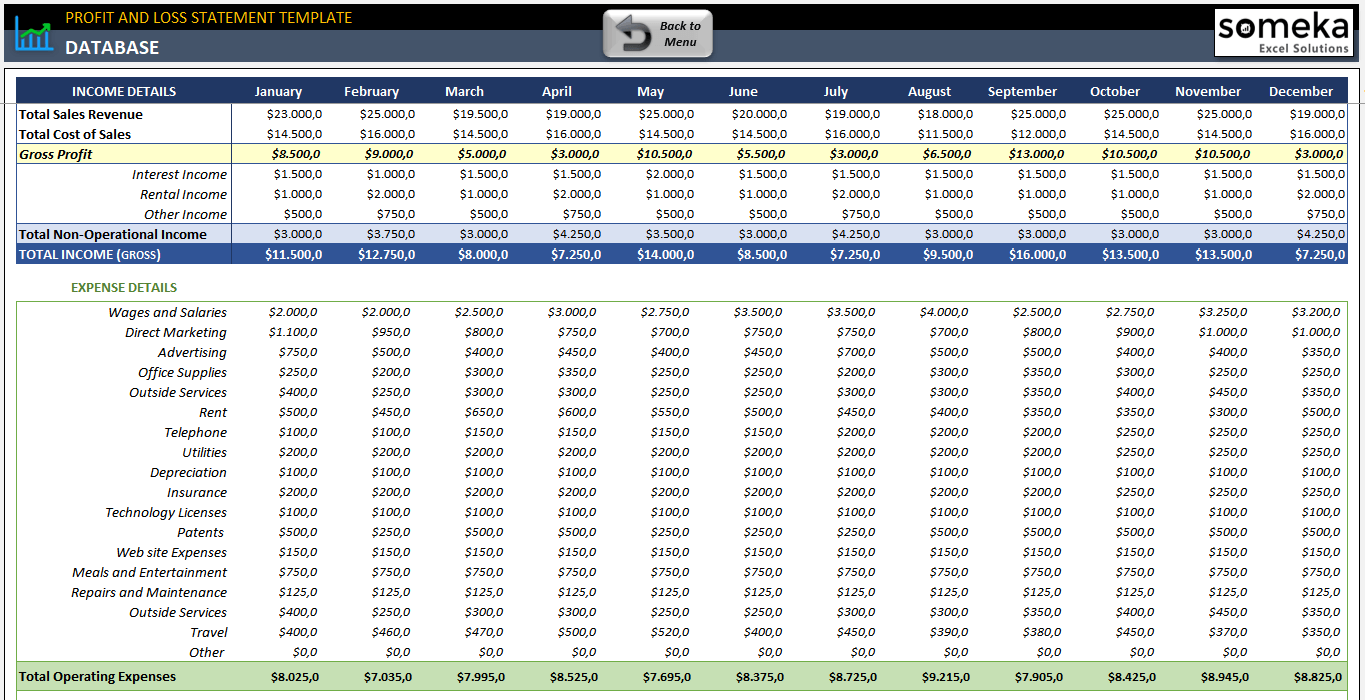
– The main income statement section of P&L Template by Someka –
Key features of Income Statement Template:
- Printable and editable
- Includes an analysis dashboard
- Easy-to-use
- Monthly Income Statements
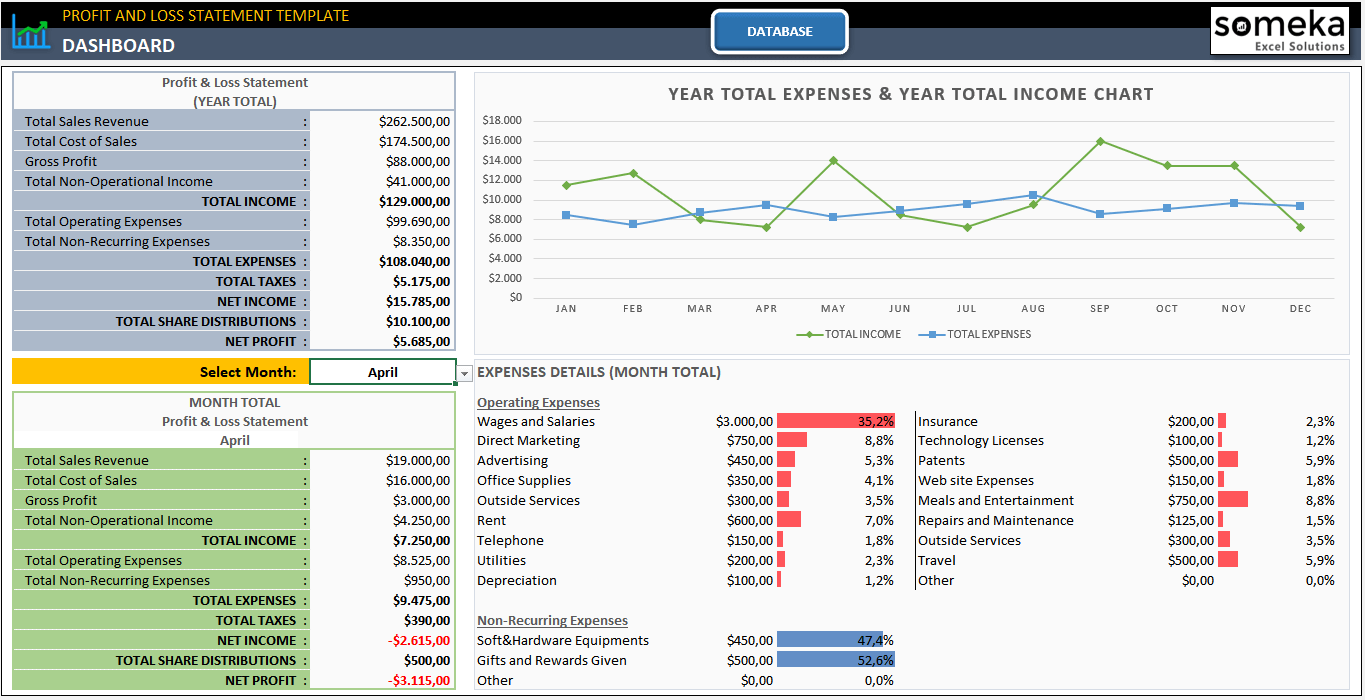
– This is the Dashboard section of Profit and Loss Excel Template by Someka –
It’s an essential tool for stakeholders to comprehend trends in profitability. Also, the P&L Statement is a key tool for directing strategic financial planning.
Also, if you need an online version you can download Profit and Loss Statement Google Sheets Template.
3. Balance Sheet Template
The Balance Sheet is a snapshot of a company’s financial condition. It lists assets, liabilities, and shareholders’ equity at a specific point in time.
The Balance Sheet provides insights into what a company owns and owes. It also shows the amount invested by shareholders.

– This is the main section of Balance Sheet Template by Someka –
The main parts of Balance Sheet Financial Statement Template:
ASSETS:
- Assets section contains those valuable items you own.
- Current assets are those you expect to realize during the next 12 months.
- Non-current assets are those you expect to hold for more than 12 months from the date of balance sheet.
LIABILITIES & EQUITY:
- Liabilities section contains amounts that you owe to other persons.
- Current liabilities are those you expect to settle or pay during the next 12 months.
- Non-current liabilities are those you expect to exist for more than 12 months from the date of balance sheet.
- Equity is a residual part of the assets’ value that belongs to the company shareholders.
In addition to an analysis dashboard, Someka’s template also provides an Print Form.
Lastly, this template is a fully editable spreadsheet. So you can easily customize this file according to your needs. And if you want to use an online version, you can download Google Sheets Balance Sheet template with access from every device.
What is the difference between income statement and balance sheet?
The Income Statement and the Balance Sheet are both essential financial statements, but they serve different purposes and provide different types of financial information.
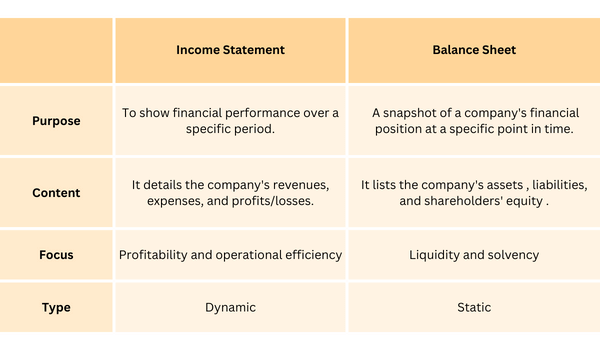
In summary, the Income Statement is about a company’s income and expenses over a period, showing profitability. In contrast, the Balance Sheet is a snapshot of what the company owns and owes at a specific point in time, reflecting its financial stability. Also, they are two of the main financial statement template formats.
4. Cash Flow Statement Template
Cash flow statement tracks the flow of cash in and out of a business over a period.
This statement categorizes cash flows into operating, investing, and financing activities. And, each section calculates total proceeds and total payments regarding the relevant activity group.
- Operations refers to cash flow generated from the trading activities, such as buying and selling goods or services.
- Investments refers to cash flow generated from purchasing and selling investment assets, such as property, plant and equipment (PPE), equity interests or debt securities.
- Financing refers to cash flow generated from raising and repaying equity and debt capital, and paying return on it.
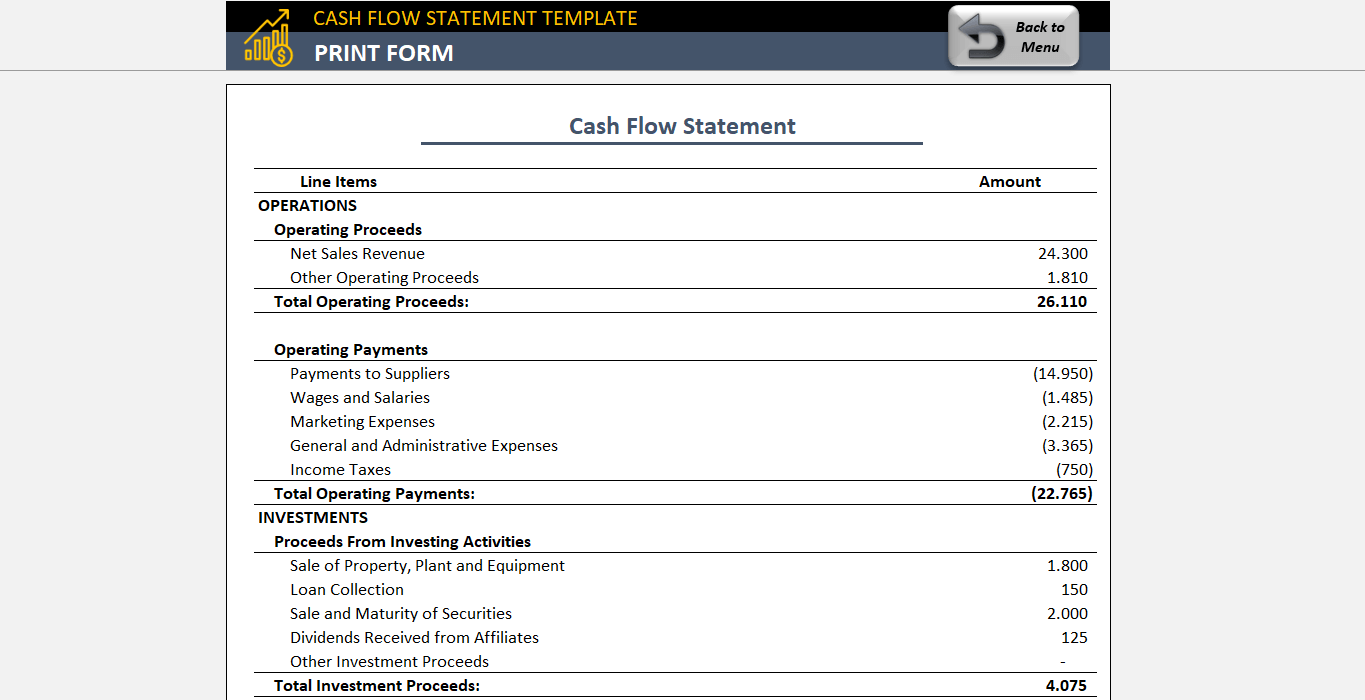
– This is a screenshot from Someka’s Cash Flow Statement Excel Template print page –
Firstly, this statement helps in understanding the cash generated from business operations. If you want to track them in an online spreadsheet, you can also download our Cash Flow Statement Google Sheets Template.
Also, the Cash Flow Statement is essential for assessing a company’s liquidity and financial health. It aids in determining the ability to cover debts and fund operations.
5. How to read financial statements?
Reading financial statements effectively is a vital skill. We summarize reading financial statement template in four main groups:
- Understanding the basics
- Ratio Analysis
- Trend Analysis
- Visual Representations
Understanding the basics of financial statements:
It starts with understanding the basics of each statement:
- The Profit and Loss Statement shows income and expenses.
- The Balance Sheet outlines assets, liabilities, and equity.
- The Cash Flow Statement reflects cash movement.
So it’s important to know the main purpose of each statement.

Ratio Analysis:
Another key financial statement tool is the ratio analysis. Key ratios derived from these statements provide insights into profitability, liquidity, and financial health. Analyzing trends over time is crucial for a complete financial assessment.
So we can groups ratios as below:
- Liquidity Ratios: Current Ratio, Asit Test Ratio
- Profitability Ratios: Net Profit Margin, Return on Assets, Return on Equity
- Leverage Ratios: Debt-to-Equity Ratio, Interest Coverage Ratio
- Efficiency Ratios: Asset Turnover Ratio, Inventory Turnover Ratio
- Market Value Ratios: Price-to-Earnings Ratio, Earnings per Share
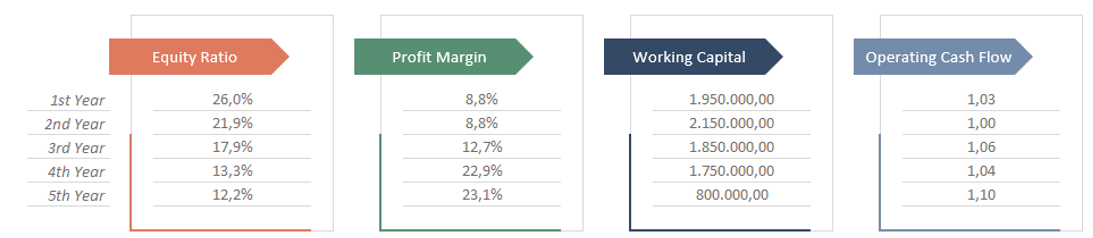
Let’s give some examples from the Ratio Analysis. These ratios are calculated according to the data you input in Income Statement, Balance Sheet, and Cash Flow Statement.
- Equity Ratio = Total Equity / Total Assets
- Profit Margin = Net Income / Net Sales
- Working Capital = Current Assets – Current Liabilities
- Operating Cash Flow = Operating Cash Flow / Current Liabilities
These are some examples from ratio Analysis.
Trend Analysis
Trend analysis in financial statement template is a financial analysis technique that involves comparing historical financial data over a series of reporting periods. It helps in identifying patterns, tendencies, or trends in the financial performance and condition of a business. This analysis is crucial for forecasting future performance based on past trends.
A trend analysis needs:
- Time-frame selection
- Defining the key items
- Percentage calculations
- Pattern observation
- Comparative analysis
Visual Representations
Especially, for your presentations to creditors, board members, shareholders or other interested parties, visual representations are very important to show financial statement report analysis.

– This is the dashboard section of Cash Flow Statement Template by Someka –
Firstly, you should present your charts cleanly. Also, each dashboard should tell a story of your main arguments.
Additionally, the financial statements are also the indispensable parts of business plans.
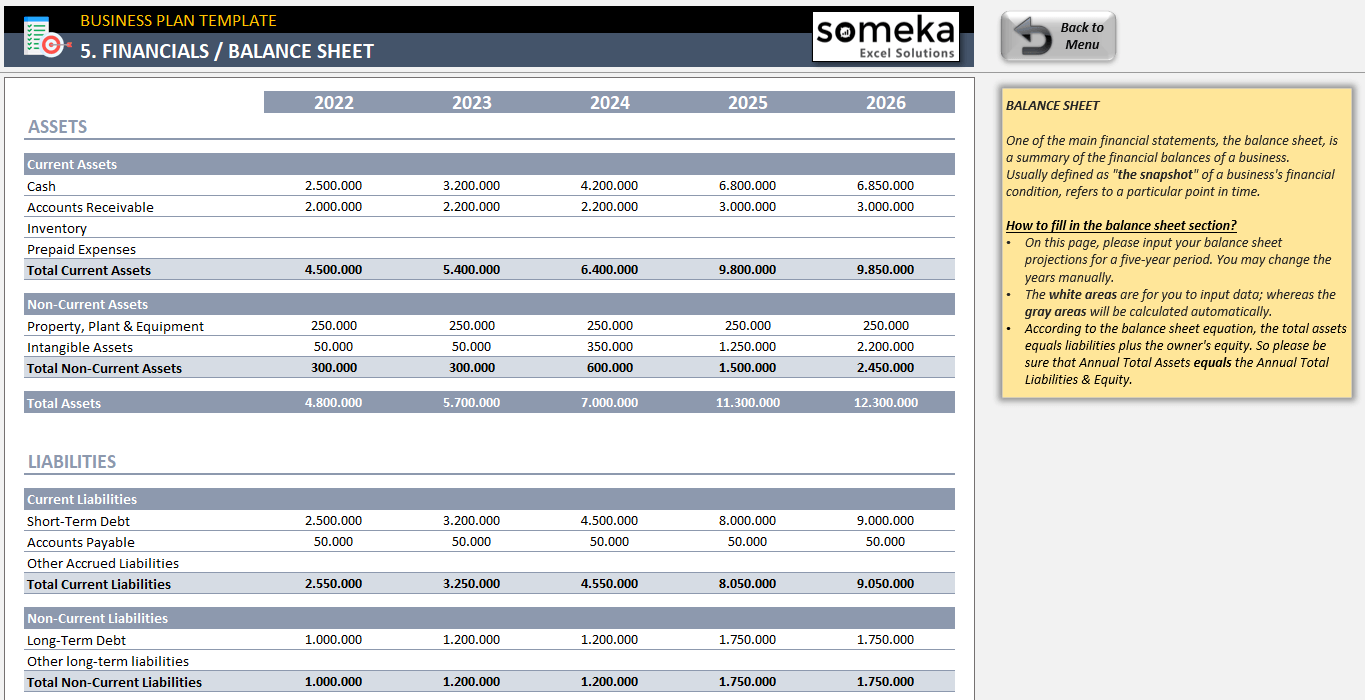
– This is the Balance Sheet section of Someka’s Business Plan Excel Template –
Also, you should always add financial statements to your feasibility studies or financial modellings:
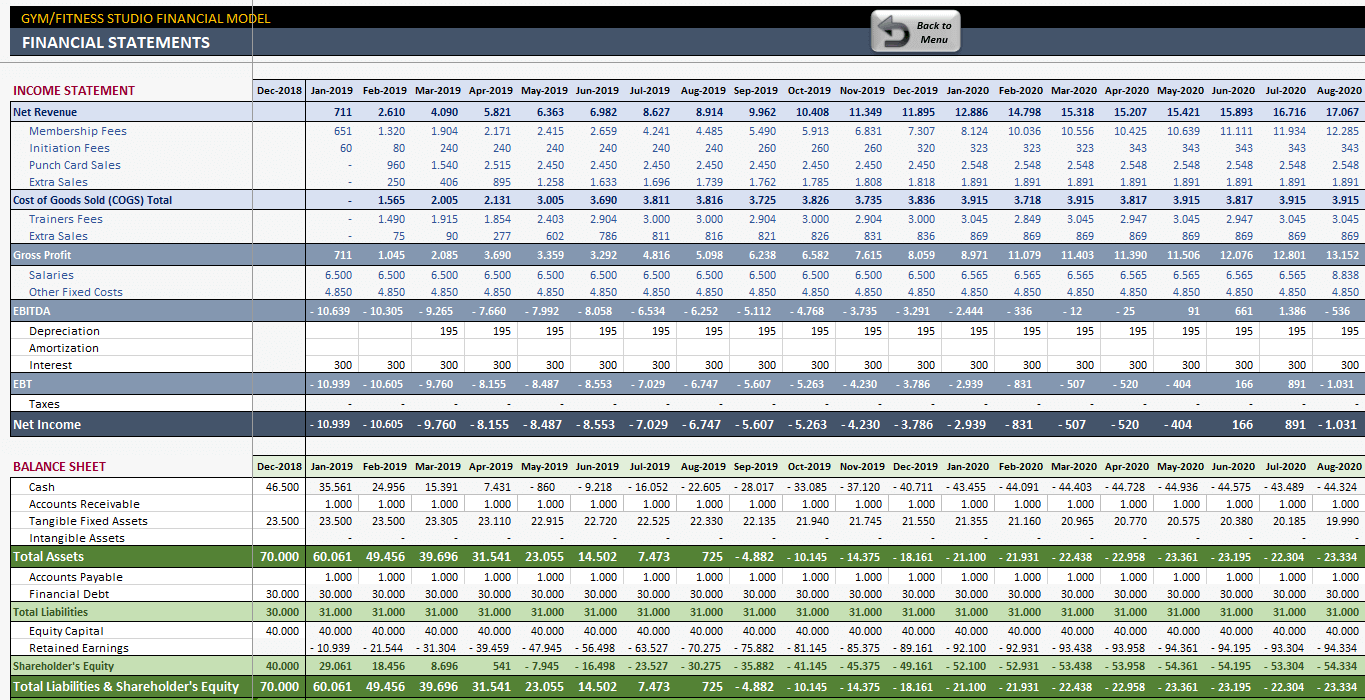
– This is the financial statements section of Someka’s Gym Financial Model –
6. Conclusion
Financial statements are the core reports of every business, no matter the size is. While they’re very important tools to analyze financial health of a company, they are also mandatory for most companies in most countries.
So, we tried to provide you key information about financial tables in addition to Financial Statement Template formats with:
- Editable spreadsheets
- Includes printable statement forms
- Analysis dashboards
- Ratio and trend analysis
- Provided in Excel and Google Sheets
- Ready and easy to use
Then, you can download our financial statements and other accounting templates to ease your financial operations. Lastly, our collection is for all accountants, business owners, start-ups, finance departments, budget employees, and all other cost related departments.
Recommended Readings:
DCF Model in Excel: How to calculate Discounted Cash Flow?
How to Build an Ecommerce Financial Model? A Complete Guide
NPV Excel Formula: How to calculate Net Present Value in Excel?
Related Posts


