How to Create to Flowchart in PowerPoint? Easy Steps with Examples
Want to design a process flow? Not only make it, but also display it in a process map or flowchart? Finding information on how to make a flowchart in PowerPoint should be a top priority. It could sound quite difficult. No need to worry; we are here to present that expertise. PowerPoint should be updated with a flowchart. After checking this blog post, your Powerpoint flowchart and presentations can greatly benefit from the usage of PowerPoint.
On the other hand, it can occasionally sound excessively chaotic to organize facts, data, or other similar material for PowerPoint presentations. Do you truly want to appear to be an expert on workflow? or just simply prefer to insert a flow chart to PowerPoint. Let’s examine PowerPoint and adaptive tools in more detail.
Table of Contents
1. How do I Make a Flowchart in PowerPoint?
1.1. Creating PowerPoint Flowchart Manually in PowerPoint
1.2. Using an Automatic Flowchart Maker
2. Data Connection Between Excel and PowerPoint
3. Conclusion
4. FAQs
1. How do I Make a Flowchart in PowerPoint?
PowerPoint, which is the most used presentation tool of the business world, provides serious importance in the presentation of flowchart and data charts in general. When using PowerPoint, it is vital to be able to smooth create a flowchart, define a process, and display it on a process map. Now let’s go step by step around our basic question of how to make a flowchart on Powerpoint. If you are ready, we will start.

1.1. Creating PowerPoint Flowchart Manually in PowerPoint
First, to create a flowchart in PowerPoint, you can follow these steps:
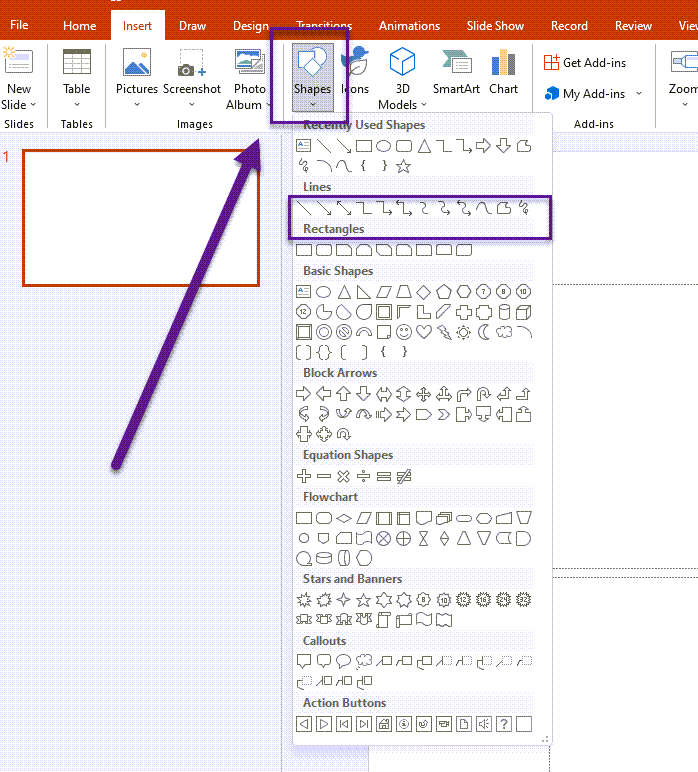
Step 1 – Illustrations Tab
Open between a new or existing presentation in PowerPoint. Click the “Insert” button on the “Home” tab of the PowerPoint ribbon.
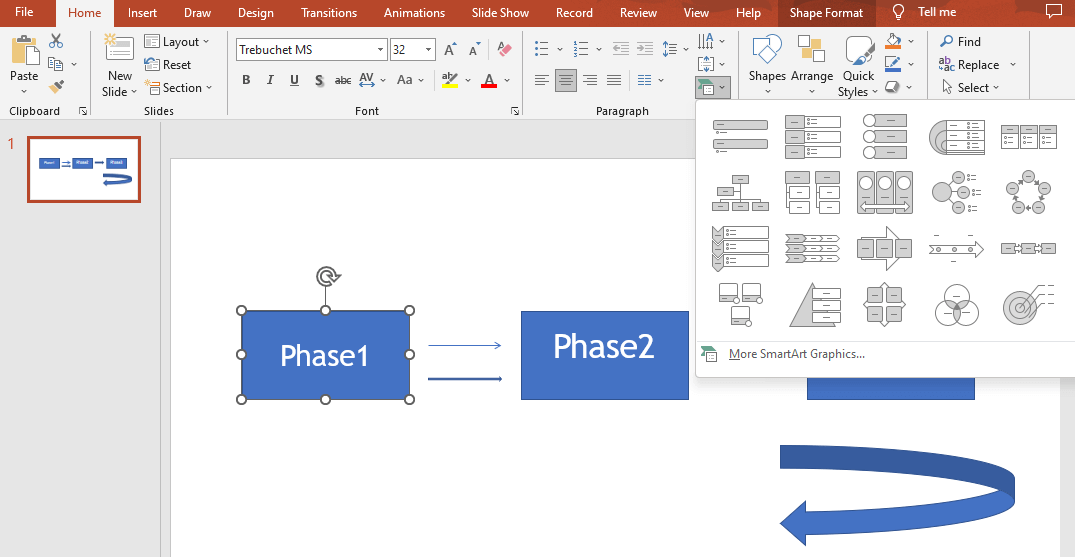
Step 2 – Illustrations Options
Click the “Shapes” button under the “Illustrations” tab. There will be a drop-down menu with several shapes. Choose a shape from the drop-down menu to serve as the foundation of your flow chart (such as a rectangle for the process phase). Please take as many steps as you need to repeat if you need to.

Step 3 – Design of the Process Chart
Click and drag on the slide to create the shape. Adjust the proportions and placement as desired. Double-click inside the shape to add text by typing it into the “Shapes” box. As a result, in order to decide on the design of the process chart or flow chart to be created.
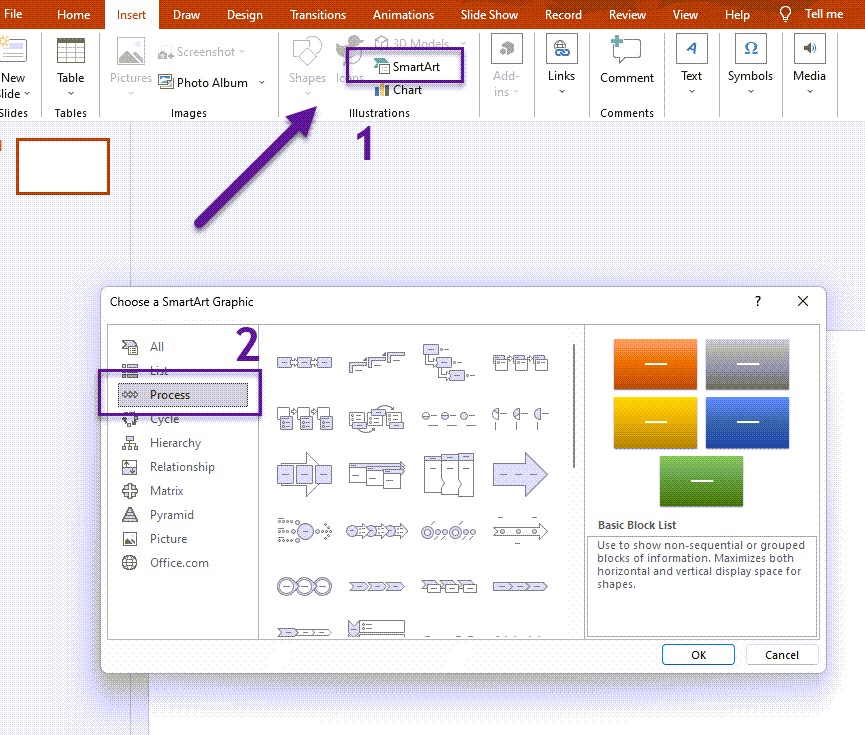
Or alternatively, you can use the SmartArt functions on the Illustrations tab. To start creating a PowerPoint flowchart, you can choose which flow diagram is suitable in the “Process” section. Then you can apply and/or change the date regarding the flow chart necessities.
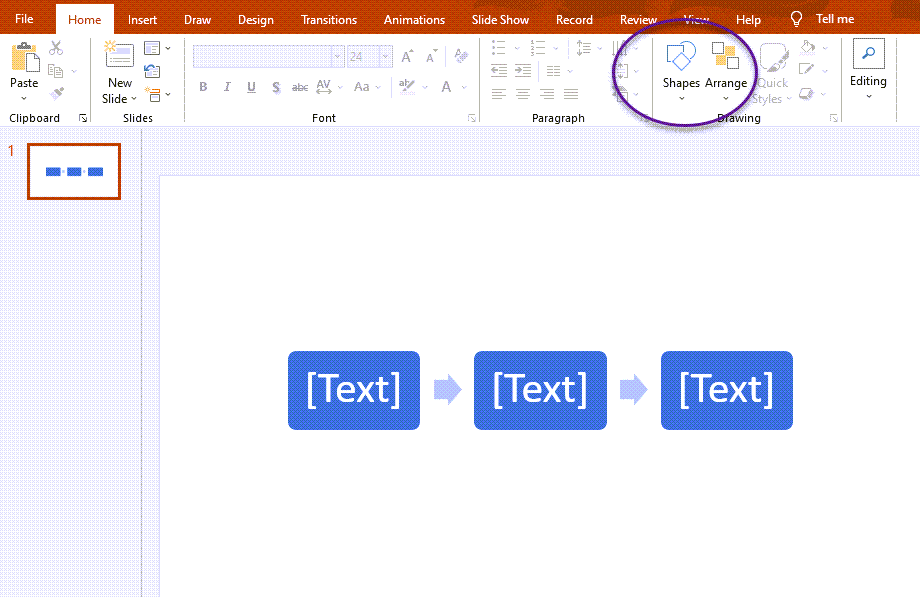
Step 4 – Building the Flow Chart
To connect the shapes with arrows or lines, go back to the “Shapes” menu, select a connector line (e.g., an elbow connector or a curved connector), and click and drag from one shape to another. This will create a line connecting the shapes. Continue adding shapes and connectors until you have completed your flowchart.
Alternatively, you can improve your PowerPoint flowchart by using the SmartArt features.
Step 5 – Formatting the Flow Chart
You can format the shapes individually by selecting them and using the formatting tools accessible in the PowerPoint ribbon. Change the fill color, line color, line thickness, font style, and so forth.
You can also include additional elements. Your diagrams may become easier to understand and more visually appealing with the assistance of these extra features. However, it’s crucial to only use them when they significantly enhance the diagram’s overall message.
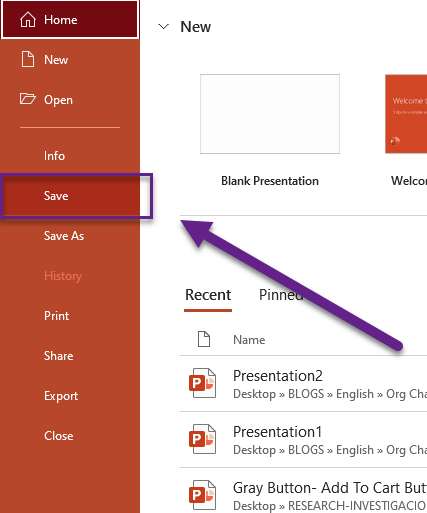
Step 6- Saving the Flow Chart
Once your PowerPoint flowchart is complete, you can save and present your PowerPoint presentation.
Consider that while PowerPoint can create basic flowcharts, for more complex and advanced flowcharts, you should consider using dedicated diagramming software such as Microsoft Excel or online flowchart tools that provide more features and flexibility, such as dynamic swimlane and ready-to-use Excel template options or some Excel flow chart maker templates.

1.2. Using an Automatic Flowchart Maker
If you don’t want to make your flowchart manually, then you can use a Flowchart Maker Template to save you time!
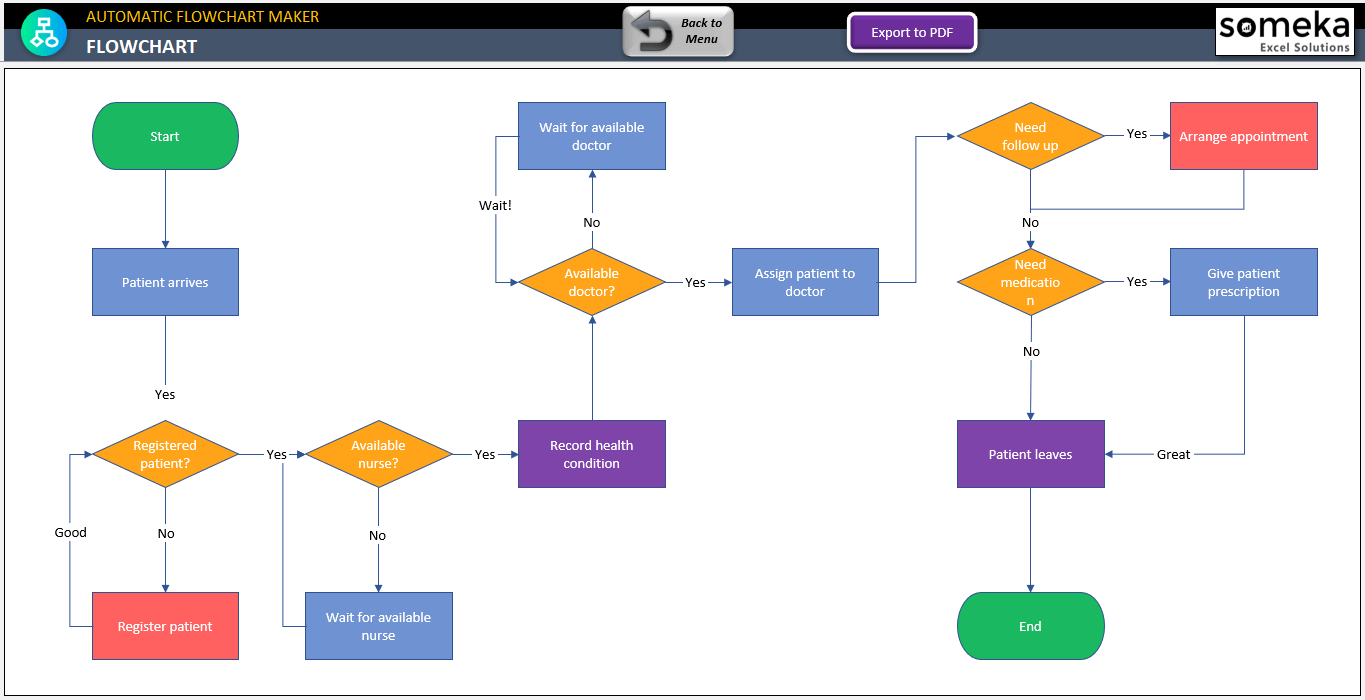
– This flowchart diagram is automatically created on Flowchart Maker Excel Template by Someka –
You had an idea about making a flowchart in Powerpoint. Now, there is a way that more dynamic, easier, faster and surely time-saver way to make it on Microsoft Excel.
Flowcharts are used in a variety of areas to organize and simplify complex procedures into simply understandable images. Hence, this Excel template, referred to as the Automatic Flowchart Maker, allows you to input your data and generate a workflow at the click of a button! Moreover, you have the option to personalize your flow chart using advanced customization parameters. Consequently, This process mapping tool has a wide range of possibilities:
Let’s put Someka‘s Automatic Flowchart Maker in Excel to the test. To begin, almost all online flowchart generators use the drag-and-drop method. This method is much better to making a PowerPoint flowchart in PowerPoint. For example, when you make a design, you must drag every piece of shape, connect them, and write processes within the shape. Excel Flowchart Maker, on the other hand, provides a quick and easy framework for visualizing your flow diagram and making charts with a single click.
You can also create flowcharts in Excel before exporting them to PPT:
2. Data Connection Between Excel and PowerPoint
In this case, you can transfer data if you create the flowchart in Excel. You can link data from a saved Excel spreadsheet to your PowerPoint presentation. If the spreadsheet data changes, you can easily update it in your PowerPoint presentation. To get this, take these steps:
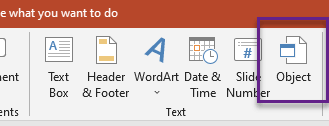
- In PowerPoint, go to the Insert tab and select Object.
- Select Create from file in the Insert Object dialog box.
- Click or tap Browse, and then navigate to the Excel workbook containing the data you wish to insert and link to.
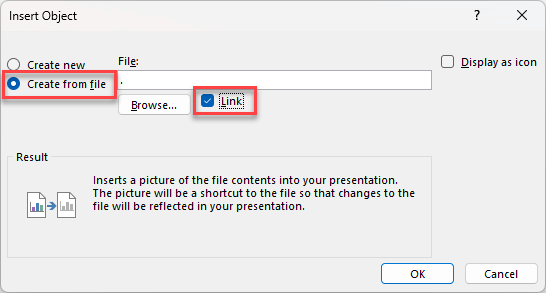
- Select Link and click OK before closing the Insert Object box.
By this way, you’ve created the data connection between the Excel template and your Powerpoint presentation. By this method, you can change and update the database for your flowchart or any other data for presentation on Powerpoint.
3. Conclusion
When it comes to project management, document flowcharts are critical for analysts to fully understand and record the different kinds of work processes that occur in the company. Data flowcharts represent the flow of data within an information system visually, whereas system flowcharts display the flow of data through system components and control options. A mind map is also graphic in which the connected thoughts are organized around the principal visual representation of the concept. As a result, it communicates the author’s point of view on a particular issue or subject. You may also use an Excel template to create an expert mind map presentation.
These charts assist in the creation of an overview of the overall system without digging into the specifics of data and information. System flowcharts are essential tools for showing the effectiveness of your business or the company. Not just PowerPoint flowcharts; any type of flowchart can be useful for your organization’s project management. Therefore, using graphic symbols or directions, as well as any needs of your project management abilities, you may harness the power of a packaged Excel template, which provides you with more efficient task results in a very quick and easy way.

4. FAQs on PowerPoint Flowchart
4.1. Is Word or PowerPoint Better for Flowcharts?
While both Word and PowerPoint may be used to make flowcharts, PowerPoint is typically thought to be better suited for making visual presentations, which include flowcharts. PowerPoint’s formatting and design capabilities are extensive, making it easier to make aesthetically beautiful flowcharts with shapes, colors, and connectors. Additionally, PowerPoint allows for easy animation and transition effects, which can enhance the visual appeal of a flowchart and make it more engaging for an audience.
However, neither Word nor PowerPoint’s flow charts are as good as Excel’s. Excel’s flowchart tools may be more appropriate or best suited for creating technical diagrams such as process charts, flowcharts, or detailed process maps.
4.2. What is Flow Chart in PPT?
A flowchart in PPT (PowerPoint) is a graphical representation of a process or system that depicts the flow of stages or activities by using various shapes and symbols connected by arrows or lines. It helps in the visualization of the pattern of events, decision points, and dependencies in a process, making complicated information easier to understand and share.
4.3. How Do You Make a Flowchart for Beginners?
First of all, to make a flowchart for beginners using PowerPoint, you can follow these steps. First, start by defining the purpose and scope of your flowchart. Then, open PowerPoint and create a new presentation or open an existing one. Then, click on the “Insert” button in the PowerPoint ribbon and select the “Shapes” option. Choose a shape, such as a rectangle, for your first step. Click and drag on the slide to create the shape and double-click inside it to add text. So, repeat this process to add more shapes and text boxes for each step.
Thus, to connect the shapes using connector lines from the “Shapes” menu, and continue adding shapes and connectors until your flowchart is complete. Format the shapes, lines, and text using the formatting options in the PowerPoint ribbon. Review and refine your flowchart for clarity and accuracy, and finally, save your PowerPoint presentation.
As a reminder, to keep the flowchart simple, use clear labels, consistent shapes, and a logical flow to ensure it is accessible for beginners or anyone who views it.
Recommended Readings:
How to Create Org Chart in PowerPoint? – With Video & Examples
How to Create a Flowchart in Excel?
Flowchart Tutorial: Common Questions, Types, Tools and Tips!
Related Posts


