How to Make Geographic Heat Map in Excel? With Simple Instructions
Firstly, when it comes to data visualization through map charts, most people are curious about how to make geographic heat maps in Excel. And, this complete guide will help you with how to make geographic heat map in Excel!
Table of Content
1. What is a Geographical Heatmap?
2. What are Geographical Heat Maps Used For?
3. How to make a Geographical Heatmap in Excel?
4. Geographical Heat Map Generators
5. Benefits of Using Ready-to-use Heat Map Generators
6. Geographic Heat Map Collection
1. What is a geographical heatmap?
Firstly, geographical heatmaps are world or country-based data visualization tools. After all, people are curious about how to make a choropleth. So, they are useful for huge data sets based on a country, continent, or the whole world. So, you can easily present your data with map charts.
2. What are geographical heat maps used for?
Firstly, geographic heat maps are commonly used for data visualization through certain maps. So it can be detailed as small as a neighborhood or as big as a whole country. In any case, it can be varied depending on the data set you have. You can have any kind of data such as demographical, physiographical, or socioeconomic data.
3. How to make a geographical heatmap in Excel?
Undeniably, if you are keen to make a map in Excel by yourself, there are several steps that you should do.
- Step 1 – Prepare data
Firstly, you should prepare data for your work. Obviously, the data can be about nearly anything. Obviously the only thing about data, it should base on some geographical difference.
- Step 2 – Examine data
Secondly, examine your data for the heat map. Then each different state or country should be in a different cell.
- Step 3 – Insert map chart
Thirdly, select all the data and go to the insert tab then find a map chart on the inserting list.
So forth, insert a map chart that you want.
- Step 4 – Customize your map
Moreover, customize your map as you like. Either, you can change the color or dataset.
At this point, Excel should recognize the location data correctly. Therefore, you should rearrange the data in a way that Excel can recognize.
- Step 5 – Save and print your map
Lastly, if everything looks good just save your heatmap. You can take a print with CTRL-P shortcut.

4. Geographical Heat Map Generators
In fact, steps sound easy but when it comes to making them, it is harder than sounds. Undeniably, we have solutions for you. On the whole, Someka offers several different ready-to-use templates that you can easily design your geographic heat map. Also, there are several configuration tools that you can customize your heat map as you like!
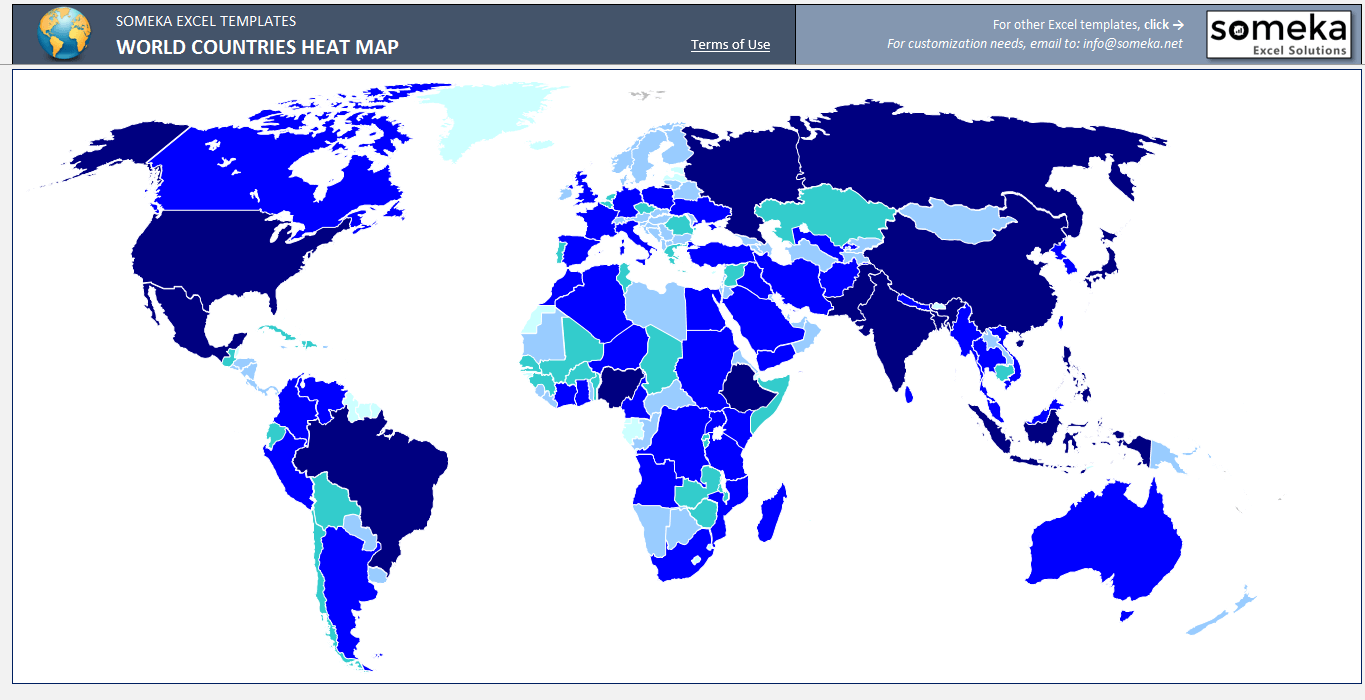
– This diagram is created on World Heat Map Generator by Someka –
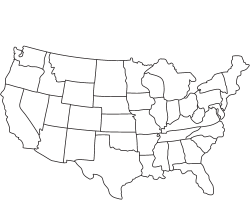
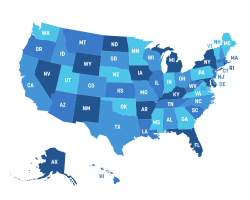
For example, you can see an example USA heatmap below.Then, you can change that map to:
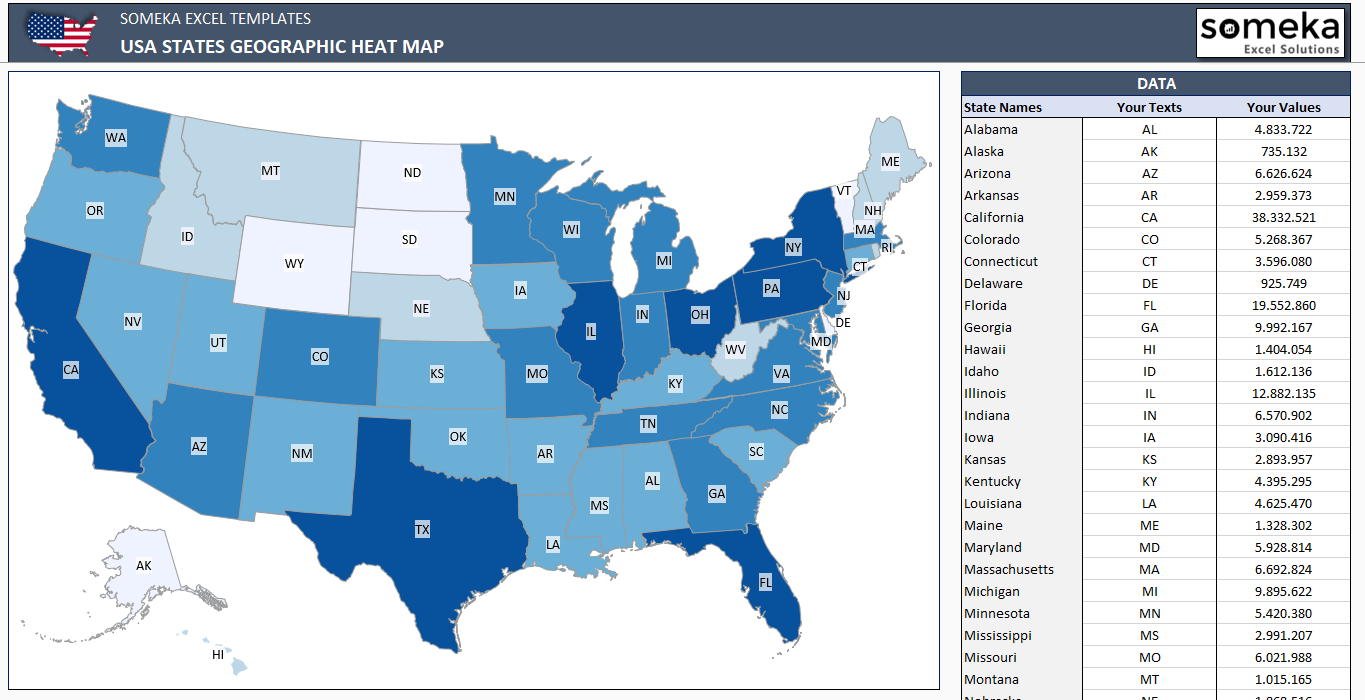
– This colored map is created on USA Heat Map Generator Excel Template by Someka –
Also, here is the more configuration style for you to work on!
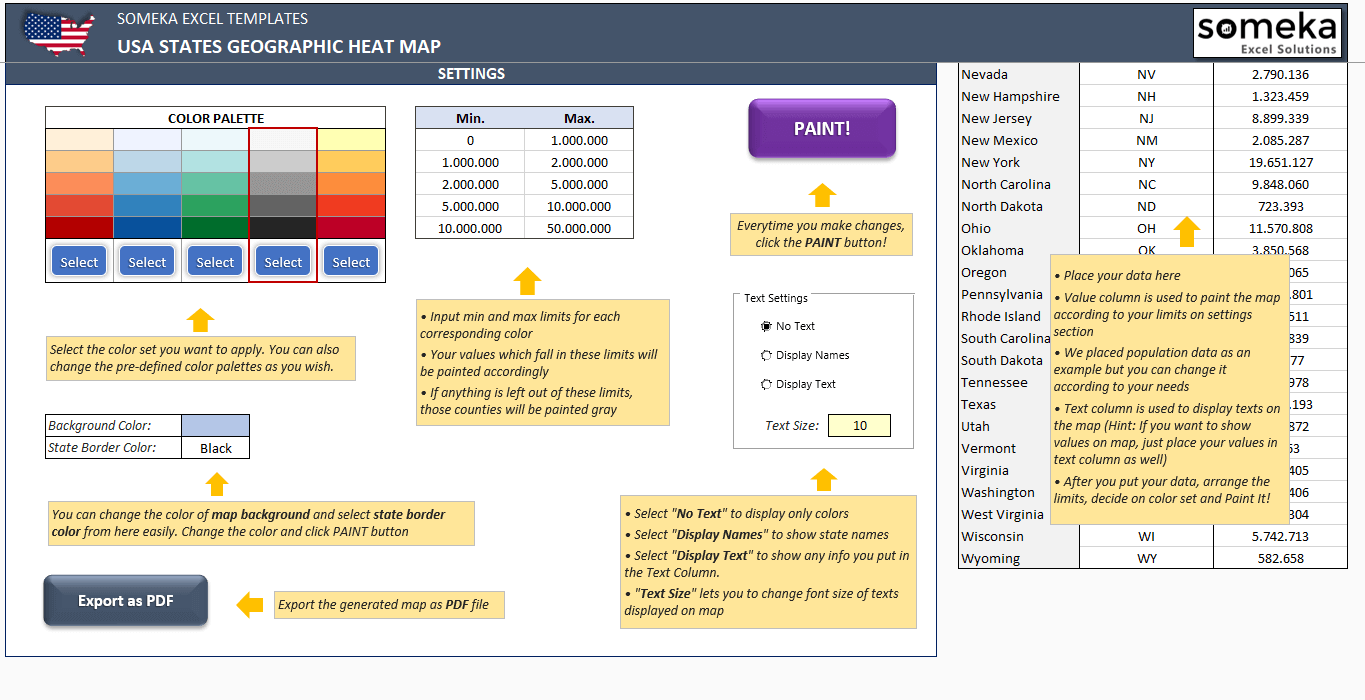
– This is the setting section of USA Heat Map Generator by Someka –
In another case, you can see how USA Heat Map Generator works smoothly:
5. Benefits of Using Ready-to-use Generators
Obviously, there are several benefits to using ready-to-use templates.
Firstly, you won’t need to think about how to make a map in Excel. Secondly, map generators are already designed perfectly and you do not need to design them in Excel to make them look good.
Moreover, the datasets that you want to use, could be confusing. Maybe Excel won’t read and create a map for you so you can easily input your data to a ready-to-use template and use the map in a minute wherever you want.
Furthermore, the templates can be reusable anytime so when you add a heat map to your collection you won’t need to think about how to make a geographic heat map again! Afterward, you can use it anytime. Also, you can change the data and show different analyses within your heat map geography.
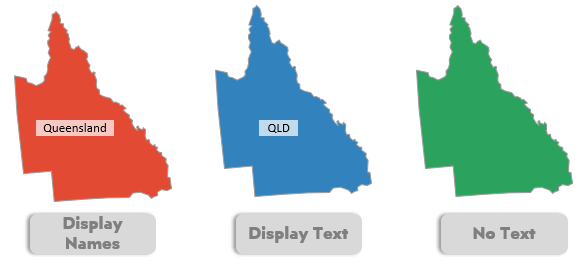
Following this, you can choose whether to show country/state names or texts or nothing! Obviously, you can simplify your choropleth map.
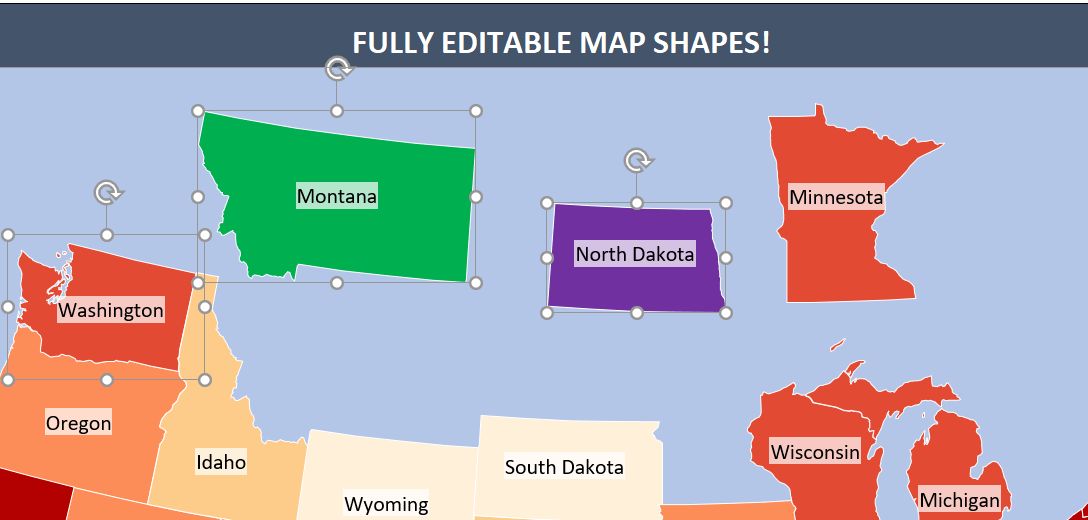
Finally, you can edit certain parts of the map. Such as, you want to edit the size of California. Finally, when you input your data, you can just click on the state and edit the size. Afterward, you can underline some specific information.
6. Someka Geographic Heat Map Collection
Recommended Readings:
Related Posts


