How to Make a 9 Box Grid in Google Sheets? Tips and Templates
There’re many ways to create 9 Box Grids. But if you need an online solution, then a Google Sheets file will be suitable for you. In this article we’ll try to explain you how to make 9 box grid in Google Sheets with step-by-step instructions.
2. How to Make a 9 Box Grid in Google Sheets?
- #Step 1: Open Google Sheets file
- #Step 2: Prepare Your Data
- #Step 3: Rate your employees
- #Step 4: Prepare Your Score Table
- #Step 5: Calculate 9 Box Scores
- #Step 6: Define the categories for each employee
- #Step 7: Create 9 Box Table in Google Sheets
- #Step 8: Create a Scatter Plot
- #Step 9: Customize the chart
3. Why to use Google Sheets to make 9 box?
5. Ready-to-use 9 Box Google Sheets Template
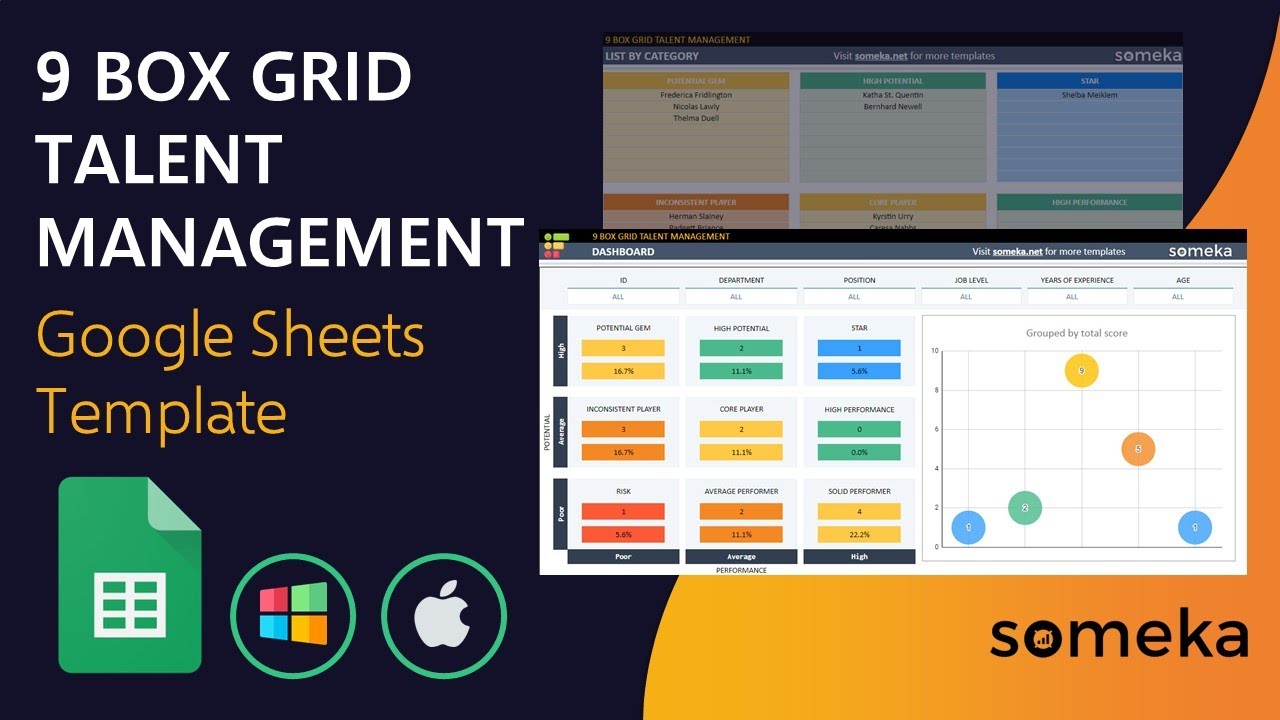
Below our ready to use Google Sheets 9 Box Template. We’ll now go through steps to reach this final result:
Let’s start!
1. What’s 9 Box Grid?
A lot of people use the 9-Box Grid model to organize their human resources and succession planning. This is a simple but useful way to evaluate and map out a company’s talent pool based on two main factors:
- Performance line (Horizontal): This line usually shows how well an employee is doing right now. As a person moves up or down the scale, their score is often based on their most recent performance reviews.
- Potential line (Vertical): This line measures how well an employee will do in the future. It checks how ready the person is to move up in the company and take on bigger, more difficult jobs. People’s potential is often judged by things like their leadership skills, competencies, and ability to do well in bigger jobs.
The 9 Box Grid can be seen as a grid with nine boxes that are made up of three rows and three columns. Each line of the grid shows an important way to evaluate employees.
2. How to Make a 9 Box Grid in Google Sheets?
Here’s a step-by-step guide to create 9 box quadrants in Google Sheets.

#Step 1: Open Google Sheets file
As the other Google products, you should have a Google account to use Google Sheets files. So if you do not already have one, you should create a Google account to get access to Sheets.
Then you can open a Google Sheets file from any web browser.
 10. What Are 9 Box Alternatives?
#Step 2: Prepare Your Data
Before you can create a 9 Box Grid in Google Sheets, you need to gather the necessary data.
This typically includes two key metrics: employee performance and employee potential.
If you like, you can also add additional info columns: Department, Position or Age of the employee to track your full team.
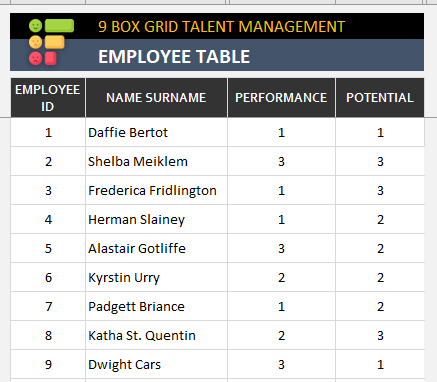
#Step 3: Rate your employees
Now it’s time to rate each of your employees according to their performance and potential levels. As this will be a nine-box format, we recommend you to use a 1-3 scale to use it more easily.
Here’s an example of how your data might look:
#Step 4: Prepare Your Score Table
You have to prepare a score table to decide which levels will go to which categories.
Below is an example of a 9 Box Grid Google Sheets score table:
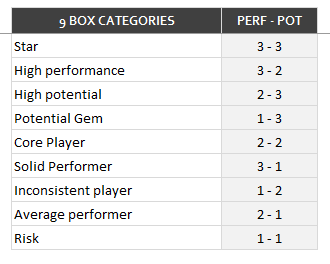
How to read this table? Employees with 3-points performance and 3-points potential will have 3-3 score and will be labeled as Star, and employees with 1-point performance and 1-point potential will have 1-1 score and will be labeled as “Risks”.
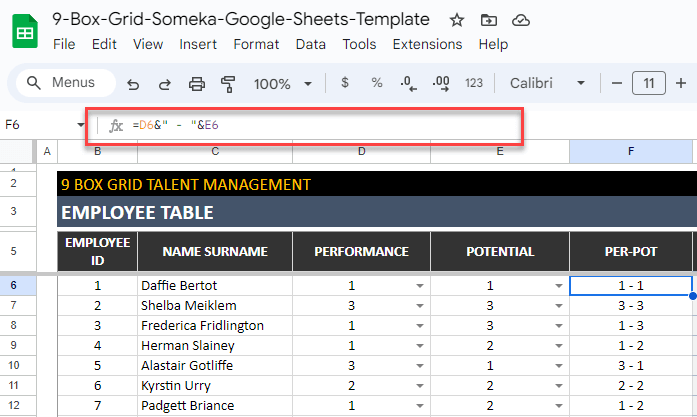
#Step 5: Calculate 9 Box Scores
You will calculate the overall scores of your employees. Here we recommend you to combine Performance and Potential levels of your employees with a simple formula:
#Step 6: Define the categories for each employee
Now with Google Sheets INDEX-MATCH formula, you’ll find the categories for each employee.

Now your database is ready!
You can both create 9 Box Grid tables and Scatter Plots in Google Sheets to make a talent analysis.
#Step 7: Create 9 Box Table in Google Sheets
You can prepare a 3×3 matrix with lines to write your employee names. The number of lines will differ according to your company size.
– This nine-box format is from 9 Box Grid Google Sheets Template by Someka-
You can use different color palettes or fonts here to design your table according to your needs.
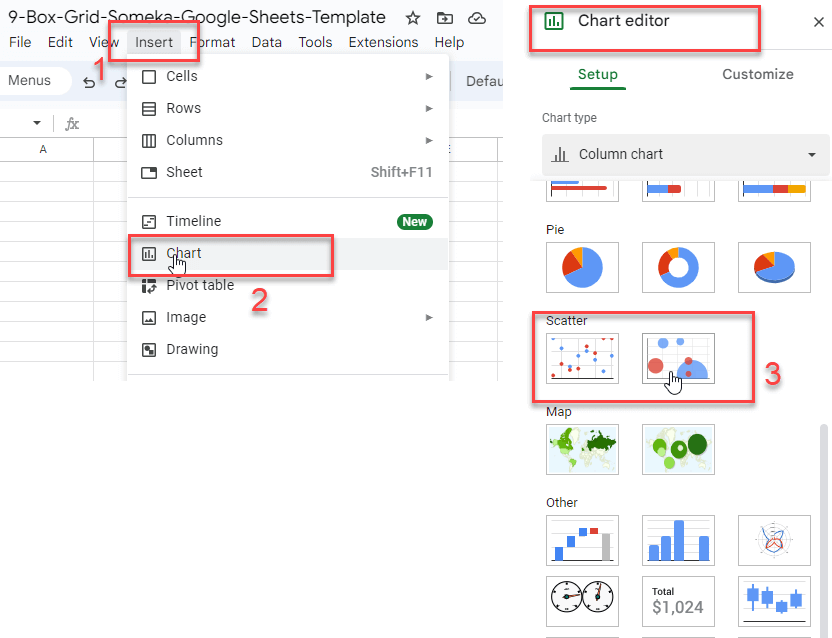
#Step 8: Create a Scatter Plot
One of the most common visual presentation of 9 box is scatter plots. These are bubble charts showing the number of elements in a specific group.
So first you should calculate the number of employees in the each group with COUNTIF formula.
After selecting your data, go to Insert > Chart and then under the Chart Editor select scatter plot type.
#Step 9: Customize the chart
On google sheets you can customize your charts under the chart editor.
First select your chart and from the 3-dost on the right top, click on Edit the chart.
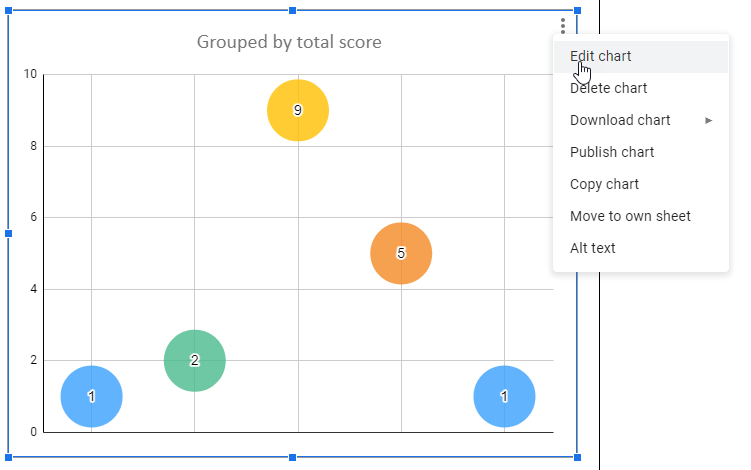
Now under the Chart Editor panel, you’ll see Customize tab.
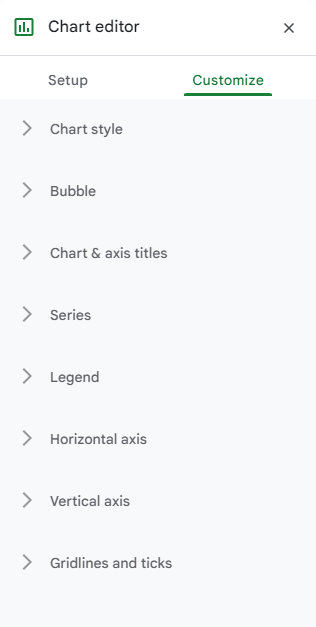
Under that tab you can edit:
- Chart style: You can change the background or font types.
- Customize the bubbles: You can play with the design of your bubbles here
- Modify chart and axis titles
- Customize Vertical and Horizontal axis: You can both change fonts and texts as well as scale factors
- Gridlines and ticks: You can add or remove gridlines according to your preferences.
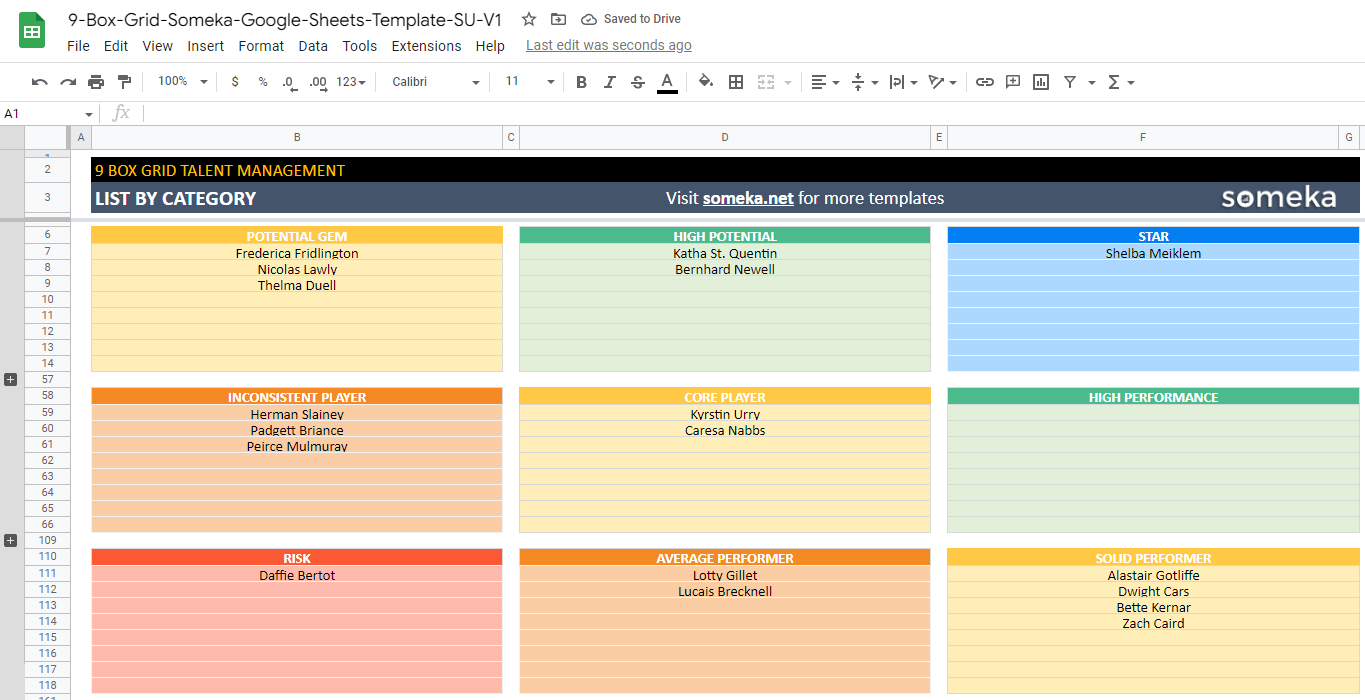
3. Why to use Google Sheets to make 9 Box?
As Google Sheets work on browsers, it has some advantages over other spreadsheet software.

– This is the Dashboard of 9 Box Grid Google Sheets Template by Someka –
Firstly, it’s accessible from all devices. This enables to use your template on tablet, mobile or desktop.
Secondly, you can easily use this file collaboratively with your colleagues. You change the sharing settings and use this file simultaneously with your teammates.
Also, Google Sheets files work on any operating systems. Thus, you’ll not have any problem on Windows or Mac, or any other system.
Additionally, you may also use Microsoft Word or Docs to create 9 box grids. But, like other spreadsheets, Google Sheets let you create charts and tables in seconds as well as cell-based calculations.
Finally, you can easily extract your Google Sheets file to PDF. Go to File > Download > PDF to create a pdf from your file.
4. Tips and Best Practices: How to Make 9 Box Grid in Google Sheets?
Here are some tips from our Google Sheets geeks:
- Do not display gridlines
- Color palettes are life-savers for a nice-looking report
- Use 1-3 scale for your ratings
- Update your grid regularly
- Hide the unneeded tabs
5. Ready-to-use 9 Box Grid Google Sheets Template
We’ve tried to explain how to create 9 Box grids in Google Sheets. You can try yourself with this step-by-step guide.
But if you want to get a ready solution to focus on your HR business, then introduce our 9 Box Grid Google Sheets Template:
In order to create hassle-free reports, download our 9 Box Talent Management Template in Google Sheets. You do not need to install any thing. Just make-a copy and start using this unique tool. If you’re an Excel user, you can also try our 9 Box Grid Excel Template.
Hope you find this article useful!
Recommended Readings:
Related Posts