20 Most Important HR KPIs & Metrics to Track
Do you want to assess your HR department or HR-related business but don’t know where to start? As Someka, we already created HR Dashboard templates with HR KPI dashboard but in this post, you will be able to learn all the HR KPIs and key metrics and how to implement them in a detailed manner.
What is KPI in HR?
HR KPIs mean key performance indicators for human resources departments or agencies, in general. An HR KPI is a key metric for you to track in order to assess and ensure the quality of employee-related departments.
Why should you track HR KPIs?
HR is one of the core features of any business because of the fact that every business needs employees. Human resources metrics help you to improve your HR department’s success and see the risks and failures.
What are the most important KPIs in HR?
HR is a broad subject and that’s why there are many HR KPIs you can implement in your KPI dashboard. We gathered the 20 most important HR KPIs for you in this article.
Human Resources Metrics
1. Avg. Recruiting Time
HR Metrics / Investment / Cost / Employee Management / Market Share
Description:Average Lead Time to Recruit New Employees. This metrics is important for the company to be able to estimate when they have to start recruiting process to have the new employee when he actually will be needed not few weeks or months later or earlier.
Should be High or Low?:It is good if the hiring time is shorter but it’s not the most important. It is however important to be sure about the time it take and not to have a big variance in the average counted.
2. Avg. New Hires Performance
HR Metrics / Revenue / Financial Performance / Profitability / Sales / Work Efficiency
Description:Performance Score of New Employees within 6M, usually there are some goals set up for new employees to be achieved. After a certain amount of time the results are compared to the set-up goals.
Should be High or Low?:Based on the results you can estimate % of salaries increase for each employee. But also, you can see the influence of the trainings and how much the productivity can grow after an employee is fully trained and has the main know how.
3. Avg. Length of Placement
HR Metrics / Employee Satisfaction / Investment / Cost / Employee Management
Description:Average time to hire a person of a specific position. This metrics is very similar to recruiting time however it is more detailed because you should split the metrics depending on the position you are searching an employee for.
Should be High or Low?:It is important to have knowledge how long it can take to hire a person for a specific position because different positions can have a big difference in time.
4. Diversity (Female to Male Ratio)
HR Metrics / Employee Management / Brand Value
Description:It allows you to track the ratio of new hired people.
Calculation Method / Formula:number of female employees / total number of employees
Should be High or Low?:It is informative metrics.
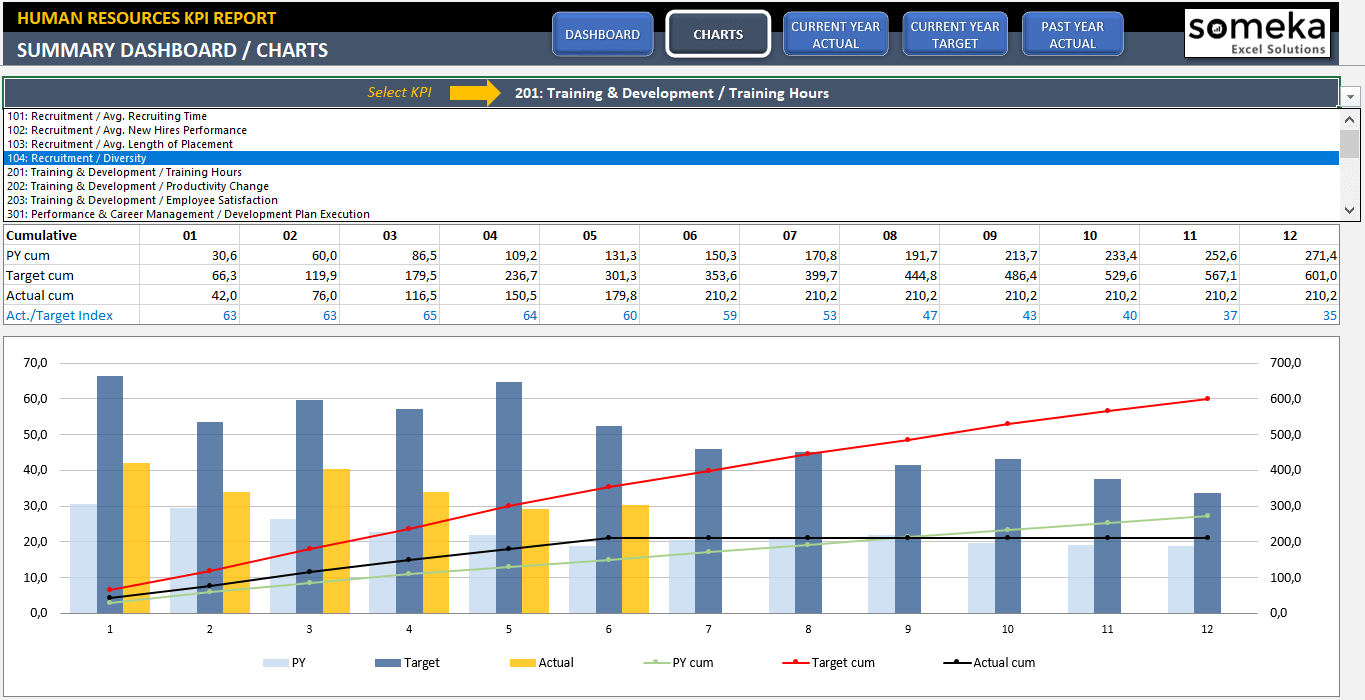
5. Average Training Hours per Employee
HR Metrics / Employee Satisfaction / Employee Management / Budget Management / Quality / Work Efficiency
Description:This metrics shows you the average training hour of an employee. Training may increase the quality and decrease in the future cost of fixing mistakes.
Calculation Method / Formula:You can calculate it as: (Total number of training hours) / Total number of employees
Should be High or Low?:Target should be estimated based on experience and comparison between higher and lower qualified workers.
6. Productivity Change
HR Metrics / Employee Satisfaction / Work Efficiency / Employee Management
Description:This metrics can be very helpful when it comes to estimating budget for the employee trainings and also to follow the training satisfaction score. So, you know how much you can improve the skills and efficiency of your employees.
Calculation Method / Formula:% Change of Productivity Before/After the Training
Should be High or Low?:You can compare if the results are changing after some changes in the training content or compare it to the satisfaction score if the results are aligned.
7. Employee satisfaction points with training
HR Metrics / Employee Satisfaction / Employee Management / Budget Management / Quality / Work Efficiency
Description:Employee satisfaction score given in a questionnaire as a result of taken trainings.
Should be High or Low?:The results can show you if the training is helpful, understandable. It can also give an important input on changes in the training. So even if the results are below expectations it can be still a good input for the improvement.
8. Development Plan Execution
HR Metrics / Employee Satisfaction / Work Efficiency / Employee Management
Description:Metrics that counts ratio of employees who fully follows their development plan out of total number of employees.
Calculation Method / Formula:% of employees that fully execute their Individual Development Plan
Should be High or Low?:If the ratio is going down, it may mean that the development plans are not well prepared.
9. Coaching Plan Participation
HR Metrics / Employee Satisfaction / Work Efficiency / Employee Management
Description:Number of employees following coaching career development plan out of all employees.
Calculation Method / Formula:% of employees that participate Career coaching plan
Should be High or Low?:It is informative metrics.
10. Avg. Time at Same Function
HR Metrics / Employee Satisfaction / Work Efficiency / Employee Management
Description:Average time employee is on the same position/function.
Calculation Method / Formula:Average time employees are in the same function
Should be High or Low?:Higher time may be reason for some employees to quit job. However short time can mean a big employee turnover.
11. Leave Ratio
HR Metrics / Employee Satisfaction / Cost / Work Efficiency / Budget Management
Description: % of employees who decided to leave the company in a certain period of time. Usually calculated monthly or yearly. It is one of the factors important while planning hiring budget.
Calculation Method / Formula:% of employees who leave the company in a given time period
Should be High or Low?:It is important to keep this statistic low, because with every leaving employee company is also losing some part of knowhow and experience.
12. Profit Per Employee
HR Metrics / Revenue / Financial Performance / Work Efficiency / Profitability
Description:This metrics can show you how efficient are your employees. You can estimate possible losses or additional income if you think about firing or hiring new employees. This is not one to one implication but can give you a good point of view while seeing changes between that metrics and a number of employees.
Calculation Method / Formula:Revenue – Total Expenses / FTE
Should be High or Low?:Mainly an informative value but you need to be careful how it changes. Maybe you have hired to many people for current situation or not enough, or maybe you are hiring new people for your new branch. Depend on that this number will be changing.
13. Headcount Per HR Staff
HR Metrics / Employee Management / Budget Management
Description:Average headcount of employees in HR team. You can measure just the number of as a ratio to all the employees of the company.
Should be High or Low?:It is an informative metrics.
14. Avg. Vacation Days
HR Metrics / Employee Satisfaction / Cost / Work Efficiency / Budget Management
Description:Average number of vacation days per employee
Should be High or Low?:It is an informative metrics.
15. Overtime Hours Ratio
HR Metrics / Work Efficiency / Employee Satisfaction / Cost / Work Time Management
Description:Total overtime hours as a percentage of all work hours
Should be High or Low?:If the overtime is always high you can calculate the possibility to hire extra employees instead of paying overtime.
16. Average Salary
HR Metrics / Employee Satisfaction / Cost / Work Efficiency / Budget Management
Description:Average salary is important metrics while creating new budget for the next year.
Should be High or Low?:Number depends on many factors, but it is good to be aware of the average salaries in other companies of the related sector.
17. Average Retirement Age
HR Metrics / Employee Satisfaction / Cost / Work Efficiency / Budget Management
Description:This metrics has a different importance form company to company depends on a percentage of employees in certain age.
Should be High or Low?:Informative metrics.
18. Hire Budget Realization
HR Metrics / Budget Management / Employee Management / Planning Effectiveness
Description:It is a measure of effectiveness of hiring process as well as the correct hire estimation. Sometimes budget set in the beginning of the year can be not enough after some months due to new circumstances.
Calculation Method / Formula:# actual hired people / Planned and Budgeted number of new hires
Should be High or Low?:It is important to have all the possible inputs, planned projects, opening new branch etc. while planning a budget for hiring so the company won’t have to struggle later if there will be high number of new employees to hire. The budget should be prepared for that.
19. Training Budget Ratio
HR Metrics / Employee Satisfaction / Employee Management / Budget Management / Quality / Work Efficiency
Description:Percentage of HR budget spent on training
Calculation Method / Formula:budget planned for trainings / total HR budget
Should be High or Low?:You should estimate your budget based according to the number of employees and the results that are achievable due to those training.
20. Avg. Training Cost Per Person
HR Metrics / Employee Satisfaction / Employee Management / Budget Management / Quality / Work Efficiency
Description:Average training costs per employee, you can compare this metrics with productivity change later and see how valuable and profitable the trainings are. In the training you should include all the trainings together with hard and soft skills trainings as well as the orientation training.
Should be High or Low?:It may seem the lower cost would be better but in fact it is important to have an optimum budget for good quality trainings for your employees because it will result in much higher efficiency of their further work.
Below is the summary of HR KPI metrics:

Most Important KPIs for Different Industries
HR KPIs are specific to human resources departments or HR related businesses. For other departments and industries, you can check our related articles.
Related Posts


