
16 Most Commonly Used IT KPIs & Metrics
If you have a business specified in IT or an IT department in your company, you should definitely track your IT KPIs! But what are the key metrics that matter to assess the success of IT department? While you can easily see the IT KPIs in our IT Dashboard templates, we also prepared a detailed post that you can read more about IT key metrics and their definitions.
What is kpi for IT?
In general, KPI stands for Key Performance Indicator. An IT kpi is a well-defined and measurable metric to track in order to improve the quality of technology related services of a business. For it departments, there are many metrics you should analyse and optimize to improve the processes.
Why should you track it kpis?
IT is a very demanding department and related digital processes should be improved on a daily basis. That’s why you should be tracking and improving the most important it kpis regularly.
What are most important kpis for it?
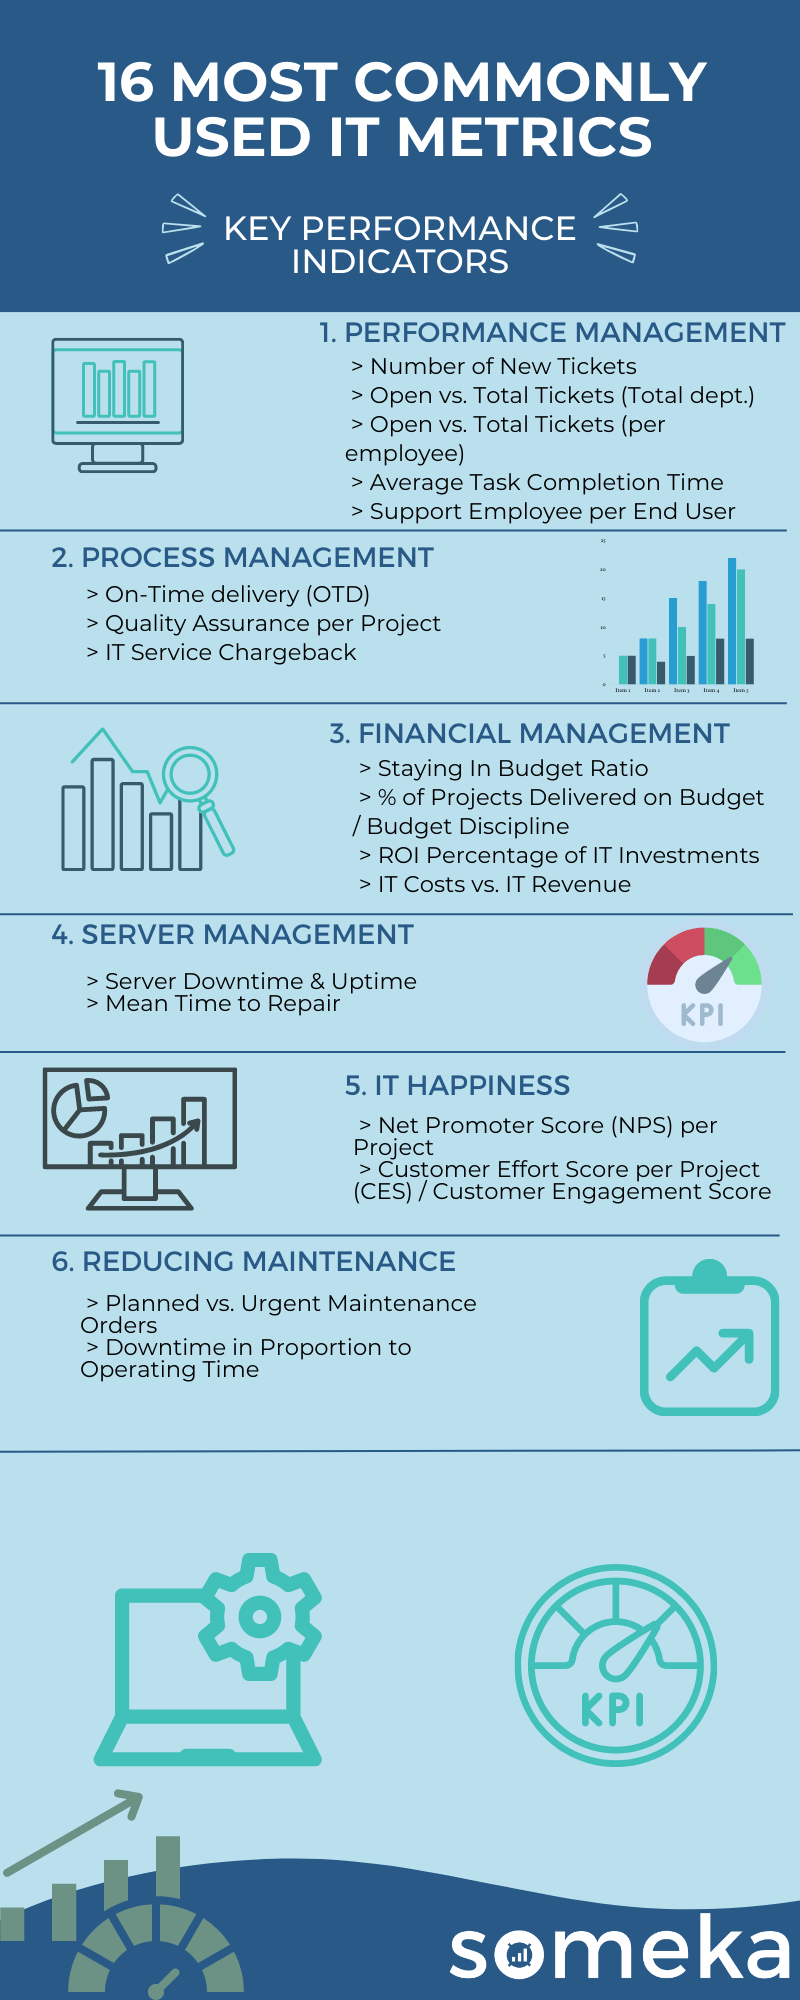
There are lots of metrics and key performance indicators for IT people to follow. So, choosing the right ones to focus on is critical. During our consulting studies in years, we’ve dealt with hundreds of different it kpis. Then we’ve worked on the data, eleminated and consolidated the metrics and listed down the 16 most used it kpis to track.
IT Metrics
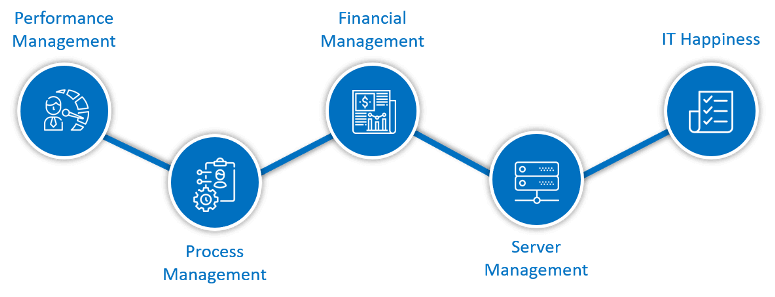
1. Number of New Tickets
IT Metrics / Work Efficiency / Work Organization / Customer Relationship
Description:Number of issues appearing during a period of time. All the problems or requests can be measured as a ticket. Tracking this number may allow to increase customer support awareness and allow to create a time standard.
2. Open vs. Total Tickets (Total dept.)
IT Metrics / Work Efficiency / Work Organization / Customer Relationship
Description: Out of total number of tickets how many was not resolved vs number of resolved over time. If your metrics is a ratio of resolved to all open tickets then the ratio should be as high as possible and the opposite if you calculate the unresolved out of all open tickets the number should be as low as possible. On the metrics influence may have a time period you are calculating. Some unexpected problems with your product or services, number of employees.
Calculation Method / Formula:Can be calculated as: number of closed tickets / number of all tickets (in some period of time)
Should be High or Low?:If the metrics runs away from the ideal target you may investigate if you have enough employees, how the work time organization looks like etc.
3. Open vs. Total Tickets (per employee)
IT Metrics / Work Efficiency / Work Organization / Customer Relationship
Description:This can help you to see the average performance per employee and compare through the time if that metrics changes depending on the experience of your team or if you need changes in the number of employees
Calculation Method / Formula:100%*Total open tickets /(Total tickets * number of employees)
Should be High or Low?:This number is more informative metrics, if an average number drops that might be caused by new unexperienced employees or your employees have lack of motivation
4. Average Task Completion Time
IT Metrics / Customer Satisfaction / Brand Value / Work Efficiency / Work Time Management
Description:This metrics can help you to predict expected average employee performance. This number can allow you to calculate how many tasks should have been closed within given period of time by one employee
Should be High or Low?:The lower the better but the minimum time needed depends on your product type and service. The important part here is not just the time but also quality. Pushing target to the minimum may cost you later problems due to bad quality or mistakes as a result of rush.
5. Support Employee per End User
IT Metrics / Work Efficiency / Work Organization / Customer Relationship
Description:Shows how many tickets is coming from the end users and how important is having well prepared support team to keep client satisfaction and NPS score high.
Should be High or Low?:if the number is growing you should check if you have enough employees working in support team.
6. % of Projects Delivered on Time / On-Time delivery (OTD)
IT Metrics / Customer Satisfaction / Cost / Transport / Delivery Management / Inventory Management
Description:How many projects out of total were delivered on time. It can give a projection on the further estimations. Projects overestimated are calculated as on time, which can give a little false output value. If calculated just for one project it will just give the idea of percentage how fast project was completed in compare to the estimation.
Calculation Method / Formula:number of projects completed / number of sheduled projects to be completed
Should be High or Low?:If the number is much below 100, it is also good to calculate % of projects with overestimated time. That can give some lead for mistakes in estimation process itself.
7. Quality Assurance per Project
IT Metrics / Quality / Brand Value / Cost / Investment
Description:You should track number of issues, bugs or problems per project to be able estimate and improve your level of quality. You should set a target to minimize that number and create a quality assurance manual and directives.
Should be High or Low?:If you count it as number of issues then the number should be minimum and most of the possible problems you should be able to predict within time of experience or be able to fix before the project goes to the end user.
8. IT Service Chargeback or Showback
IT Metrics / Budget Management / Revenue
Description: Chargeback system means applying the costs of IT hardware, software, cloud services or shared services to the business unit in which they are used. Showback is similar to chargeback but the prices are for informational purposes only and no one is billed. Both chargeback and showback are policies of paying some of the bills not directly but by redirecting some of the payments form the clients so in case of some unexpected requests from users there might appear some financial problems.
9. Staying In Budget Ratio ( Budget Discipline)
IT Metrics / Budget Management / Planning Effectiveness / Cost / Savings
Description: Staying on a predefined budget is crucial to plan your investments and expenses. Main rule for this KPI is ensuring that you break down your budget into different expenditure items in detail.
10. % of Projects Delivered on Budget / Budget Discipline
IT Metrics / Budget Management / Planning Effectiveness / Cost / Savings
Description:How many projects out of total were delivered within set budget. It can give a projection on the further estimations. Projects overestimated are calculated as on budget, which can give a little false output value. If calculated just for one project it will just give the idea of percentage how accurate was the budget estimation in compare to reality.
Should be High or Low?:If the number is much below 100, it is also good to calculate % of projects with overestimated budget. That can give some lead for mistakes in estimation process itself.
11. ROI Percentage of IT Investments
IT Metrics / Revenue / Budget Management / Financial Performance / Investment
Description:The most common profitability metrics used for financial decisions. It helps to analyze how efficient/profitable was your investment. Profit vs Investment
Calculation Method / Formula:Net Profit / Cost of investment
Should be High or Low?:The problem with this metrics is that it doesn’t include time. So, it might be misleading. Depending on your investment you may have results immediately or you need to wait longer time for accurate benefit.
12. IT Costs vs. IT Revenue
IT Metrics / Budget Management / Financial Performance / Revenue / Profitability
Description:It is a measure of how profitable your company is. The metrics is a percentage of net income out of total income and the main factor here are the costs of that income. If you can reduce costs your profit margin will grow visible.
Calculation Method / Formula:Revenue -Total cost / Revenue
Should be High or Low?:It is impossible to eliminate costs and reach 100% but general analysis of your marketing strategies and company targets may give you a good direction how to increase your revenue. Sometimes decreasing costs may be a good option but sometimes increasing budget may give you much higher revenue than the investment.
13. Server Downtime & Uptime
IT Metrics / Work Efficiency / Cost / Equipment Efficiency / Work Time Management
Description:Downtime in general means nonproductive time when it is supposed to be a productive time. In case of server downtime, it is time when there is some maintenance time or some unexpected breaks out of total time since the servers were set to work.
Calculation Method / Formula:down time / total working time (productive + nonproductive)
Should be High or Low?:If the number is growing you should consider investment in some backup servers or maintenance, renew the equipment you have.
14. Mean Time to Repair
IT Metrics / Work Efficiency / Work Time Management
Description:It is the average time to solve a problem. It may vary depending on many factors, how serious the problem is, was it some continuous error on the production line, is the problem easy to fix etc. Count from the moment when the issue appeared till closing the ticket.
Should be High or Low?:If the number is growing it may suggest reorganizing work power or invest in some specific trainings for your employees. It is also a sign to look closer what have changed in compare to previous months.
15. Net Promoter Score (NPS) per Project
IT Metrics / Customer Satisfaction / Customer Relationship / Brand Value / Sales
Description:Once you have completed a project, you should ask them to rate it and get feedback. That metrics can be used to measure the loyalty or satisfaction of a customer (or a business partner). It shows the quality of relationship between customer and your company. The metrics numbers come from respondents/customers. NPS above zero usually is taken as good result. Respondents who rate your company are usually separated in tree groups: Promoters, Detractors and Passives. On average Promoters buys more, stay loyal customers, or even promote your company among other potential customers. The Net Promoter Score is calculated by subtracting the percentage of Detractors from the percentage of Promoters. Number of Passives increase the total number of respondents, and due to that it lowers down the final NPS.
Calculation Method / Formula:% of promoters – % of Detractors
Should be High or Low?:If the number is going down through a period of time, there might be some problem between your company and your business partner.
16. Customer Effort Score per Project (CES) / Customer Engagement Score
IT Metrics / Customer Satisfaction / Customer Relationship / Brand Value
Description:It measures how much effort your customer must input to get his issue resolved. Besides the effort itself for that measurement very big impact will have a customer experience. Usually customers can rate you much lower due to the bad communication experience even if their problem was not complicated.
Calculation Method / Formula:You can measure it on a scale from 1 to 5 representing the amount of your customer’s effort.
Should be High or Low?:Target is the minimum effort of your customer. If the results are far from the target you should investigate and try to improve your product or services to be more user-friendly and reliable.
Below is the summary of IT KPI metrics:
Most Important KPIs for Different Industries
All industries have different dynamics hence various kpis are being tracked and measured. Below you can see the list of different sectors and areas where we have listed most important kpis for each of them.
Related Posts


