LBO Model Guide: Definition, Steps, and Excel Worksheet
As one of the most effective financial instruments, LBOs (leveraged buyouts) entail the substantial use of borrowed funds to acquire a business. We will explain LBO Model in this article, with definitions, examples and steps to build a LBO modelling in Excel.
Table Of Content
1. What is LBO modelling?
2. Key Components of an LBO Model
3. Steps to LBO Modelling in Excel
4. Example for Leveraged Buyout Model
5. What is the difference between LBO and DCF Model?
6. Someka LBO Model Excel Template
7. Conclusion
1. What is LBO modelling?
A leveraged buyout (LBO) relates to the acquisition of a target company by a sponsor company using a significant amount of debt, which serves as leverage.
As the interest payments of the debt usually reduce the income tax (whereas dividend payments do not), the cost of debt is lower than the cost of equity, which in return brings down the overall cost of financing the acquisition. The free cash flow of the target company is used to pay the debt principal.
In summary, LBO entails developing a model to assess the purchase of a business with borrowed money. The company’s finances and the leverage (debt) utilized in the buyout are the main topics of the model. This model forecasts the company’s financial performance going forward. This covers investment returns, cash flows, and debt payback plans.
So, the private equity firms often utilize LBOs in their acquisition of businesses to increase the business’s profitability and resell it for a profit. As these leveraged buyout modellings support decision-making and evaluate a buyout’s viability. LBO models offer a thorough understanding of the potential for value generation within the acquired company. Both debt repayment and operational enhancements accomplish this.
2. Key Components of an LBO Model
A LBO model consists of various essential parts. The entry and exit hypotheses come first, which we call assumptions. Plus, there’re reporting elements that you should understand before building any LBO modelling.
 While evaluating an LBO, you should consider your transactional numbers, the operational health of the target company and lastly the financing conditions.
Then, what are the key components of LBO Model?
We can group the main components in four groups:
- Transaction Assumptions
- Operational Assumptions
- Debt Assumptions
- Reporting Summary
Let’s try to explain these concepts one-by-one:
a. Transaction Assumptions
These assumptions are related to your transaction conditions. It’s assumed that the transaction is on a cash-free, debt-free basis, which means the company is sold with no debt and no excess cash. This is a common assumption.
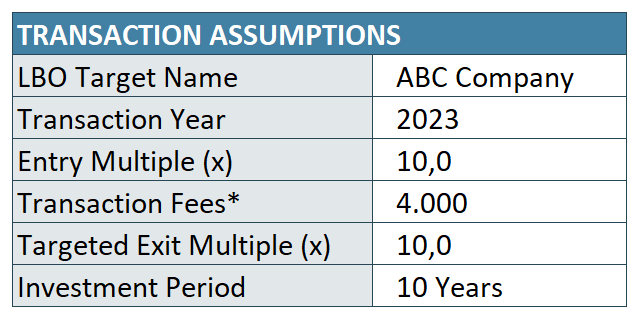
- LBO Target Name: Name of the company targeted.
- Transaction Year: This is the “Year 0” at the end of which the transaction occurs.
- Entry Multiple (EV/EBITDA): This ratio is used to find the enterprise value of the target company in relation to its EBITDA.
- Transaction Fees: Total amount paid as a one-time expense for the transaction to third parties such as investment banks, lawyers, consultants, accountants, regulatory bodies etc.
- Targeted Exit Multiple (EV/EBITDA): This is the targeted exit multiple of the sponsor equity. This may be equal to entry multiple.
- Investment Period: The time horizon between the transaction and exit.
b. Operational Assumptions in LBO Model
These are the assumptions about the target company’s operations.
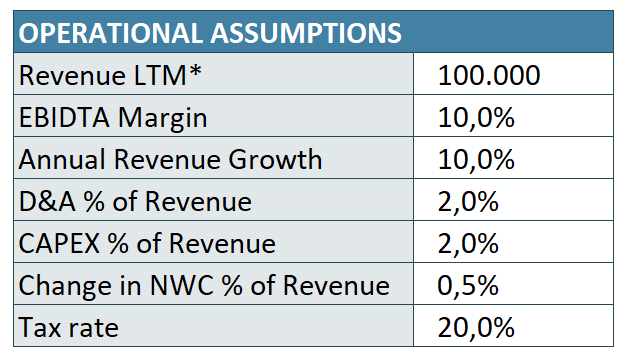
- Revenue LTM: The revenue generated by the target company in the last twelve months (LTM).
- EBIDTA Margin: This ratio indicates the EBIDTA proportion to the total revenue.
- Annual Revenue Growth (y-o-y): This is the expected annual growth for the revenues of the target company.
- D&A % of Revenue: This rate gives the projected rate of the target company’s Depreciation & Amortization (D&A) to the revenues.
- CAPEX % of Revenue: This rate gives the projected rate of Capital Expenditures (CAPEX) to the total revenues.
- Change in NWC % of Revenue: The rate of change in Net Working Capital (NWC) to the total revenues.
- Tax Rate: The applicable tax rate for the company.
These rates are according to the operational numbers of the target company. What’s the last 12-month revenue? What’s the EBIDTA? Also growth rates and net working capital changes are important to analyze the LBO viability.
c. Debt Assumptions in LBO Model
To simplify the method, there’s a one-type debt assumption, where you can input the average weighted interest rate.
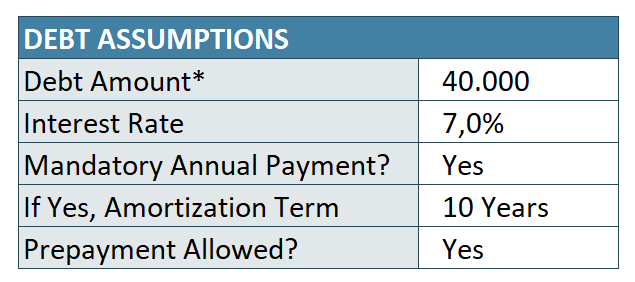
- Debt Amount: This is the total debt that you source from creditors.
- Interest Rate: This is the average weighted interest rate of your debts from different sources.
- Mandatory Annual Payment: This is whether your debt includes a mandatory payment clause, or not. If you do not have any mandatory payment, this means the debt will be paid by the free cash flow.
- Debt Amortization Term: This rate indicates the maximum debt amortization term.
- Prepayment Allowed: This option will be used to determine if you can make a prepayment of your debts if you have a free cash flow available.
These are the basic conditions for a simple financing. There might be much more conditions in a real life financing, especially if big amounts of money included.
d. Reporting Summary Concepts
So, after calculating your LBO, which values should you evaluate?
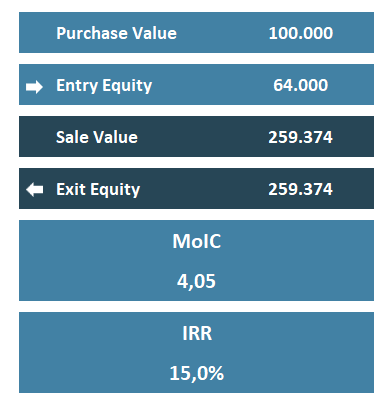
- Purchase Value: This is the enterprise value of the target company at the point of purchase. It’s calculated as the product of entry multiple and EBITDA.
- Entry Equity: This is the value that the sponsor company invests. So, it’s the remaining part of the total transaction costs minus debt.
- Sale Value: Also, this is the enterprise value of the target company at the point of sale. It’s calculated as the product of exit multiple and EBITDA.
- Exit Equity: Then, this is the total amount that the sponsor company will gain while exiting the investment. It’s calculated as the total transaction value minus the outstanding debt balance.
- MoIC (Multiple on Invested Capital): Thus, this valuation metric is calculated by dividing the exit equity value by the equity invested.
- IRR (Internal Rate of Return): As a method of calculating an investment’s rate of return, this rate basically calculates the discounting rate assuming net present value (NPV) equal to zero.
3. Steps to LBO Modelling in Excel
As we have explained main concepts and how to calculate them, now we can build our LBO modelling in Excel.
How to build an LBO Modelling in Excel?
Step 1: Prepare your Assumptions
Firstly, we will prepare our tables for our assumptions. This will include transactional, operational and debt assumptions.
Step 2: Calculate Free Cash Flow Projections
In order to evaluate the feasibility of your investment, you should first make a table of Free Cash Flows:
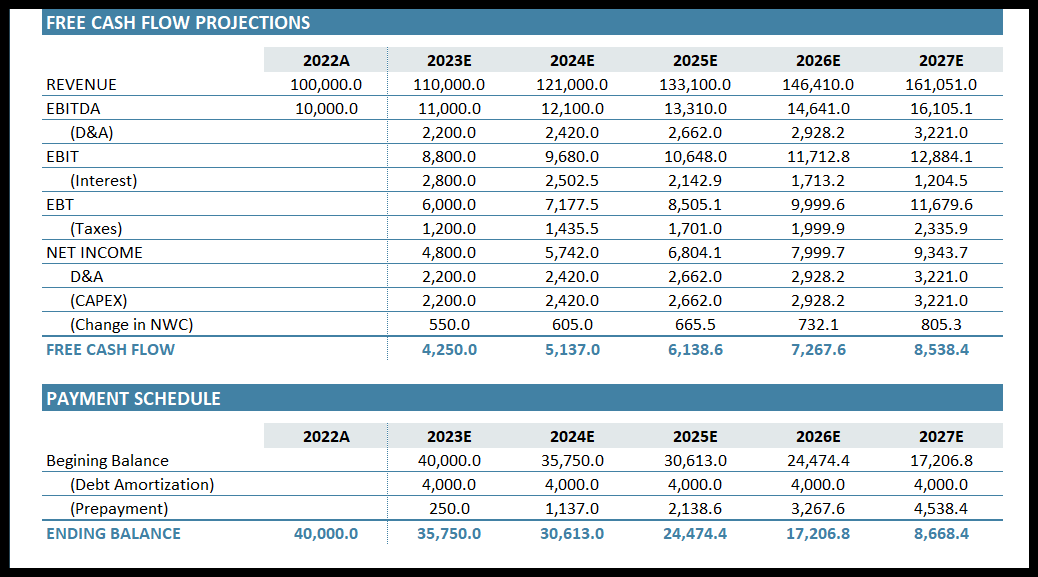
To prepare this table:
- Add The Term Row: First start from the actual investment year, and then add estimation years
- Free Cash Flow Calculation: Then add revenue, Ebitda, Net Income bars to calculate the Free Cash Flows expected on the target company.
- Ending Balance Calculation: Lastly, subtract the debt payments from your Free Cash Flows.
Step 3: LBO Model Calculations
You should now calculate your MoIC and IRR rates to assess if your proposed LBO is feasible.
Therefore, the Multiple on Invested Capital is calculated with the exit equity value of your exit year divided by the equity invested, which is the exit transaction value minus debt ending balance.
Then, IRR is also calculated with MoIC value:
Step 4: Visualize your Findings
So this is actually an optional step. In order to better understand your financial situation, you can add charts and bars to your analysis to see the cash flow trends and balance expectations.
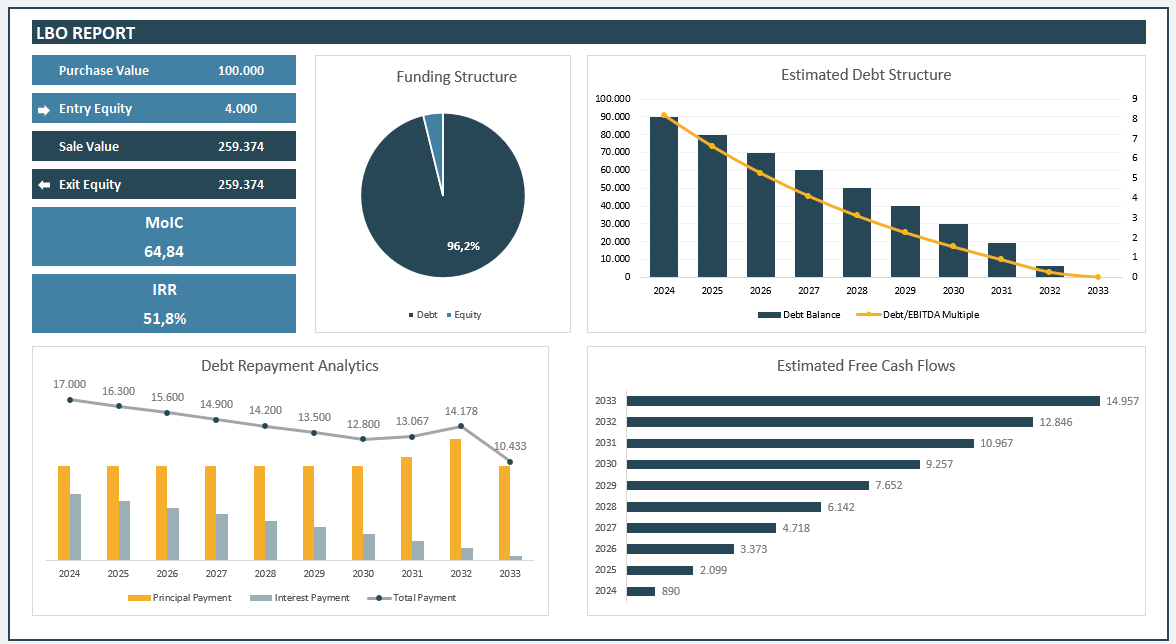
– This image is from the LBO reporting section of Someka LBO Calculator Excel Template –
In the image above, you can see the most common charts you can create for your model:
- Funding Structure Chart: This chart displays the equity/debt distribution of your investment.
- Estimated Debt Structure Chart: This chart shows the ending debt balances of each year with a Debt/EBIDTA multiple.
- Debt Repayment Analytics: This chat summarize your annual principal and interest payments with total debt repayment numbers.
- Estimated Free Cash Flows: This chart display the free cash flows of the target company throughout your investment period.
Additionally, these reporting visualization will help you with your presentations to the creditors, investors, board members and other related parties. Lastly, Microsoft Excel provides you with built-in finance functions that you can easily use for your valuation models.
Step 5: Comment and assess LBO results
This step involves expertise in finance, as you should decide on the feasibility of your investments in LBO Model. So, your decision may differ according to:
- Risks of the investment
- Health of your assumptions and expectations
- Industry benchmarks
- Financing conditions
- And much more criteria.
4. Example for Leveraged Buyout Model
Now we’ll go with a real life example.
We’ll assess the feasibility of an investment that we want to acquire ABC company in 2024 with the below assumptions.
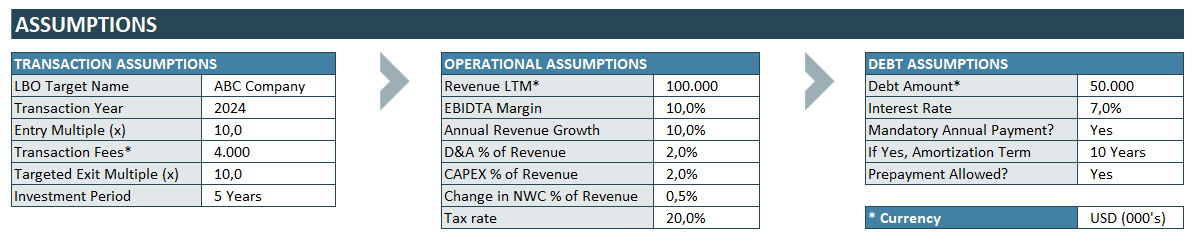
In summary:
- ABC company has a revenue of 100k and a EBIDTA Margin of %10. Which brings the EBIDTA to 10k.
- We have an Entry Multiple of 10. Then we’ll pay 10 x 10k, which equals to 100k.
- We are planning to exit this investment after 5 years with an exit multiple of 10.
- We’ll use a debt of 50k with an interest rate of 7%.
Now, let’s see our free cash flow table:
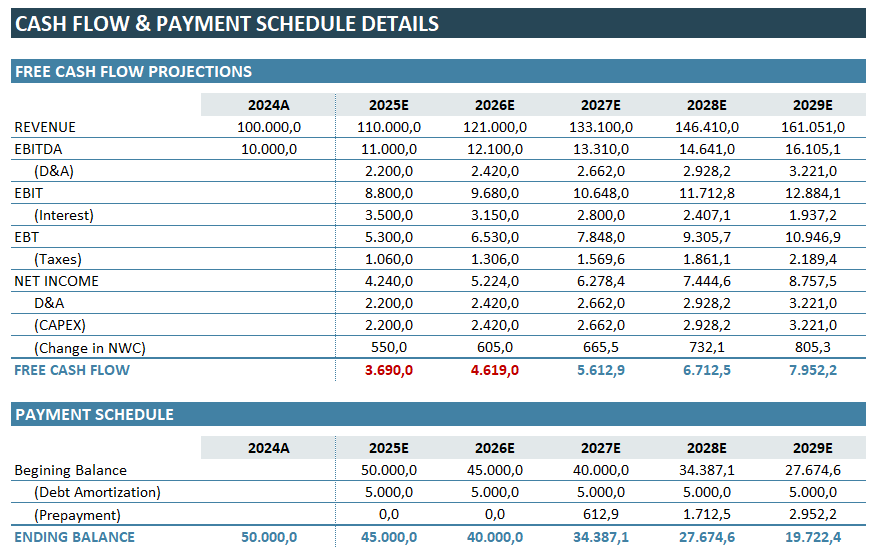
Here, we understand that the free cash flows will turn to positive in the third year of our investment. And, in the end of five years our ending balance will be 19,7k.
Lastly, we’ll check our LBO metrics to assess our investment:
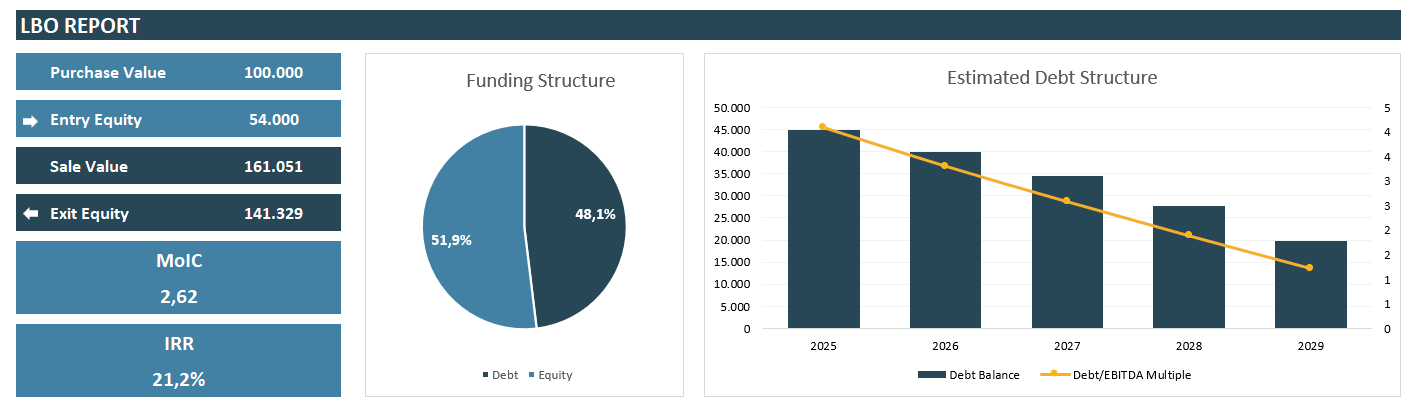
This results tell us:
- We’ll pay 100k for Purchase Value, and exit with a Sales Value of 161k.
- But, the actual equity entry will be 54k versus 141k exit equity.
- Our funding structure will be 51,9% equity, and the rest debt.
- Our Debt Balance will be nearly 20k in the end of five years.
This is a simple modelling of LBO, and does not include complex financial metrics.
5. What is the difference between LBO and DCF Model?
LBO and DCF (Discounted Cash Flow) models are both used in financial valuation. However, they differ significantly.
An LBO model focuses on buying a company using a high level of debt. So, it analyzes the company’s ability to repay debt and generate returns for equity holders. In contrast, a DCF model values a company based on its future cash flows. Therefore, DCF is discounted back to their present value.
The DCF model is more about intrinsic value. It doesn’t consider debt or financial structuring. LBO models are more common in private equity transactions. DCF Excel Templates are used in a broader range of financial analyses.
6. Someka LBO Model Excel Template
Financial analysts can find the Someka LBO Model Excel Template to be a helpful resource. It makes the process of building LBO models easier. But building a LBO model may need comprehensive calculations and structural know-how.
So we have created a LBO Modelling Excel Template to ease this process.
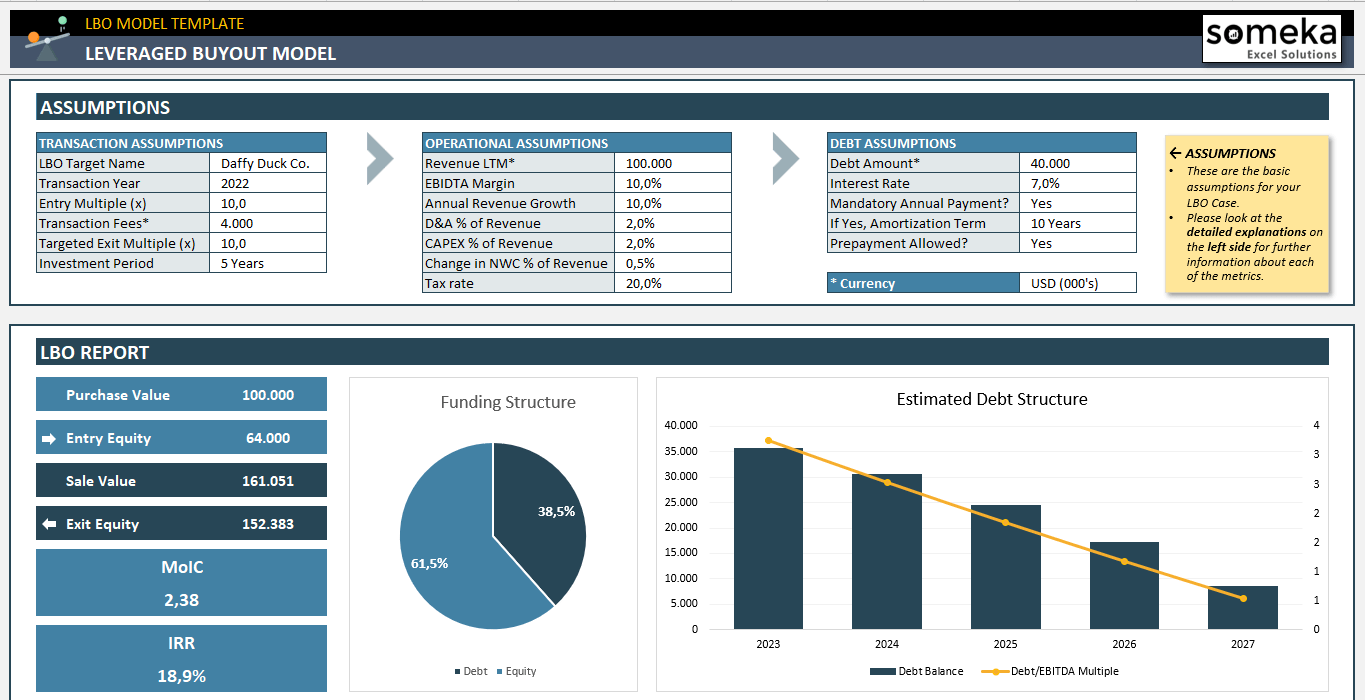
– This is screenshot from LBO Model Excel Template by Someka –
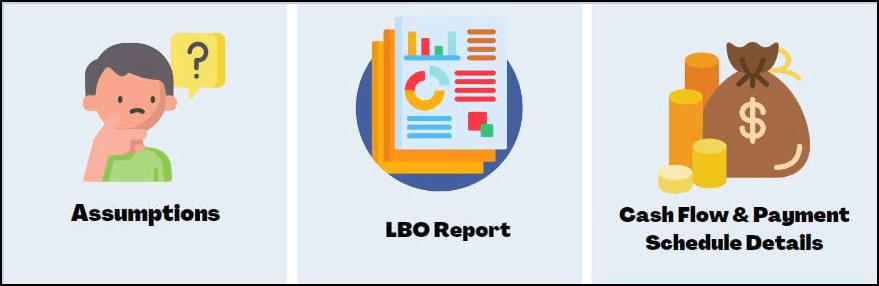
The main features of this template:
- One-sheet compact LBO Model
- Includes assumptions, LBO report and free cash flow table
- All dynamic charts and tables
- Understanding of a basic LBO model
- Printable and editable
- Professional design
For finance students, investors, valuation companies, real estate investors, and all people trying to assess the viability of a future investment. Additionally, you can use this template for the interviews of financial analyst roles, as LBO modelling is one of the most common questions asked in finance roles.
7. Conclusion
Leveraged Buyout (LBO) modeling is a cornerstone in private equity and corporate finance. It enables analysts to evaluate the feasibility and potential returns of buyouts. Understanding LBO modeling involves grasping its key components and steps.
You can build your own LBO model from scratch, or you may also download Someka LBO template for a ready solution.
As this article explains a basic leveraged buy-out model, it does not involve comprehensive financial variables. Please keep in mind that in real life financial investment may and probably will include more detailed terms and conditions.
Recommended Readings:
Can Excel be Used for Accounting?
NPV Excel Formula: How to calculate Net Present Value in Excel?
Related Posts


