28 Most Important Manufacturing KPIs & Metrics
Do you need to track the manufacturing performance meticulously? Then, you need to know the essential manufacturing KPIs and metrics to analyze your manufacturing state.
As we developed our Manufacturing Dashboard templates for years, we also studied how to measure manufacturing performance and we prepared this guide to help you with manufacturing KPIs and how to use them.
What is kpi in manufacturing?
In general, KPI stands for Key Performance Indicator. A manufacturing kpi is a well-defined and measurable metric to track in order to improve the quality of production related services. In the manufacturing industry, there are many metrics you should analyse and optimize to improve the processes.
Why should you track manufacturing kpis?
Manufacturing is a very demanding industry and production related processes should be improved on a daily basis. That’s why you should be tracking and improving the most important manufacturing kpis regularly.
What are most important kpis in manufacturing?
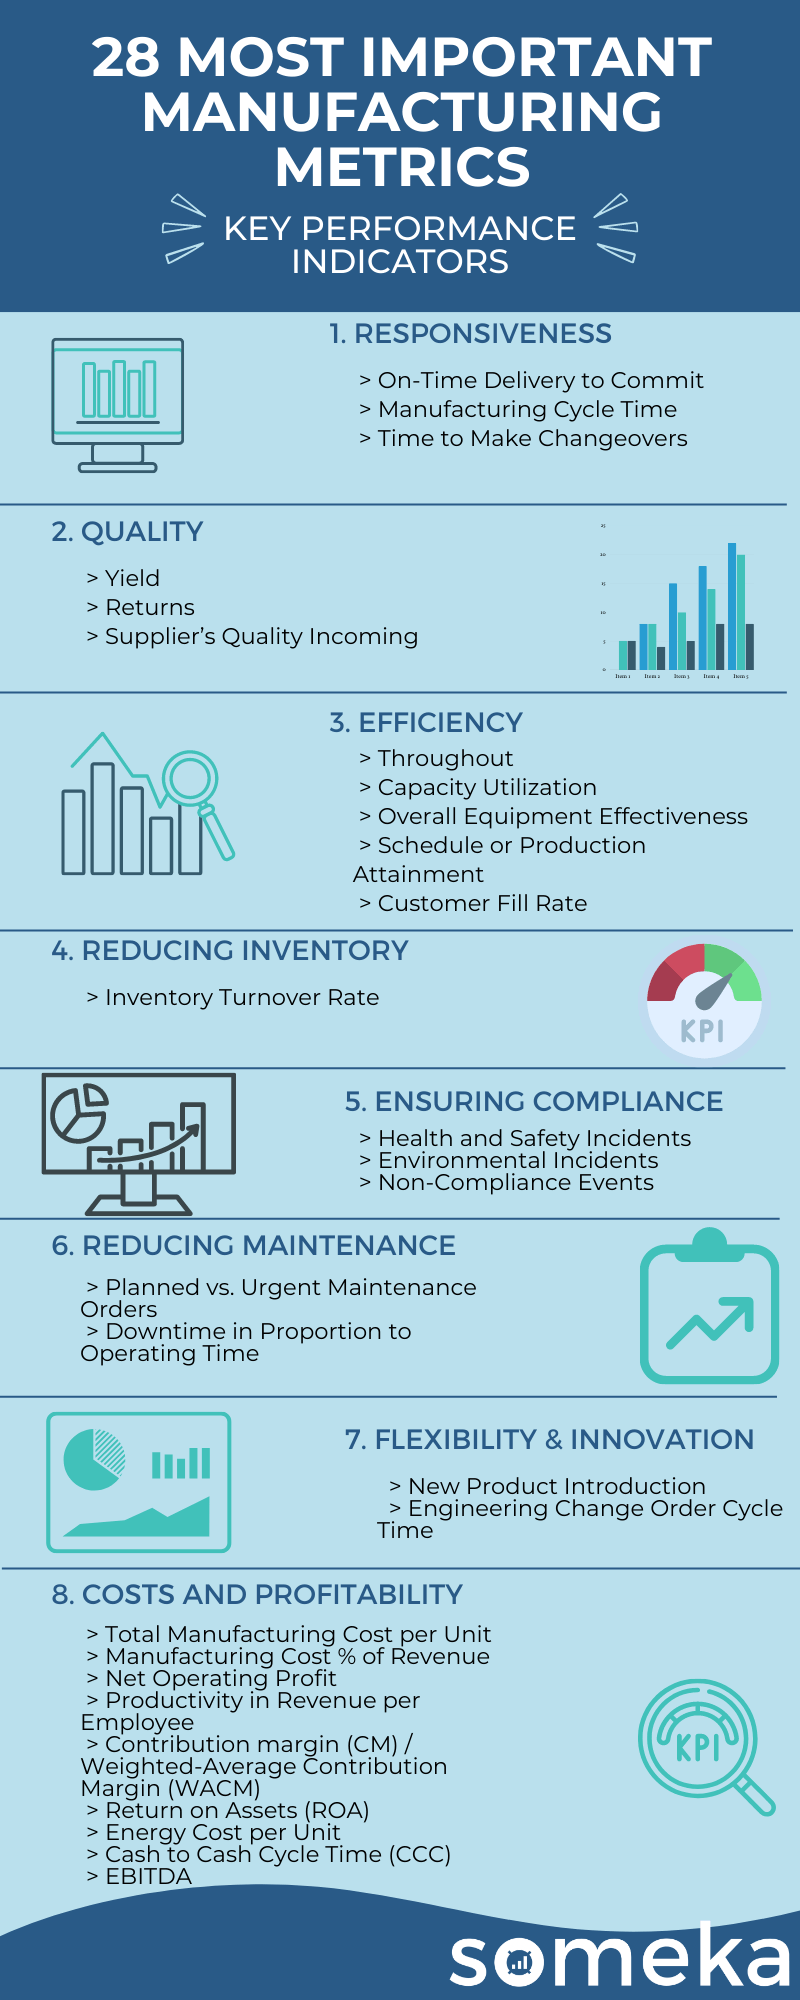
There are lots of metrics and key performance indicators in manufacturing. So, choosing the right ones to focus on is critical. During our consulting studies in years, we’ve dealt with hundreds of different manufacturing kpis. Then we’ve worked on the data, eleminated and consolidated the metrics and listed down the 28 most important manufacturing kpis to track.
Manufacturing Metrics
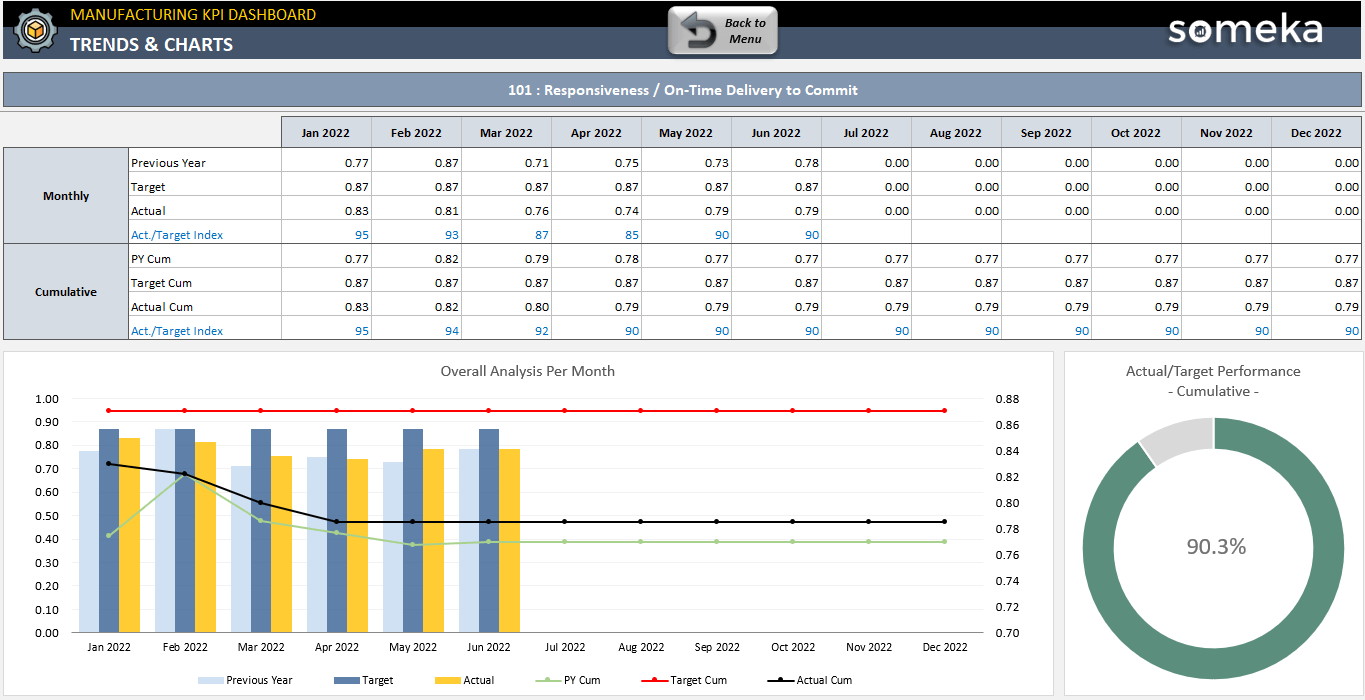
1. On-Time Delivery to Commit
Manufacturing Metrics / Customer Satisfaction / Cost / Transport / Delivery Management / Inventory Management
Description:Number project out of total were delivered on time can give a projection on the further estimations. Projects overestimated are calculated as on time, which can give a little false output value. If calculated just for one project it will just give the idea of percentage how fast project was completed in compare to the estimation. Based on that you can set a well estimated target.
Calculation Method / Formula:number of projects completed / number of sheduled projects to be completed
Should be High or Low?:If the number is much below 100, it is also good to calculate % of projects with overestimated time. That can give some lead for mistakes in estimation process itself.
2. Manufacturing Cycle Time
Manufacturing Metrics / Cost / Investment /Work Time Management / Work Efficiency / Equipment Efficiency
Description:This is the average time needed to product of one unit from brining till the finish. It should not be misunderstood with lead time witch measures whole time step by step and makes a summary of all steps time. Cycle time is usually much shorter and depends on how good orchestrated manufacturing cells are.
Calculation Method / Formula: units production time / number of produced units
Should be High or Low?:Lowering the time depends on correctly analyzed and planned production steps. If number start to grow that may be caused by some unexpected issues or some production time outs.
3. Time to Make Changeovers
Manufacturing Metrics / Work Efficiency / Work Time Management
Description:It is part of total downtime. It is measured time between last correctly produced part and start of the next one. It counts in three operations: clean, set up the position and start the production. There is plenty of methods for lean manufacturing and decreasing that time to minimum.
Calculation Method / Formula:clean up time + set up time+ start up tıme
Should be High or Low?:Depending on sector and produced part time may vary from minutes till days.
4. Yield
Manufacturing Metrics / Cost / Quality / Improvement Management / Product / Inventory
Description:Yield is the percentage of the correctly manufactured goods (including the rework on the production line) to the total manufactured goods.
Calculation Method / Formula:Y = (I)(G) + (I)(1-G)(R)
I = planned production parts number
G = correct parts [%]
R = reworked parts available for sale [%]
Should be High or Low?:You can increase the ratio by investing in rework processes and increasing quality of equipment, providing trainings for employees
5. Customer Rejects (Returns)
Manufacturing Metrics / Customer Satisfaction / Brand Value / Quality / Cost
Description:Rejected defects are the defects where the consumer states a problem, but the producer or developer didn’t detect that defect before delivering to the client. It is the comparison of undetected (rejected by client) to the total defects detected during production.
Calculation Method / Formula:The formula for weight of Rejected defects is (#Rejected Defects)/ #Total Defects.
Should be High or Low?:If the number is close to zero, the defected units can be fixed before going to client. Delivery of the defected parts can cost the company much more than increasing budget for the detection and prevention.
6. Supplier’s Quality Incoming
Manufacturing Metrics / Quality / Brand Value / Cost / Investment
Description:You can measure is as number of rejected supplies out of total orders. In that case your metrics target will be minimum, or you can measure it as a ratio of accepted incoming materials out of all and then your target will be maximum.
Calculation Method / Formula:Rejected/Total Order
Should be High or Low?:Growing ratio is a bad sign of your supplier’s products’ quality and can have a big impact on your additional costs due to customer complaints. You may consider other more expensive suppliers if that in the end could decrease your total costs.
7. Throughout
Manufacturing Metrics / Inventory Management / Work Efficiency / Profitability / Capacity
Description:Throughput is the quantity of goods that company produce over a given time period. It does not mean only the capability of the production but the production that is impacted by capacity and market/client demand.
Calculation Method / Formula:(Total Units/Processing Time) x (Processing Time/Total Time) x (Good Units/Total Units) or in a shorter way (Good Units/Total Time)
Should be High or Low?:Depends on the market or the client demand. If the number is higher than the demand it might mean there is too many people working, to many equipment for not big enough work target.
8. Capacity Utilization
Manufacturing Metrics / Work Efficiency / Cost / Equipment Efficiency / Work Time Management
Description:It is ratio between amount produced and amount that can be produced with owned resources (machines, employees).
Calculation Method / Formula:Actual level of output / Maximum Possible Output
Should be High or Low?:You may have some machines staying most of the time unused, due to the lower market demand or some of your contracts ended. You should be able to predict what the market demand will be or have some projects steeled in advance that will allow you to use your resources fully
9. Overall Equipment Effectiveness (OEE)
Manufacturing Metrics / Work Efficiency / Cost / Equipment Efficiency / Work Time Management
Description:It measures the effectiveness of your equipment affected by other factors like downtimes, bad parts, cycle time and overall effectiveness of the operators. Time that is productive divided by the overall production time.
Calculation Method / Formula:(Good Parts Count × Ideal Cycle Time) / Planned Production Time
Should be High or Low?:To reach maximum 100% is rather impossible. It means you manufacturing only Good Parts, always as fast as possible, without any Downtime.
10. Schedule or Production Attainment
Manufacturing Metrics / Work Efficiency / Cost / Equipment Efficiency / Work Time Management
Description:It measures number of produced units divided by target level of production within given time period.
Calculation Method / Formula:Actual Production /Planned Production
Should be High or Low?:Scheduling production should take into account downtime and average wasted time that is almost impossible to avoid so you can actually measure if the expectations are met. If the ratio is dropping down there might me some unexpected problems.
11. Customer Fill Rate (Perfect Delivery %)
Manufacturing Metrics / Customer Satisfaction / Cost / Transport / Delivery Management / Inventory Management
Description:It is a percentage of goods immediately available from the stock or production line while the purchase order arrives out of all purchase orders.
Should be High or Low?:If the ratio goes down, you should work on your market demand projections. This metrics is important for building your brand. If your rate will be dropping, you may lose some of your current or potential customers.
12. Inventory Turnover Rate (Work-In-Process Only) WIP Inventory / Turns
Manufacturing Metrics / Revenue / Inventory Management / Budget / Assets / Business Performance
Description:It shows how many times your company’s inventory of work in process materials move to completion and are replaced per month. It is calculated by dividing the total amount of the products which got out of the warehouse by the average inventory.
Calculation Method / Formula:Cost of goods used / average value of WIP materials
Should be High or Low?:The lower is the ratio the higher are costs of storage/warehouse.
13. Health and Safety Incidents
Manufacturing Metrics / Safety / Employee Satisfaction / Brand Value / Cost
Description:This metrics is used to track number of accidents and check your H&S team effectiveness. You can see if through the time of implementation or improvement of H&S rules actually decrease the number of incidents.
Should be High or Low?:If the number of incidents drops it means your H&S team effectiveness is high. Of course, not all the accidents are possible to avoid but with a good H&S management this number can be decreased to minimum.
14. Environmental Incidents
Manufacturing Metrics / Safety / Brand Value / Cost
Description:Each sector can have this metrics defined a little differently. To main environmental accidents you can count oil leakage, accidental release of some dangerous chemicals to the ground, air or water. It is important to keep that metrics tracked and try to keep the number as low as possible.
Should be High or Low?:Informative metrics.
15. Non-Compliance Events
Manufacturing Metrics / Operational Efficiency / Work Efficiency / Customer Satisfaction / Time Management
Description:To the main compliance issues belong: wrong implementation, incorrect or missing description on the work instructions, not following security rules for passwords, firewalls, connecting private device to the company computers, information access given to larger audience than necessary, also your contractor’s noncompliance events that you cannot really secure. This metrics is uniquely hard to measure because many times those issues are not noticed until they cause some damage to your company.
Should be High or Low?:You should track the number and try to eliminate the possibility of repeating those events.
16. Planned vs. Urgent Maintenance Orders
Manufacturing Metrics / Cost / Investment / Quality
Description:Planned Maintenance should have the frequency high enough to be able to detect problem before it will cause the machine unexpected break. So, this is important to have the maintenance scheduled adequate to the machine and it is working time. However sometimes some unexpected situations can happen, and you should know which machines and how often requires urgent maintenance and save some of your resources for those events.
Should be High or Low?:Sometimes urgent maintenance are inevitable however correct maintenance planning and good working instructions can reduce this number.
17. Downtime in Proportion to Operating Time
Manufacturing Metrics / Work Efficiency / Cost / Equipment Efficiency / Work Time Management
Description:Downtime in general means nonproductive time when it is supposed to be a productive time. Usually it depends on electricity issues or some accidents. It is measured in compare to total working time. If the machines are supposed to work 24h/day then all the nonproductive time is count in, but if the working time daily is one shift then nonproductive time is counted only during the time of shift.
Calculation Method / Formula:down time / total working time (productive + nonproductive)
Should be High or Low?:If your ratio is too high, then you may reconsider to change your equipment. You should also compare the cost of maintenance old equipment. Right decision can be an advantage in the long term.
18. New Product Introduction
Manufacturing Metrics / Product Investment / Budget Management / Cost / Sales
Description:You can measure this as a success rate in compare to expected return of investment or how often your company if launching new product.
19. Engineering Change Order Cycle Time
Manufacturing Metrics / Cost / Investment /Work Time Management / Work Efficiency
Description:ECO is request for change of some production change. For example, new dimensions or materials are used. Time needed to adapt production line to manufacture according to the new requirements is the cycle time of ECO. Measured form the moment of the request was placed until the implementation is fully made.
Should be High or Low?:Depends on the type of change the time needed for ECO can be different but production planning engineers/managers should be able to estimate the time needed.
20. Total Manufacturing Cost per Unit
Manufacturing Metrics / Cost / Quality / Investment / Equipment Efficiency
Description:Total cost of manufacturing a number of units in some given time divided by a number of units manufactured in that time. Main costs of manufacturing are materials, labor, and manufacturing overhead.
Calculation Method / Formula:Total Manufacturing Cost/Total Number of Items Manufactured
Should be High or Low?:You should be able to estimate a possible target based on manufacturing knowhow. If your estimations are wrong, you should check it with production planning engineers.
21. Manufacturing Cost % of Revenue
Manufacturing Metrics / Cost / Revenue / Equipment Efficiency / Work Efficiency
Description:You can track possibilities and influence of reducing manufacturing costs by cutting on some material or labor costs etc. However, it depends also on the success of your product sails.
Calculation Method / Formula:Total manuafacturing cost / overall revenue
Should be High or Low?:If the ratio is growing either there is lower market demand than expected or the costs of production are higher than expected.
22. Net Operating Profit
Manufacturing Metrics / Budget Management / Financial Performance / Revenue / Profitability / Sales
Description:This metrics shows financial performance of the company as level of generated profits from sales. Can be used to compare profitability between companies or industries. Counting total as operating revenue is important to understand how big percentage of the total income coming from your company’s main activity. This way you can see real productivity and profitability of the main business operations.
Calculation Method / Formula:Revenue coming from company’s primary business – COGS – Operating Expenses
Should be High or Low?:This metrics depending on many factors can be very suitable for measuring performance of the company, but it can also give false readings of real financial performance. Some of the companies
23. Productivity in Revenue per Employee
Manufacturing Metrics / Revenue / Financial Performance / Profitability / Sales
Description:This metrics can show you how efficient are your employees. You can estimate possible losses or additional income if you think about firing or hiring new employees. This is not one to one implication but can give you a good point of view while seeing changes between that metrics and a number of employees.
Calculation Method / Formula:Revenue – Total Expenses / FTE
Should be High or Low?:Mainly an informative value but you need to be careful how it changes. Maybe you have hired to many people for current situation or not enough, or maybe you are hiring new people for your new branch. Depend on that this number will be changing.
24. Contribustion margin (CM) / Weighted-Average Contribution Margin (WACM)
Manufacturing Metrics / Budget Management / Financial Performance / Revenue / Profitability
Description:It helps you to measures dependency on how your profits will grow with sales’ growth.
Calculation Method / Formula:Unit Revenue Price – Unit Variable Cost
or
(Total sales value – realted expenses value) / Number of sold units
Should be High or Low?:If the value is dropping, you may check if there are some of your products which profitability is much lower than the average and decide if it’s worth to keep products that decrease your results.
25. Return on Assets (ROA)
Manufacturing Metrics / Revenue / Budget Management / Financial Performance / Assets
Description:It is one of the ways to measure how profitable is the company. You should not compare ROA of completely different companies, but you can see how your company is growing through the time and see if your company can make a well use out of the assets owned. Main assets of the manufacturing companies are usually land, buildings machines, workstations, trucks or computers.
Calculation Method / Formula:Net Profit / Total Assets
Should be High or Low?:The higher result the higher asset efficiency
26. Energy Cost per Unit
Manufacturing Metrics / Cost / Budget Management / Financial Performance
Description:Total cost of energy used to produce a number of units measured in given period of time (for example month) including machines, computers energy consumption but also lights, heating, AC etc. divided by the number of produced units. You can use this metrics to track how much this number is dropping depending on the production volume.
Calculation Method / Formula:Total energy expenses / total number of produced units
Should be High or Low?:Usually if you increase the production volume the average cost will drop down, that can be useful information for your calculation comparing to the market demand and actual reason to increase or not the volume.
27. Cash to Cash Cycle Time (CCC)
Manufacturing Metrics / Operational Efficiency / Financial Performance / Revenue / Profitability
Description:It measures time needed to convert company investments into inventory and sales into cash.
Calculation Method / Formula:Sales Days + Inventory Days – Payable Days
Should be High or Low?:This metrics can allow you to manage your inventory and track your company development through the time.
28. EBITDA
Manufacturing Metrics / Budget Management / Financial Performance / Revenue / Profitability / Sales
Description:Earnings Before Interest, Taxes, Depreciation and Amortization. Used to measure financial performance of the company as level of generated profits from sales. Can be used to compare profitability between companies or industries.
Calculation Method / Formula:Net Profit + Interest + Taxes + Depreciation + Amortization
Should be High or Low?:This metrics depending on many factors can be very suitable for measuring performance of the company, but it can also give false readings of real financial performance. Some of the companies
Below is the summary of Manufacturing KPI metrics:
Most Important KPIs for Different Industries
All industries have different dynamics hence various kpis are being tracked and measured. Below you can see the list of different sectors and areas where we have listed most important kpis for each of them.
Related Posts


