23 Most Important Marketing KPIs & Metrics
Successful marketing directly affects the financial success of any business. That’s why it is important to measure the performance of your business’s marketing efforts with the right key metrics or marketing KPIs (key performance indicators).
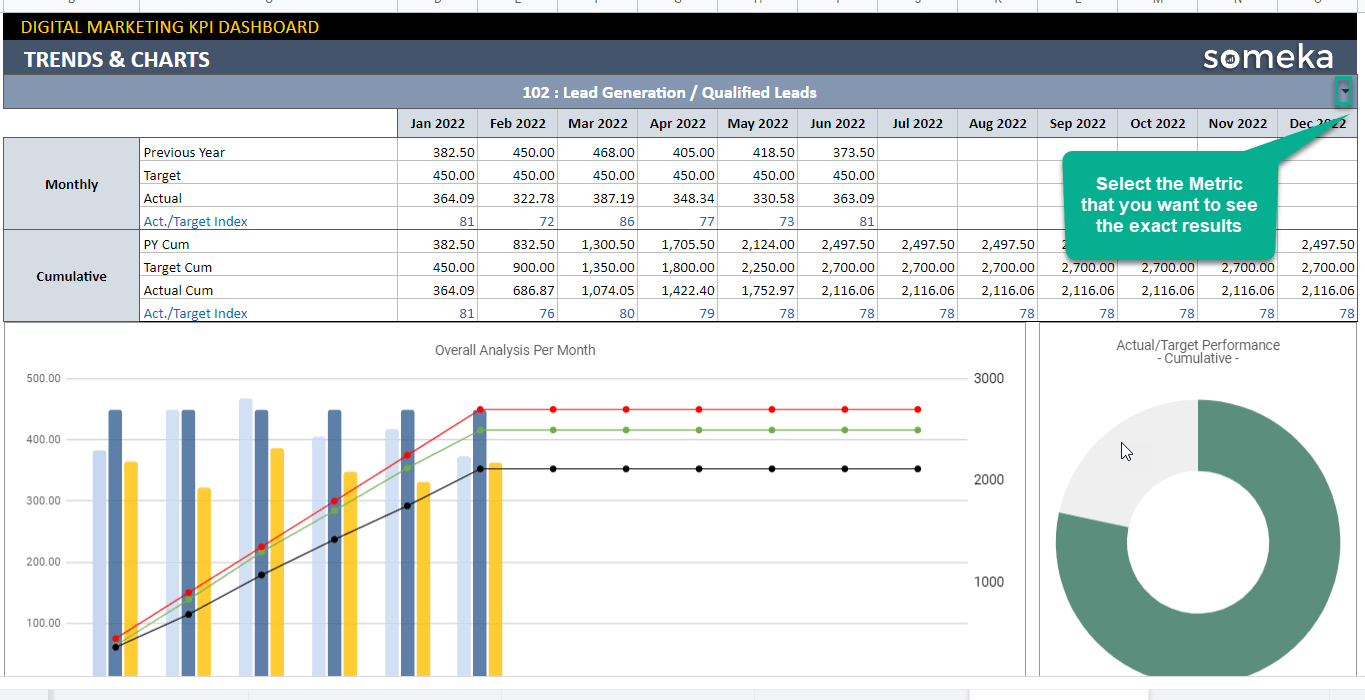
Here at Someka, we work hard to make useful Marketing Dashboard Templates. With this experience, we are proud to present you the most used marketing KPIs and what they mean.
What is KPI in Marketing?
Marketing KPIs are short for marketing key performance indicators. They are key metrics that signify the state of growth, success, and other aspects of marketing departments or businesses.
Why should you track marketing KPIs?
Marketing is a competitive area of business and it is highly significant for financial success. So, tracking marketing KPIs allows you to see your company’s potential whether it is good or bad.
What are the most important KPIs in marketing?
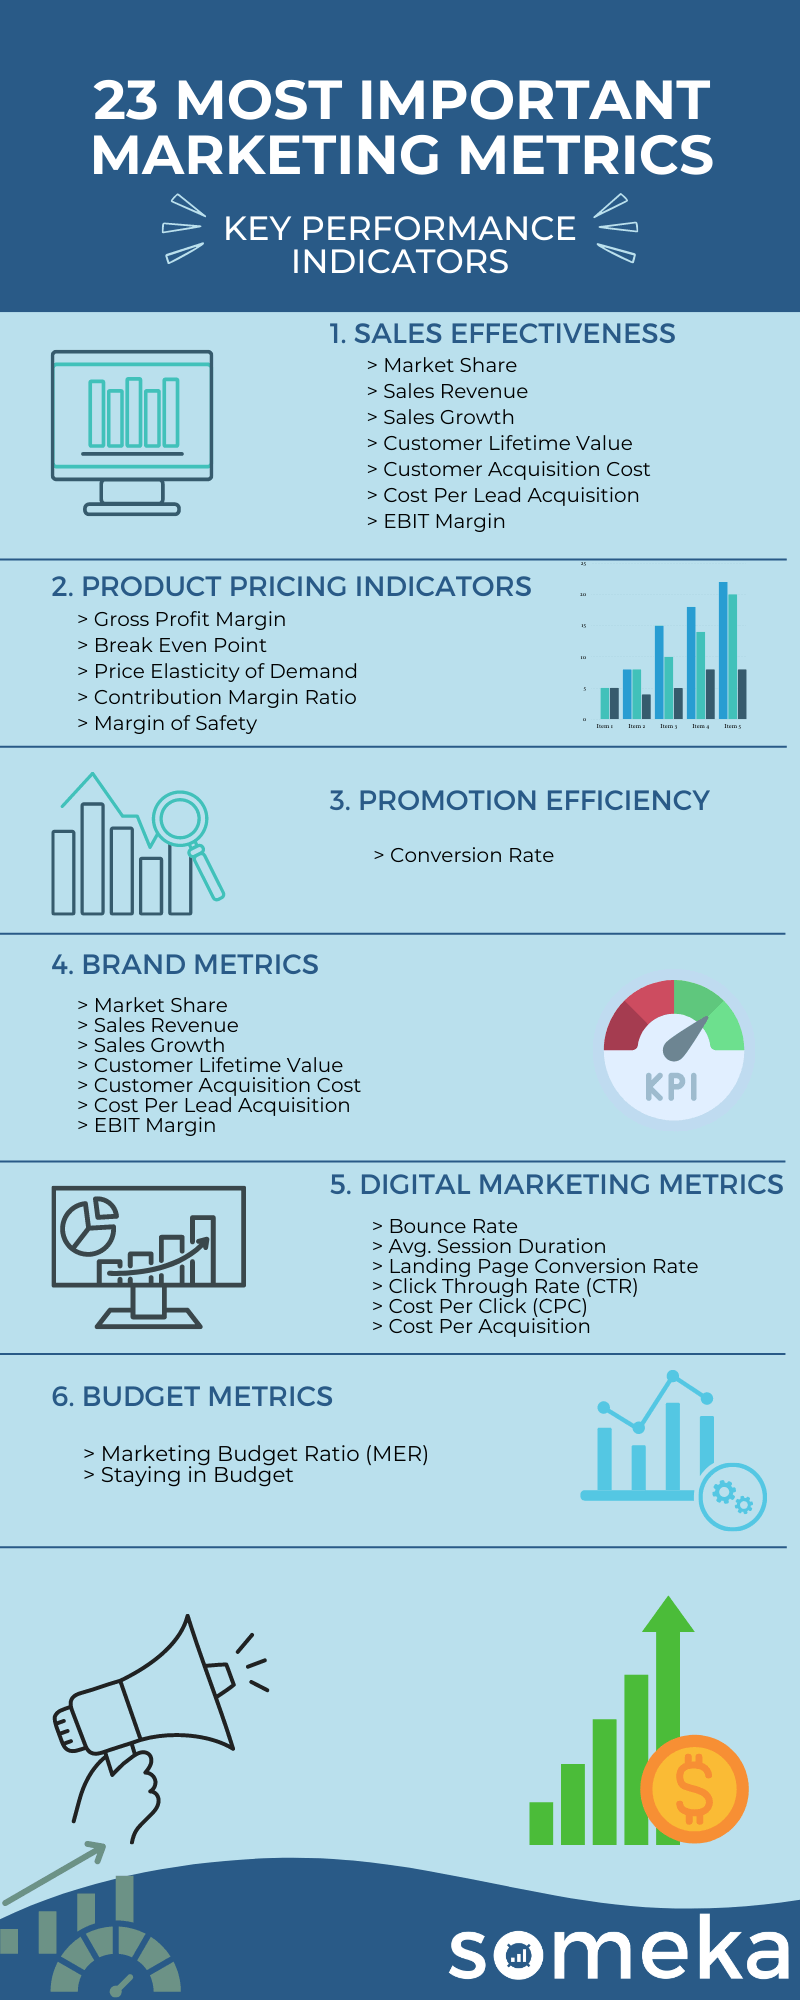
There are many aspects of a successful marketing department, project, or agency. Thus, there are as many marketing KPIs as these aspects. Nonetheless, we prepared the most common 23 marketing metrics to help you organize your KPI dashboard.
Marketing Metrics
1. Market Share
Marketing Metrics / Business Performance / Brand Value / Assets / Sales
Description:It is the percentage of a market taken by your company or product earned over a specified period of time. This information is important to track because it can have a high impact on all your campaigns and success of your products or services.
Should be High or Low?:Usually 100% target is risky and not really pay off the effort needed to be taken. But it is important to be aware of changes on the market and react in proper way.
2. Sales Revenue
Marketing Metrics / Work Efficiency / Financial Performance / Revenue / Profitability / Sales
Description:Total value of all goods or services sold. You should not include any returns or allowances.
Calculation Method / Formula:Sales price * number of units sold
Should be High or Low?:If the value drops you may have look closer on your investments, marketing and budget planning.
3. Sales Growth
Marketing Metrics / Revenue / Financial Strategies / Sales / Work Effectiveness / Marketing Strategies
Description:It measures effectiveness of your sales team. If and how much they can influence the growth income through some period of time. To measure it you need to compare your sales value between some given periods of time.
Calculation Method / Formula:(sales revenue from current month – sales revenue from previous month) / sales revenue from previous month
Should be High or Low?:If your company is growing the number will most likely be fairly higher. Later on, the target will depend if your company is releasing new products or how is your brand value placed on the market among the other companies.
4. Customer Lifetime Value – LTV
Marketing Metrics / Financial Performance / Revenue / Customer Value / Sales
Description:Estimate value of the net profit coming from the entire future relationship with a client. It is the total amount of profit that average client is likely to spend over the time while being a client (Customer lifespan).
Calculation Method / Formula:one of the ways to measure LTV is:
Average value of sale * number of transactions * Retention time * profit margin
Should be High or Low?:Lower or higher number depends on type of your products or services. You can set some target and with correct investments in development and marketing strategies you can try to increase that number.
5. Customer Acquisition Cost (CAC)
Marketing Metrics / Marketing / Costs / Sales / Customer Value
Description:It is a total cost of advertising to convince a potential customer to buy your product or service. It may show you how good is your marketing strategy. The target of any marketing should be gaining as much as possible new customers not just visitors without real value. You have to remember to include in the expense’s salaries, costs of software, equipment, rent etc. Conversion is very often mix with acquisition of a client it is important to know the difference, acquisition means gaining a potential client that starts a subscription but he haven’t spent money yet while conversion counts only customers who spent already money on your product or services.
Calculation Method / Formula:(Total Marketing + Sales Expenses) / number of New Customers Gained
Should be High or Low?:It is related to your campaign and marketing strategies. You should choose it according to your target based on a value of an average customer.
6. Cost Per Lead Acquisition (CLA)
Marketing Metrics / Sales / Marketing Effectiveness / Digital Marketing / Customer Value / Cost
Description:It is usually confused with CPA which stands for generated prospects, but this metrics is measuring cost of all the leads generated counted together with both possible customers and the one that will not be interested in your products. This is important to have the campaigning well created for the target customer, so you don’t pay extra costs for attracting people from outside of the target.
Calculation Method / Formula:Total advertising (campaign) cost / number of generated leads
Should be High or Low?:It is related to your campaign and marketing strategies. You should choose it according to your target based on a value of an average customer.
7. Gross Profit Margin
Marketing Metrics / Budget Management / Financial Performance / Revenue / Profitability
Description:How much profit you make on each dollar of sales before most of the expenses. The gross profit is calculated by the total revenue reduced by the cost of sale of those goods. Comparing this metrics with Net Profit margin you can also track all the other expenses that are not directly related to COGS.
Calculation Method / Formula:(Sales Revenue-COGS)/Revenue.
Should be High or Low?:If the number is going down, you should consider maybe removing products that doesn’t bring enough income but generates some problems and cost for improvement and customer support. If the gross margin is growing that means the investment in COGS is bringing high income and allows to improve and grow your product and services.
8. Break Even Point
Marketing Metrics / Budget Management / Financial Performance / Revenue / Profitability
Description:This is a calculation of a minimum units that has to be sold to pay the costs of the product together with the marketing costs and the taxes. Above breakeven point is where the company may start to actually make a profit.
Calculation Method / Formula:Fixed Costs / (Revenue per Unit – Variable Cost per Unit)
Should be High or Low?:The result will depend also on the market demand and your product price elasticity, but the number of units will be different for different sectors.
9. Price Elasticity of Demand (PED)
Marketing Metrics / Revenue / Market Demand / Sales
Description:It is a metrics tracking market demand changes in compare to the price changes. Depending on the metrics measurement we can say that the product or service is elastic when PED is >= 1 or inelastic when PED is <1
Calculation Method / Formula:% change in quantity demanded / % change in price
Should be High or Low?:if the PED is zero market demand will not change when the price changes, if the PED=1 then with the same % of increasing price the market demand is dropping the same %. Above 1 the demand will be dropping not 1 to 1 but higher. Tracking that metrics of your product allows you to set the price on the safe level and know how much of an impact can have a competitor on the market PED result.
10. Contribution Margin Ratio (CMR) (Cont to Sales Ratio)
Marketing Metrics / Budget Management / Financial Performance / Revenue / Profitability
Description:Contribution margin per unit manufactured presented as percentage of unit sales price.
Calculation Method / Formula:(Unit Revenue Price – Unit Variable Cost) / Sales Price Per Unit
Should be High or Low?:The negative contribution margin ratio means that variable costs and expenses are higher than sales. In that point it is good to calculate CM for separate products and see which one of them are not profitable and not worth to keep them available.
11. Margin of Safety
Marketing Metrics / Safety / Employee Satisfaction / Brand Value
Description:It is a difference between the expected profitability from the sales and the break-even point.
Calculation Method / Formula:(Current sales level – breakeven point) / current sales level
Should be High or Low?:If the ratio is low, it means a risk of loss due to changes in sales results and may result in cutting expenses.
12. Conversion Rate
Marketing Metrics / Sales / Marketing Effectiveness / Digital Marketing / Customer Value / Cost
Description:This metrics shows the percentage out of number of all visitors how many of them actually bought some of your products. The target is to have this number fairly high but even if conversion rate is not very high, but the number of visitors is growing your total sales will grow as well. You can measure if it’s worth to use pay-per-click advertisement method. If your traffic is high but there is not comparable number of new subscribers that might not be worth to pay for that kind of advertising.
Calculation Method / Formula:# of successful actions / # of total visits.
Should be High or Low?:You may check how your strategies or product improvement influence on the conversion rate and based on that choose some directions in growing your company.
13. Brand Equity
Marketing Metrics / Brand Value / Market Share / Business Performance
Description:Brand Value and Brand Equity are two metrics to measure how much the company is worth. Value is related to the real measurable financial assets, revenue, owned goods. Equity is a value as a potential, for example brand awareness, brand rating in the eyes of a customer, usually counted as a feedback form the customers for a survey.
Should be High or Low?:İt is important to invest in good customer company relationship. This can have a big impact on building brand and high-quality associations.
14. Brand Value
Marketing Metrics / Brand Value / Market Share / Business Performance
Description:Brand Value and Brand Equity are two metrics to measure how much the company is worth. Value is related to the real measurable financial assets, revenue, owned goods. Equity is a value as a potential, for example brand awareness, brand rating in the eyes of a customer.
15. Brand Value Growth Rate
Marketing Metrics / Brand Value / Investment / Market Share / Business Performance
Description:That metrics allows you to compare period by period growth of your company value and stay aware if your brand investments and growth strategies are on the good direction.
Calculation Method / Formula:(BV from curent year – BV from previous year) / BV from previous year
16. Bounce Rate
Marketing Metrics / Digital Marketing / Sales / Cost / Marketing Effectiveness
Description:It is a percentage out of total visitors, the one who after seeing first page didn’t get interested enough to explore any further on your website.
Should be High or Low?:The high bounce rate may indicate that your website is visited by a group of people who are out of the target group. It may increase your CPC (Cost Per Click) costs.
17. Avg. Session Duration
Marketing Metrics / Digital Marketing / Seo Optimization
Description:An average time spent on the website from the moment of entering the website till the end of active looking, searching through the website. We take into calculation all the visits total time no matter of the result.
Calculation Method / Formula:total visits time / number of visitors
Should be High or Low?:There should be some optimum time spent on a website where you can see the higher conversion rate. So, the growing time doesn’t mean it will be increasing your conversion rate, but you can track the time and conversion rate dependence.
18. Landing Page Conversion Rate
Marketing Metrics / Sales / Marketing Effectiveness / Digital Marketing / Customer Value / Cost
Description:This metrics shows the percentage out of number of all visitors how many of them actually bought some of your products. The target is to have this number fairly high but even if conversion rate is not very high, but the number of visitors is growing your total sales will grow as well. You can measure if it’s worth to use pay-per-click advertisement method. If your traffic is high but there is not comparable number of new subscribers that might not be worth to pay for that kind of advertising.
Calculation Method / Formula:# of successful actions / # of total website visits.
19. Ads Click Through Rate (CTR)
Marketing Metrics / Seo Optimization / Sales / Marketing Effectiveness / Digital Marketing / Customer Value
Description:This metrics measures ranking of how good your advertising campaign is. However, you should be aware and create your ads according to your goals. It is not too much valuable to have a very high score coming from the people who won’t be interested in your product. Also, you may consider changing your paying plan for other types like cost per sale or cost per lead.
Should be High or Low?:Higher number allows you to stay in the top results of the search engine but depending on the ratio between clicks and actual sales is very important and for some companies it may generate higher costs and incomes.
20. Cost Per Click (CPC)
Marketing Metrics / Cost /Digital Marketing / Marketing Strategies / Investment
Description:It is a calculated cost per each click in the payed advertising. It is important metrics while choosing types of the payment methods depended on the advertisement interactions.
Calculation Method / Formula:Advertising cost / number of clicks
Should be High or Low?:If the conversion rate of the click is high, then the cost per click might go higher and the results will be going in the good direction. But if the conversion rate is small then it is important to find a proper method of payment advertisement, so the investment does not exceed the income from those clicks.
21. Cost Per Acquisition (CPA)
Marketing Metrics / Marketing / Costs / Sales / Customer Value
Description:It is a total cost of advertising to convince a potential customer to buy your product or service. It may show you how good is your marketing strategy. The target of any marketing should be gaining as much as possible new customers not just visitors without real value. You have to remember to include in the expense’s salaries, costs of software, equipment, rent etc. Conversion is very often mix with acquisition of a client it is important to know the difference, acquisition means gaining a potential client that starts a subscription but he haven’t spent money yet while conversion counts only customers who spent already money on your product or services.
Calculation Method / Formula:(Total Marketing + Sales Expenses) / number of New Customers Gained
Should be High or Low?:It is related to your campaign and marketing strategies. You should choose it according to your target based on a value of an average customer.
22. Marketing Budget Ratio (MER)
Marketing Metrics / Budget Management / Planning Effectiveness / Cost / Investment / Marketing
Description:It is a ratio between total expenses spend on the marketing and the sales revenue. Since the marketing has an impact on sales not on the other possible income, we don’t include them into this ratio.
Calculation Method / Formula:Marketing Expenses/Total Sales Revenue
Should be High or Low?:The target is to have the result possibly small, but it depends on the efficiency of the marketing.
23. Staying in Budget
Marketing Metrics / Budget Management / Planning Effectiveness / Cost / Savings
Description:How many projects out of total were delivered within set budget. It can give a projection on the further estimations. Projects overestimated are calculated as on budget, which can give a little false output value. If calculated just for one project it will just give the idea of percentage how accurate was the budget estimation in compare to reality.
Should be High or Low?:If the number is much below 100, it is also good to calculate % of projects with overestimated budget. That can give some lead for mistakes in estimation process itself.
Below is the summary of Marketing KPI metrics:
Most Important KPIs for Different Industries
Marketing KPIs are not the same with other departments’ or industries’ KPIs. Each industry has their own key metrics for assessment. For those metrics, we suggest our posts below.
Related Posts


