30 Most Important Operational KPIs & Metrics
How can you measure the performance of your management team and the operational side of your business? There are certain important operational KPIs you can use to see if your operations are in line with the overall performance of your company or not.
In this post, we gathered the fundamentals of operational and management key metrics and the details of the most used operational KPIs. You can also check our Management and Operations Dashboard templates for more useful solutions for operational analysis.
What is KPI for operations?
Operational KPIs are used to analyze the overall performance of operations in a company or the state of management throughout weeks, months and years.
Why should you track operational KPIs?
General management or operations are essential parts of any business. Every company or organization needs a well-managed operations team. Therefore, performance assessment is a must for those departments. KPIs are there to help you track the performance in a meaningful and organized manner.
What are the most important KPIs in operations?
While there are many KPIs for operations, you should decide and use only some of the meaningful ones for your organization. Still, we collected the most used 30 operational KPIs for you. So, you can determine which operational KPIs are useful to assess your own management team.
General Management Metrics
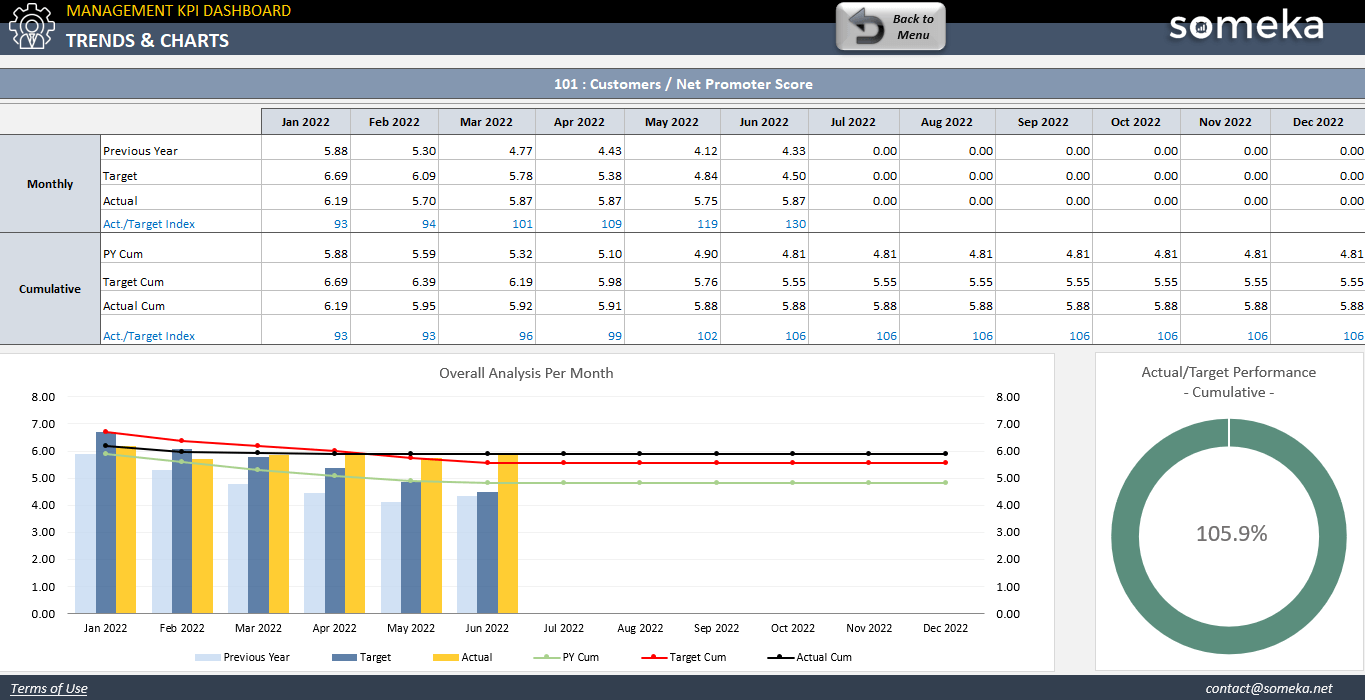
1. Net Promoter Score (NPS)
General Management Metrics / Customer Satisfaction / Customer Relationship / Brand Value / Sales
Description:That metrics can be used to measure the loyalty or satisfaction of a customer. It shows the quality of relationship between customer and your company. The metrics numbers come from respondents/customers. NPS above zero usually is taken as good result. Respondents who rate your company are usually separated in tree groups: Promoters, Detractors and Passives. On average Promoters buys more, stay loyal customers or even promote your company among other potential customers. The Net Promoter Score is calculated by subtracting the percentage of Detractors from the percentage of Promoters. Number of Passives increase the total number of respondents, and due to that it lowers down the final NPS.
Calculation Method / Formula:% of promoters – % of Detractors
Should be High or Low?:If the number is going down through a period of time, there might be some problem between your company and customers.
2. Customer Acquisition Cost (CAC)
General Management Metrics / Marketing / Costs / Sales / Customer Value
Description:It is a total cost of advertising to convince a potential customer to buy your product or service. It may show you how good is your marketing strategy. The target of any marketing should be gaining as much as possible new customers not just visitors without real value. You have to remember to include in the expense’s salaries, costs of software, equipment, rent etc. Conversion is very often mix with acquisition of a client it is important to know the difference, acquisition means gaining a potential client that starts a subscription but he haven’t spent money yet while conversion counts only customers who spent already money on your product or services.
Calculation Method / Formula:(Total Marketing + Sales Expenses) / number of New Customers Gained
Should be High or Low?:It is related to your campaign and marketing strategies. You should choose it according to your target based on a value of an average customer.
3. Customer Lifetime Value – LTV
General Management Metrics / Financial Performance / Revenue / Customer Value / Sales
Description:Estimate value of the net profit coming from the entire future relationship with a client. It is the total amount of profit that average client is likely to spend over the time while being a client (Customer lifespan).
Calculation Method / Formula:one of the ways to measure LTV is:
Average value of sale * number of transactions * Retention time * profit margin
Should be High or Low?:Lower or higher number depends on type of your products or services. You can set some target and with correct investments in development and marketing strategies you can try to increase that number.
4. Average Customer Profitability
General Management Metrics / Financial Performance / Revenue / Customer Value / Sales / Profitability
Description:Total revenue coming from the customers compared with the cost related to this income measured in given period of time. It is very similar metrics to Customer lifetime value. The main difference is that in CLV we take into calculation all the money spent now and in the future for example due to active subscription by the customer while the customer profitability is based on the sales current and previous only. However, most of the time it is calculated exactly the same as CLV
Calculation Method / Formula:revenue earned (in period of time) – costs related to the customer relationship (in the same period of time)
Should be High or Low?: To keep this metrics on a proper level you should be tracking sales teamwork and adjust the number or employees to actual demand. If there are not enough employees your real costs may increase due to the bad customer experience etc. However, overemployment may also cause your company unnecessary extra expenses.
5. Customer Retention Ratio
General Management Metrics / Customer Satisfaction / Customer Value / Brand Value / Sales
Description:It is the percentage of loyal customers who keep using/purchasing your products in the end of the measured period of time out of customers counted at the beginning of that period of time. New customers are not counted into this metrics. This can help you understand your strategies for keeping your customers.
Calculation Method / Formula:(CE-CN)/CS where CE – number of all customers, CN – number of new customers acquired, CS – number of clients at the begining of the measured period
Should be High or Low?:If the number is going down, you may search for reasons and try to implement some changes. Low number might indicate some new competitor on the market or some new interesting offers that can attract clients.
6. Conversion Rate
General Management Metrics / Sales / Marketing Effectiveness / Digital Marketing / Customer Value / Cost
Description:This metrics shows the percentage out of number of all visitors how many of them actually bought some of your products. The target is to have this number fairly high but even if conversion rate is not very high, but the number of visitors is growing your total sales will grow as well. You can measure if it’s worth to use pay-per-click advertisement method. If your traffic is high but there is not comparable number of new subscribers that might not be worth to pay for that kind of advertising.
Calculation Method / Formula:# of successful actions / # of total visits.
Should be High or Low?:You may check how your strategies or product improvement influence on the conversion rate and based on that choose some directions in growing your company.
7. Sales Realization
General Management Metrics / Financial Performance / Revenue / Sales / Profitability / Work Effectiveness
Description:Sales realization is a percentage of actually sold goods where seller received payment out of total sales together with the one where the payment wasn’t successfully finished
Calculation Method / Formula:number of recieved payments / number of total sold products (or services)
Should be High or Low?:In case of dropping number, you may check if there is no problem with payment methods or there are some misunderstandings that leads customer to withrow or not pay the money.
8. Relative Market Share
General Management Metrics / Business Performance / Brand Value / Assets / Sales
Description:It is a ratio between your company’s market share and the largest competitor in the market. Where market share is the percentage of a market taken by your company or product earned over a specified period of time. This information is important to track because it can have a high impact on all your campaigns and success of your products or services.
Should be High or Low?:If this metrics is dropping, you should know if it’s because of new competitors on the market or because of your marketing effectiveness and be able to create new marketing strategies based on the market status.
9. Revenue Growth Rate
General Management Metrics / Budget Management / Financial Performance / Revenue / Profitability / Sales
Description:Month after month percentage change. It shows how the revenue is changing during a period of time.
Calculation Method / Formula:(Revenue Curent Month – Revenue Previous Month ) / Revenue Previous Month
10. Net Profit
General Management Metrics / Revenue / Financial Performance / Profitability
Description:It is the total profit made at the end of the month. It is calculated as total income minus total costs including tax. It shows how profitable is your company month by month. Depend on the size of the company costs will not only grow but they might be quite complex to follow.
Calculation Method / Formula:Revenue – Total Expenses (taxes included)
Should be High or Low?:It may vary depending many factors, like time of the year, new competitors on the market etc. But in case dropping dangerously it may give a strong hint to study the reasons.
11. Net Profit Margin
General Management Metrics / Budget Management / Financial Performance / Revenue / Profitability
Description:It is a measure of how profitable your company is. The metrics is a percentage of net income out of total income and the main factor here are the costs of that income. If you are able to reduce costs your profit margin will grow visible.
Calculation Method / Formula:Net Profit / Revenue
Should be High or Low?:It is impossible to eliminate costs and reach 100% but general analysis of your marketing strategies and company targets may give you a good direction how to increase your revenue. Sometimes decreasing costs may be a good option but sometimes increasing budget may give you much higher revenue than the investment.
12. Gross Profit Margin
General Management Metrics / Budget Management / Financial Performance / Revenue / Profitability
Description:How much profit you make on each dollar of sales before most of the expenses. The gross profit is calculated by the total revenue reduced by the cost of sale of those goods. Comparing this metrics with Net Profit margin you can also track all the other expenses that are not directly related to COGS.
Calculation Method / Formula:(Sales Revenue-COGS)/Revenue.
Should be High or Low?:If the number is going down, you should consider maybe removing products that doesn’t bring enough income but generates some problems and cost for improvement and customer support. If the gross margin is growing that means the investment in COGS is bringing high income and allows to improve and grow your product and services.
13. Operating Profit Margin
General Management Metrics / Budget Management / Financial Performance / Revenue / Profitability / Sales
Description:It is a measure of how profitable your company’s main activity is. The metrics is a percentage of operating income to the value of net sales. Operating income (EBIT) exclude cost of goods and operating expenses so if you are able to reduce those costs your profit margin will grow visible.
Calculation Method / Formula:EBIT / Net sales
Should be High or Low?:If the value drops you may have look closer on your investments, marketing and budget planning.
14. Return on Investment (ROI)
General Management Metrics / Revenue / Budget Management / Financial Performance / Investment
Description:The most common profitability metrics used for financial decisions. It helps to analyze how efficient/profitable was your investment. Profit vs Investment
Calculation Method / Formula:Net Profit / Cost of investment
Should be High or Low?:The problem with this metrics is that it doesn’t include time. So, it might be misleading. Depending on your investment you may have results immediately or you need to wait longer time for accurate benefit.
15. Cash Conversion Cycle (CCC)
General Management Metrics / Operational Efficiency / Financial Performance / Revenue / Profitability
Description:It measures time needed to convert company investments into inventory and sales into cash.
Calculation Method / Formula:Sales Days + Inventory Days – Payable Days
Should be High or Low?:This metrics can allow you to manage your inventory and track your company development through the time.
16. Return on Assets (ROA)
General Management Metrics / Revenue / Budget Management / Financial Performance / Assets
Description:It is one of the ways to measure how profitable is the company. You should not compare ROA of completely different companies, but you can see how your company is growing through the time and see if your company can make a well use out of the assets owned. Main assets of the manufacturing companies are usually land, buildings machines, workstations, trucks or computers.
Calculation Method / Formula:Net Profit / Total Assets
Should be High or Low?:The higher result the higher asset efficiency
17. Return on equity (ROE)
General Management Metrics / Revenue / Budget Management / Financial Performance / Investment
Description:Measurement of financial performance calculated by dividing net income by shareholders’ equity (shareholders’ equity= company’s assets minus its debt). How effectively company’s assets are used to create profits.
Calculation Method / Formula:Net Profit / Average Shareholders’ Equity
Should be High or Low?:Higher ROE means higher profits.
18. Capacity Utilization Rate
General Management Metrics / Time Management / Work Efficiency / Market Demand / Market Share
Description:Capacity Utilization Rate is the percentage of total output capacity used at any given point.
Calculation Method / Formula:(Throughout/Potential Output) x 100
Should be High or Low?:Dropping percentage may indicate problems on the line, machines downtime, some injuries or new unexperienced workers.
19. Scheduled Variance (SV)
General Management Metrics / Budget Management / Financial Performance / Revenue / Cost
Description:Schedule variance shows the differences in budget estimations and real situation. This metrics is calculated by the difference between EV and PV. Earned Value (EV) is the current value of the project in current form(status), other name Budgeted Cost of Work Performed. Planned Value (PV) is amount of money that were calculated to be spent on the project so far, other name: Budgeted Cost of Work Scheduled.
Calculation Method / Formula:Earned Value – Planned Value
Should be High or Low?:If the conclusion is: below 0 – you are behind the schedule – lost money; 0 – you are on schedule; above zero – ahead of schedule – earned money.
20. Project Cost Variance (CV)
General Management Metrics / Budget Management / Financial Performance / Revenue / Cost
Description:This metrics shows how accurate is your planning the project costs and how well you manage the budget during the time of project life from the beginning until Market Release. The percentage in the end of project shows what is the percentage of assumed at the beginning cost. If the value comes close to zero long before the end of the project it may show that the budget evaluation was wrong.
Calculation Method / Formula:Earned Value – Actual Cost
Should be High or Low?:If the conclusion is: below 0 – you are behind the schedule; 0 – you are on schedule; above zero – ahead of schedule.
21. Earned Value (EV)
General Management Metrics / Budget Management / Financial Performance / Revenue
Description:This metrics helps you to track where you are on the budget and timeline with your project considering already completed part of the project and its current value. This metrics is valuable to track to be aware of budget variance and cost variance.
Should be High or Low?:If your earned value is below your estimations, you should look closer to your planned value and actual cost and try to find reasons in those both factors.
22. Order Fulfilment Cycle Time
General Management Metrics / Customer Satisfaction / Cost / Transport / Delivery Management / Inventory
Description:The average time that takes to fulfill the purchase order. Counting time starts from receiving PO and end after successful delivery where delivered goods match the purchase order.
Should be High or Low?:This metrics is very important for building good relationship with customers and it is important to always work to improve that metrics.
23. Delivery On Time
General Management Metrics / Customer Satisfaction / Cost / Transport / Delivery Management / Inventory Management
Description:How many tasks out of total were delivered on time. It can give a projection on the further estimations. If calculated just for one project it will just give the idea of percentage how fast project was completed in compare to the estimation.
Calculation Method / Formula:number of projects completed / number of sheduled projects to be completed
Should be High or Low?:If the number is much below 100, it is also good to calculate % of projects with overestimated time. That can give some lead for mistakes in estimation process itself.
24. Quality Index
General Management Metrics / Quality / Brand Value / Cost / Investment
Description:It is evaluation the quality factors depending on the characteristics of a company sector.
Should be High or Low?:It is important to track and improve the quality index.
25. Process Downtime Level
General Management Metrics / Work Efficiency / Cost / Equipment Efficiency / Work Time Management
Description:Downtime in general means nonproductive time when it is supposed to be a productive time. Usually it depends on electricity issues or some accidents. It is measured in compare to total working time. If the machines are supposed to work 24h/day then all the nonproductive time is count in, but if the working time daily is one shift then nonproductive time is counted only during the time of shift.
Calculation Method / Formula:down time / total working time (productive + nonproductive)
Should be High or Low?:If your ratio is too high, then you may reconsider to change your equipment. You should also compare the cost of maintenance old equipment. Right decision can be an advantage in the long term.
26. Staff Advocacy Score
General Management Metrics / Employee Satisfaction / Work Efficiency / Employee Management
Description:Is a measurement of employers satisfaction and how likely your employees would recommend your company to others as a workplace.
Should be High or Low?:It helps you to estimate how happy are your employees in their work environment.
27. Employee Engagement Level
General Management Metrics / Employee Satisfaction / Employee Management / Budget Management
Description:Employee engagement level is related to the satisfaction level and how much the employees feel good at the workplace and how responsible they feel for their job.
Should be High or Low?:It helps you to estimate how happy are your employees in their work environment.
28. Absenteeism Bradford Score
General Management Metrics / Employee Satisfaction / Work Efficiency / Employee Management
Description:It is a score that calculate employee absence impact on the overall work organization. In general, it says that longer holidays but taken once are less harmful for the organization efficiency than single days of short but many holidays.
Should be High or Low?:The higher result the worse work efficiency.
29. Human Capital Value Added
General Management Metrics / Investment / Assets / Work Efficiency / Business Performance
Description:This metrics can show you how efficient are your employees. You can estimate possible losses or additional income if you think about firing or hiring new employees. This is not one to one implication but can give you a good point of view while seeing changes between that metrics and a number of employees.
Calculation Method / Formula:Revenue – (Total Expences – Employment Cost) / FTE
Should be High or Low?:The higher number the higher profitability per employee.
30. 360 Degree Feedback Score
General Management Metrics / Employee Satisfaction / Work Efficiency / Employee Management
Description:In other name multi source feedback. It is a collected feedback from employees, colleagues, supervisors, sometimes also external source feedback regarding each employee. It helps to evaluate better your employees than a one perspective evaluation.
Below is the summary of Operational KPI metrics:

Most Important KPIs for Different Industries
Obviously, operational KPIs cannot be used for all the industries out there. All industries have KPIs determined specifically for them. Check out our posts to see KPIs for other fields of business or industries now!
Related Posts


