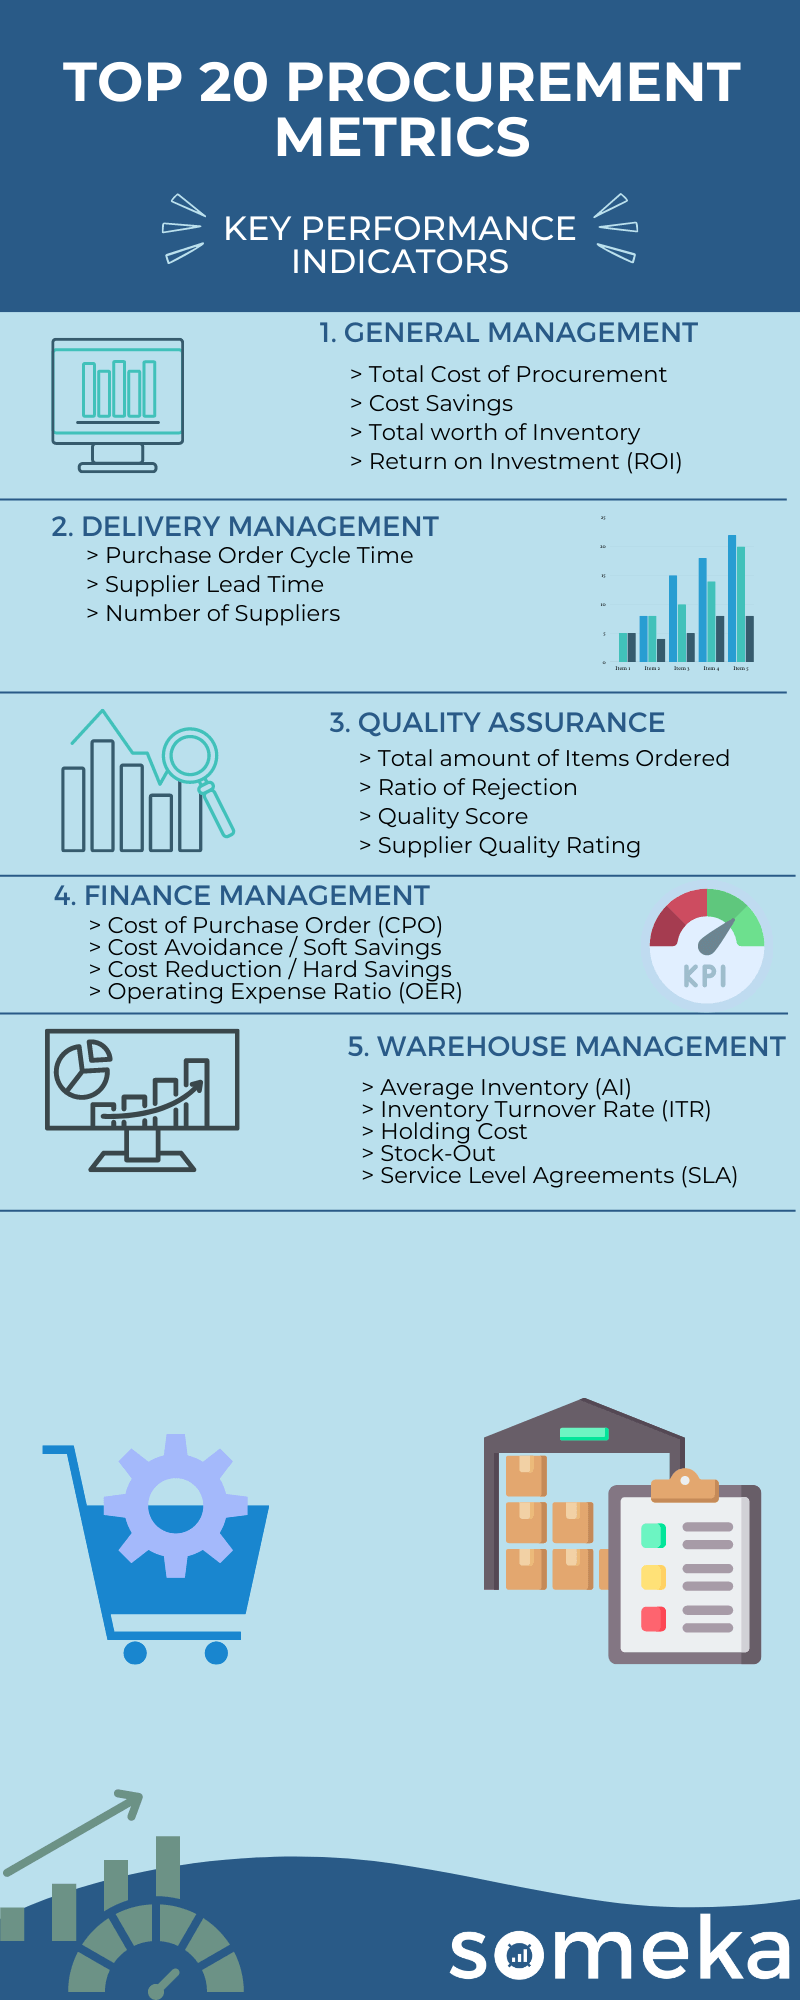
Top 20 Procurement KPIs & Metrics to Track
Procurement KPIs are specific metrics to track the performance of buying goods and services for your business and that’s why they are more obscure to determine for your own company. To help with this challenge, we gathered 20 procurement KPIs and metrics that will help you assess your procurement efforts. We also suggest you to look at our Procurement Dashboard templates for further assistance for your procurement KPI dashboard.
What is KPI in procurement?
Briefly, you use procurement KPIs to analyze and advance the success of your procurement business or departments in your company. They are the key metrics to measure performance.
Why should you track procurement KPIs?
You can use procurement metrics to easily define the achievements and errors in your procurement departments. After defining these, you can start working to advance your procurement success.
What are the most important KPIs for procurement?
Procurement KPIs vary from business to business and there are tens of them that you can use. However, for a newcomer, we gathered the to 20 procurement key metrics.
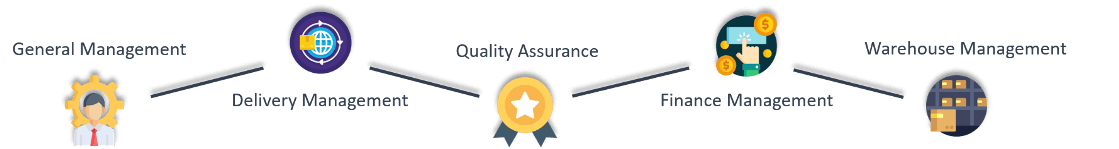
Procurement Metrics
1. Total Cost of Procurement
Procurement Metrics / Cost / Financial Performance / Profitability
Description:The total cost of purchased goods or services depended on the project requirements. This number also includes all administrative costs, processing, shipping etc.
Should be High or Low?:If the cost excesses the budget, that should give fast reaction and recalculation for the possible budget.
2. Cost Savings
Procurement Metrics / Cost / Savings / Budget Management / Financial Performance
Description:It is a total cost savings measurement coming from both hard and soft savings like cost reduction or cost avoiding.
Calculation Method / Formula:cost reduction + cost avoidance
3. Total worth of Inventory
Procurement Metrics / Revenue / Inventory Management / Budget / Assets / Business Performance
Description:The value of total units in your inventory. The value should be calculated based on the market prices. However, there are also few other approaches for calculating that metrics by using periodic or perpetual inventory system.
Should be High or Low?:The number may drop down due to many factors: like dropping prices on the market, shrinking your inventory space etc.
4. Return on Investment (ROI)
Procurement Metrics / Revenue / Budget Management / Financial Performance / Investment
Description:The most common profitability metrics used for financial decisions. It helps to analyze how efficient/profitable was your investment. Profit vs Investment
Calculation Method / Formula:Net Profit / Cost of investment
Should be High or Low?:The problem with this metrics is that it doesn’t include time. So, it might be misleading. Depending on your investment you may have results immediately or you need to wait longer time for accurate benefit.
5. Purchase Order Cycle Time
Procurement Metrics / Customer Satisfaction / Cost / Transport / Business Performance
Description:The average time that takes to fulfill the purchase order. Counting time starts from receiving PO and end after successful delivery where delivered goods match the purchase order.
Should be High or Low?:This metrics is very important for building good relationship with customers and it is important to always work to improve that metric.
6. Supplier Lead Time
Procurement Metrics / Work Efficiency / Work Time Management / Sales / Inventory Management
Description:Or vendor Lead Time, it is the amount of time between your purchase order and time when you receive the goods from your supplier. If your supplier doesn’t have the ordered units, they need to be manufactured or delivered first from other stock for the final shipment then the time will grow and you will have to take it into account for keeping your inventory higher.
Should be High or Low?:If you’re can reduce your lead time, by having more suppliers or having better contracts with your suppliers that will allow you to decrease your own stock and reduce your stock maintenance costs.
7. Number of Suppliers
Procurement Metrics / Work Efficiency / Work Time Management / Sales / Inventory Management
Description: It’s important to optimize number of your suppliers, so you can be sure about your delivery times and goods quality.
Should be High or Low?:The higher number sometimes can help for lowering supplier lead time, but too high number may be troubled for managing and keeping the price offers competitive.
8. Total amount of Items Ordered
Procurement Metrics / Financial Performance / Revenue / Sales / Profitability / Work Effectiveness
Description:The total amount of items ordered; you can use this metrics vs sold items to see sales realization. You can easily see if your company is growing and track changes through the time.
Should be High or Low?:If the number is going down that might be caused by new competitors on the market or decreasing market demand.
9. Ratio of Rejection
Procurement Metrics / Customer Satisfaction / Brand Value / Quality / Cost
Description:Rejected defects are the defects where the consumer states a problem, but the producer or developer did not detect that defect before delivering to the client. It is the comparison of undetected (rejected by client) to the total defects detected during production.
Calculation Method / Formula:The formula for weight of Rejected defects is (#Rejected Defects)/ #Total Defects.
Should be High or Low?:If the number is close to zero, the defected units can be fixed before going to client. Delivery of the defected parts can cost the company much more than increasing budget for the detection and prevention.
10. Quality Score (Rejected/Total Order)
Procurement Metrics / Cost / Quality / Customer Satisfaction / Brand Value / Investment
Description:You can measure is as number of rejected supplies out of total orders. In that case your metrics target will be minimum, or you can measure it as a ratio of accepted incoming materials out of all and then your target will be maximum.
Calculation Method / Formula:Rejected/Total Order
Should be High or Low?:Growing ratio is a bad sign of your supplier’s products’ quality and can have a big impact on your additional costs due to customer complaints. You may consider other more expensive suppliers if that in the end could decrees your total costs.
11. Supplier Quality Rating
Procurement Metrics / Quality / Brand Value / Cost
Description:You can score your suppliers and track if the score is changing through the time. That may help you eliminate some of your suppliers or decide to increase your cooperation with some of them.
Should be High or Low?:Informative metrics to be able to compare your suppliers
12. Cost of Purchase Order (CPO)
Procurement Metrics / Cost / Delivery Management / Sales
Description:Most of procurement organizations analyze their effectiveness by tracking a cost to process a purchase order. The number includes all the costs of your company necessary to be able to fulfil the purchase order.
Calculation Method / Formula:Organization’s total cost of processing / total number of orders
Should be High or Low?:If the work management is correct you should be able to reach your targets and with the time reduce them by implementing automatization or other methods of increasing productivity.
13. Cost Avoidance / Soft Savings
Procurement Metrics / Cost / Savings / Budget Management / Financial Performance
Description:In other words “soft savings,” is a measurement of ability to avoid incurring some of the costs. To most common soft savings you can check possibility to reduce working capital, decreasing capacity of your stocks, be always sure and updated about any law changes, increasing your customer and employee satisfaction.
14. Cost Reduction / Hard Savings
Procurement Metrics / Cost / Savings / Budget Management / Financial Performance
Description:Also known as “Hard Savings”. It related to managing the work costs bellow it was calculated and agreed in the budget estimation. Most common factors of cost reduction are operations, managing cost of production, transactions, transportation cost and manpower reduction. However, there are also indirect factors which increase cost savings by increasing volume of production and sales without increasing costs.
Should be High or Low?:It depends on how tight and accurate budget estimation was then actual result of savings will drop down. There might be some unpredicted problems or changes which may interfere in those savings.
15. Operating Expense Ratio (OER)
Procurement Metrics / Budget Management / Revenue / Sales / Business Performance / Work Efficiency
Description:It’s important to understand your operational effectiveness by tracking the operating expense ratio. It is related to daily company’s core operations. The lower those expenses are, the higher profit is made. operating revenue and operating expenses are related to your company’s main activity
Calculation Method / Formula: Operating Expenses / Revenue
Should be High or Low?:You can track changes and estimate possible outcomes on operating improvements.
16. Average Inventory (AI)
Procurement Metrics / Revenue / Inventory Management / Budget / Assets / Business Performance
Description:It is an average of beginning and ending inventory balance. Together with sell-through rate you can measure your warehouse’s effectiveness and take some valuable steps in your inventory maintenance strategies.
Calculation Method / Formula: (Current month inventory + Previous month inventory) /2.
Should be High or Low?:If the number is high together with high sell-through you are on a good direction. But there is no point to keep high inventory if your sell-through goes low.
17. Inventory Turnover Rate (ITR)
Procurement Metrics / Revenue / Inventory Management / Budget / Assets / Business Performance
Description:It shows how many times your department used and renew inventory per month. It is calculated by dividing the total amount of the products which got out of the warehouse by the average inventory.
Calculation Method / Formula:Cost of goods used / average warehouse value.
Should be High or Low?:The lower is the ratio the higher are costs of storage/warehouse.
18. Holding Cost
Procurement Metrics / Inventory Management / Budget Management / Cost
Description:Those are costs related to store inventory. You should sum up your warehouse rent cost, security, insurance and personnel costs, depreciation of your stock.
Should be High or Low?:You can try decrease your cost by decreasing size of your stocks by better cooperation with your suppliers. You can increase frequency of your delivery according to market demand.
19. Stock-Out
Procurement Metrics / Customer Satisfaction / Cost / Transport / Delivery Management / Inventory Management
Description:A situation in which the required item is not available in the inventory. Stock-out is a bad sign for a customer who will probably start to search for another retailer in the market. If you have a high stock-out level, you should check your other inventory metrics and reorganize it accordingly.
Calculation Method / Formula:Can be measured as a ratio of revenue: Lost sales / (Ravanue + Lost Sales)
or ratio of number of oredered goods: # Out of stok odered goods / (Total number of ordered goods)
Should be High or Low?:The target is to keep the stock-out at minimum but on the other hand you should be careful not to increase your average inventory level high above needs.
20. Service Level Agreements (SLA)
Procurement Metrics / Work Effectiveness / Quality / Cost
Description:It is an agreement between your company and providers/suppliers. It includes expectations service quality and conditions, but a big part of SLA contract is defining actions in case of any problems or product rejections, repair, recovery, responsibilities etc. SLA gives the basis for other metrics in KPI so you can see if your company and your suppliers meet some of the expectations
Below is the summary of Procurement KPI metrics:
Most Important KPIs for Different Industries
If you need more KPIs for different departments and industries, we collected the most common KPIs for every industry below.
Related Posts


