15 Most Important Project Management KPIs & Metrics
Tracking the performance of project management in your business has huge importance. Project management KPIs are the correct tools to determine whether your project management runs smoothly or not.
Just like our Project Management Dashboard Templates that we created to make PM easy for you, we also present this helpful guide for you that includes each most used project management KPI and metric. Let’s start!
What is kpi in project management?
In general, KPI stands for Key Performance Indicator. A project management kpi is a well-defined and measurable metric to track in order to improve the quality of related flow of a company. For project management specialists, there are many metrics to analyse and optimize to improve the processes.
Why should you track project management kpis?
Project management is a very demanding niche and related processes should be improved on a daily basis. That’s why you should be tracking and improving the most important project management kpis regularly. Also, you should take an pmp online training to learn more about kpis in project management.
What are most important kpis in project management?
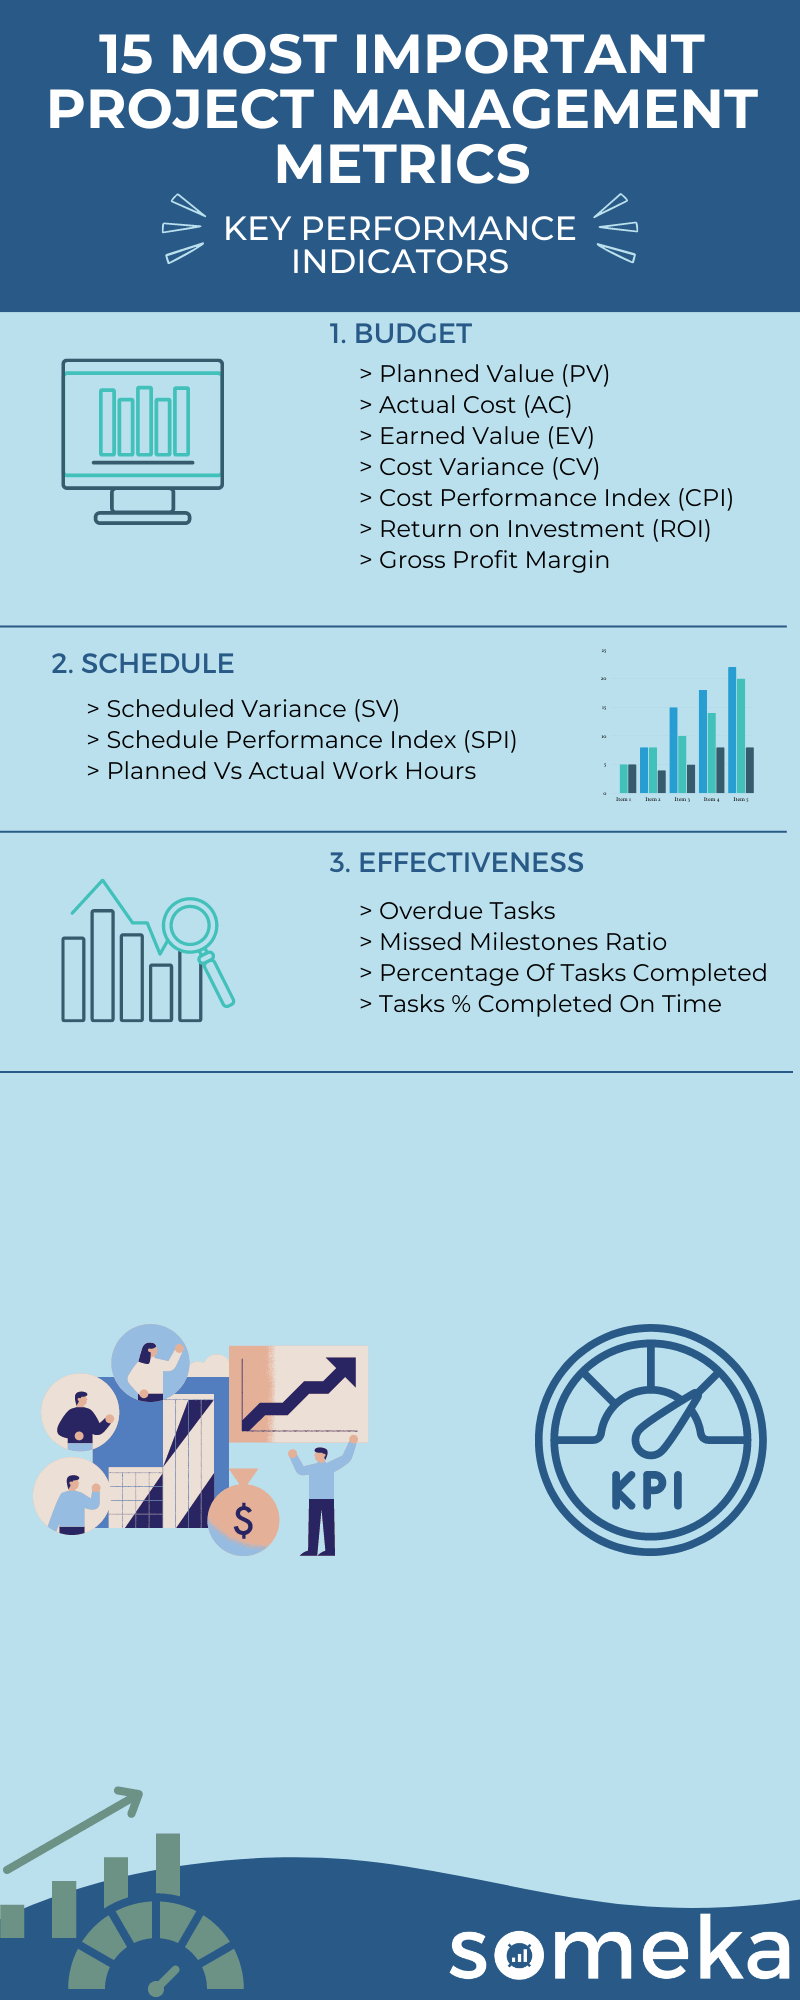
There are lots of metrics and key performance indicators for project management. So, choosing the right ones to focus on is critical. During our consulting studies in years, we’ve dealt with hundreds of different project management kpis. Then we’ve worked on the data, eleminated and consolidated the metrics and listed down the 15 most used project management kpis to track.
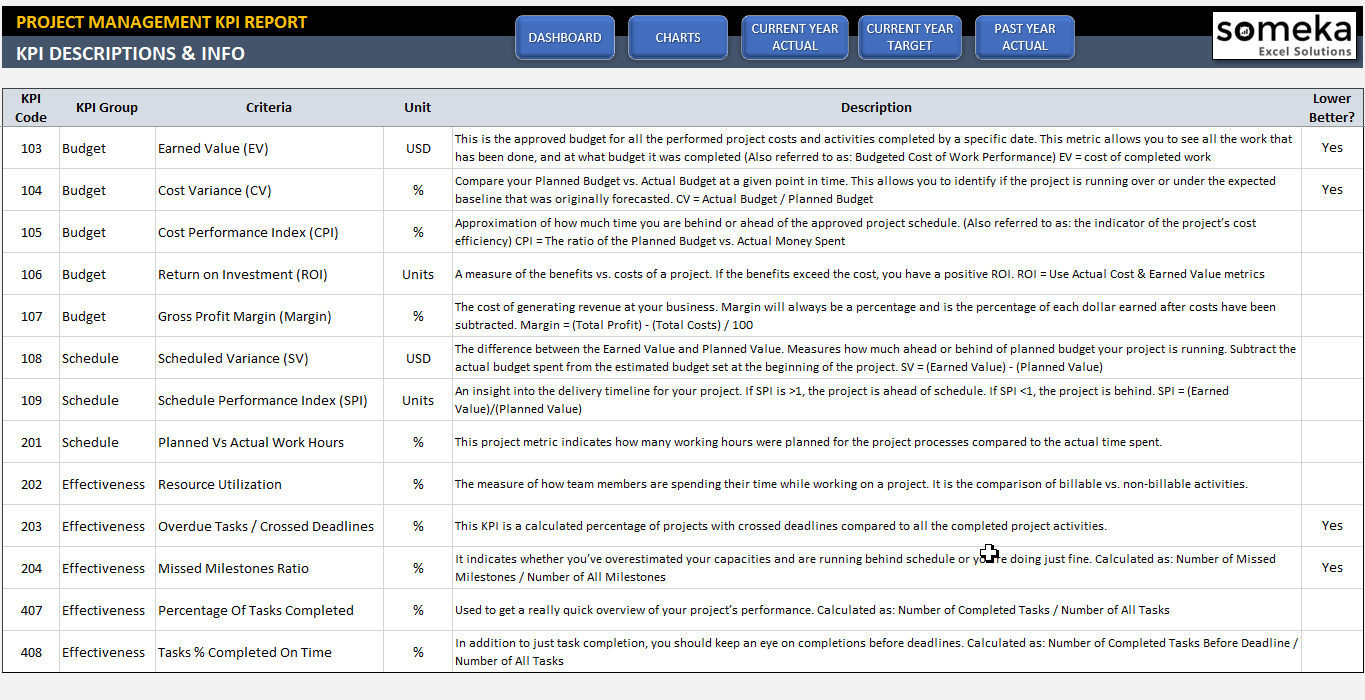
Project Management Metrics
1. Planned Value (PV)
Project Management Metrics / Budget Management / Financial Performance / Revenue
Description:There are three related metrics one to another: Planned Value, Earned Value and Actual Cost and they are used to calculate Schedule Variance and Cost Variance. Planned value is estimated and agreed budget for a specific project that must be accomplished within that budget.
2. Actual Cost (AC)
Project Management Metrics / Budget Management / Financial Performance / Revenue
Description:This metrics helps you to track where you are on the budget and timeline with your project Together with earned value this metrics allows to calculate cost variance of the project.
Should be High or Low?:If your actual cost grows above the budget it will have an impact on your cost variance. You can try to find reasons if it was wrong estimation or maybe there were some changes in the project that also will increase the earned value of the project.
3. Earned Value (EV)
Project Management Metrics / Budget Management / Financial Performance / Revenue
Description:This metrics helps you to track where you are on the budget and timeline with your project considering already completed part of the project and its current value. This metrics is valuable to track to be aware of budget variance and cost variance.
Should be High or Low?:If your earned value is below your estimations, you should look closer to your planned value and actual cost and try to find reasons in those both factors.
4. Cost Variance (CV)
Project Management Metrics / Budget Management / Financial Performance / Revenue / Cost
Description:This metrics shows how accurate is your planning the project costs and how well you manage the budget during the time of project life from the beginning until Market Release. The percentage in the end of project shows what is the percentage of assumed at the beginning cost. If the value comes close to zero long before the end of the project it may show that the budget evaluation was wrong.
Calculation Method / Formula:Earned Value – Actual Cost
Should be High or Low?:If the conclusion is: below 0 – you are behind the schedule; 0 – you are on schedule; above zero – ahead of schedule.
5. Cost Performance Index (CPI)
Project Management Metrics / Budget Management / Financial Performance / Revenue
Description:It is a ratio between earned value and actual cost. It uses the same input as Cost Variance, but the interpretation is a bit different. CV tells you how much money you earned/lost in the project while CPI shows percentage of how much % ahead or late are you with the project.
Calculation Method / Formula:Earned Value / Actual Cost
Should be High or Low?:If the conclusion is: below 0 – you are behind the schedule; 0 – you are on schedule; above zero – ahead of schedule.
6. Return on Investment (ROI)
Project Management Metrics / Revenue / Budget Management / Financial Performance / Investment
Description:The most common profitability metrics used for financial decisions. It helps to analyze how efficient/profitable was your investment. Profit vs Investment
Calculation Method / Formula:Net Profit / Cost of investment
Should be High or Low?:The problem with this metrics is that it doesn’t include time. So, it might be misleading. Depending on your investment you may have results immediately or you need to wait longer time for accurate benefit.
7. Gross Profit Margin
Project Management Metrics / Budget Management / Financial Performance / Revenue / Profitability
Description:How much profit you make on each dollar of sales before most of the expenses. The gross profit is calculated by the total revenue reduced by the cost of sale of those goods. Comparing this metrics with Net Profit margin you can also track all the other expenses that are not directly related to COGS.
Calculation Method / Formula:(Sales Revenue-COGS)/Revenue.
Should be High or Low?:If the number is going down, you should consider maybe removing products that doesn’t bring enough income but generates some problems and cost for improvement and customer support. If the gross margin is growing that means the investment in COGS is bringing high income and allows to improve and grow your product and services.
8. Scheduled Variance (SV)
Project Management Metrics / Budget Management / Financial Performance / Revenue / Cost
Description:Schedule variance shows the differences in budget estimations and real situation. This metrics is calculated by the difference between EV and PV. Earned Value (EV) is the current value of the project in current form(status), other name Budgeted Cost of Work Performed. Planned Value (PV) is amount of money that were calculated to be spent on the project so far, other name: Budgeted Cost of Work Scheduled.
Calculation Method / Formula:Earned Value – Planned Value
Should be High or Low?:If the conclusion is: below 0 – you are behind the schedule – lost money; 0 – you are on schedule; above zero – ahead of schedule – earned money.
9. Schedule Performance Index (SPI)
Project Management Metrics / Revenue / Financial Performance / Sales / Work Efficiency
Description:It is a ratio between earned value and planned value. It uses the same input as Schedule Variance, but the interpretation is a bit different. SV tells you how much money you earned/lost in the project while SPI shows percentage of how much % ahead or late are you with the project.
Calculation Method / Formula:Earned Value / Planned Value
Should be High or Low?:If the conclusion is: below 0 – you are behind the schedule; 0 – you are on schedule; above zero – ahead of schedule.
10. Planned Vs Actual Work Hours
Project Management Metrics / Work Efficiency / Time Management
Description:Accuracy of planning work time for each task. Usually tasks are different, and it is important to be able to estimate correctly how much time is needed for a specific task.
Calculation Method / Formula:time planned on a task/ time spent on a task
Should be High or Low?:Within a time and experience of employees the accuracy should be closer to 100%
11. Resource Utilization
Project Management Metrics / Work Efficiency / Cost / Equipment Efficiency / Work Time Management / Work Efficiency
Description:This metrics is used to measure if all the resources like time, people, place, machines etc. are fully occupied. Calculating this value will help you to find if there are some needs in case of more equipment needed in compare to number of employees or if you need more employees because there is more work than their capacity.
Should be High or Low?:Ideally resource Utilization should be close to 100% so yours company efficiency is not going down.
12. Overdue Tasks / Crossed Deadlines
Project Management Metrics / Project Progress / Work Effectiveness / Time Management / Cost
Description:Number of overdue tasks out of number of all tasks in given project. This metrics helps you to track progress in project and be aware of some drawbacks.
Calculation Method / Formula:number of overdue tasks / total number of tasks in project
Should be High or Low?:Sometimes it is impossible to avoid overdue takes but it is important to be aware of the problems so you can react earlier on some further changes to be able to close the project on time.
13. Missed Milestones Ratio
Project Management Metrics / Project Progress / Work Effectiveness / Time Management / Cost
Description:Number of overdue milestones out of number of all milestones in given project. This metrics helps you to track progress in project and be aware of some drawbacks. You can monitor the performance of the strategic points in a project.
Calculation Method / Formula:number of overdue milesones / total number of milestones in project
Should be High or Low?:Sometimes it is impossible to avoid overdue takes and because of that also the milestones as a strategic point in the project are being moved forward. But it is important to be aware of the problems so you can react earlier on some further changes to be able to close the project on time.
14. Percentage Of Tasks Completed
Project Management Metrics / Project Progress / Work Effectiveness / Time Management
Description:Shows the ratio of completed within all started tasks in some period of time. This metrics allows you to track if you have enough resources and capability to open more tasks and manage to stay on time with the work planned.
Calculation Method / Formula:completed tasks / all planned projects
Should be High or Low?:If the % is going down it may indicate not enough resources in people or equipment or some changes in a project.
15. Tasks % Completed On Time
Project Management Metrics / Customer Satisfaction / Cost / Transport / Delivery Management / Inventory Management
Description:How many tasks out of total were delivered on time. It can give a projection on the further estimations. If calculated just for one project it will just give the idea of percentage how fast project was completed in compare to the estimation.
Calculation Method / Formula:number of projects completed / number of sheduled projects to be completed
Should be High or Low?:If the number is much below 100, it is also good to calculate % of projects with overestimated time. That can give some lead for mistakes in estimation process itself.
Below is the summary of Project Management KPI metrics:
Most Important KPIs for Different Industries
All industries have different dynamics hence various kpis are being tracked and measured. Below you can see the list of different sectors and areas where we have listed most important kpis for each of them.
Related Posts


