25 Most Important Quality KPIs & Metrics
Quality assurance is one of the most critical parts of production in companies. But how can we measure the quality in an exact manner? To track the performance of such an abstract and complex subject, we can use quality KPIs (key performance indicators) and with the correct metrics, we can reach the right results.
While you can easily use our Quality Dashboard templates to track your quality performance, we suggest you to read our post below to learn more about quality metrics and their purposes.
What is KPI in quality?
Quality KPIs or key performance indicators are used to define the overall state of any quality department in your business or company. They are also called quality key metrics.
Why should you track quality KPIs?
Without quality teams and departments, your product and services will lack standards and it will show in your retention numbers and such. To ensure you have the best quality assessment, you should start tracking quality metrics for your business.
Without quality teams and departments, your product and services will lack standards and it will show in your retention numbers and such. To ensure you have the best quality assessment, you should start tracking quality metrics for your business. For example, for demand-side platform advertising campaigns quality metrics are CTR, CTA, CR, etc.
What are the most important KPIs in quality?
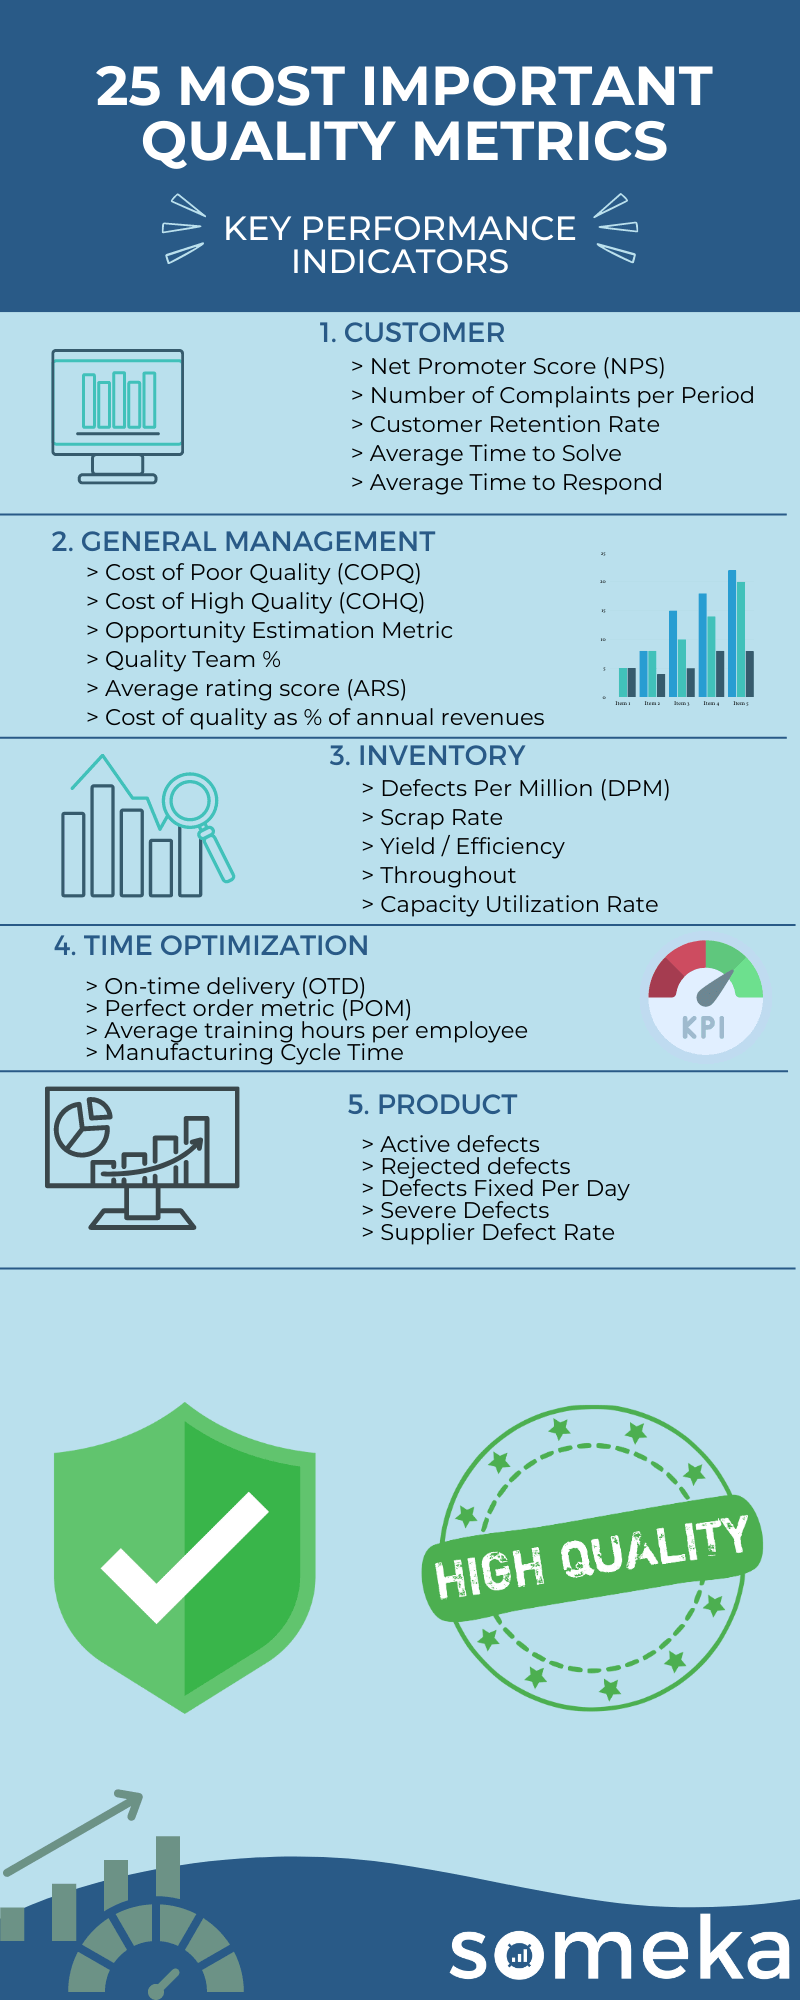
While there are many quality metrics out there, you should use the right ones specifically for your business. That’s why we present you 25 most important quality key metrics in this article.
Quality Metrics
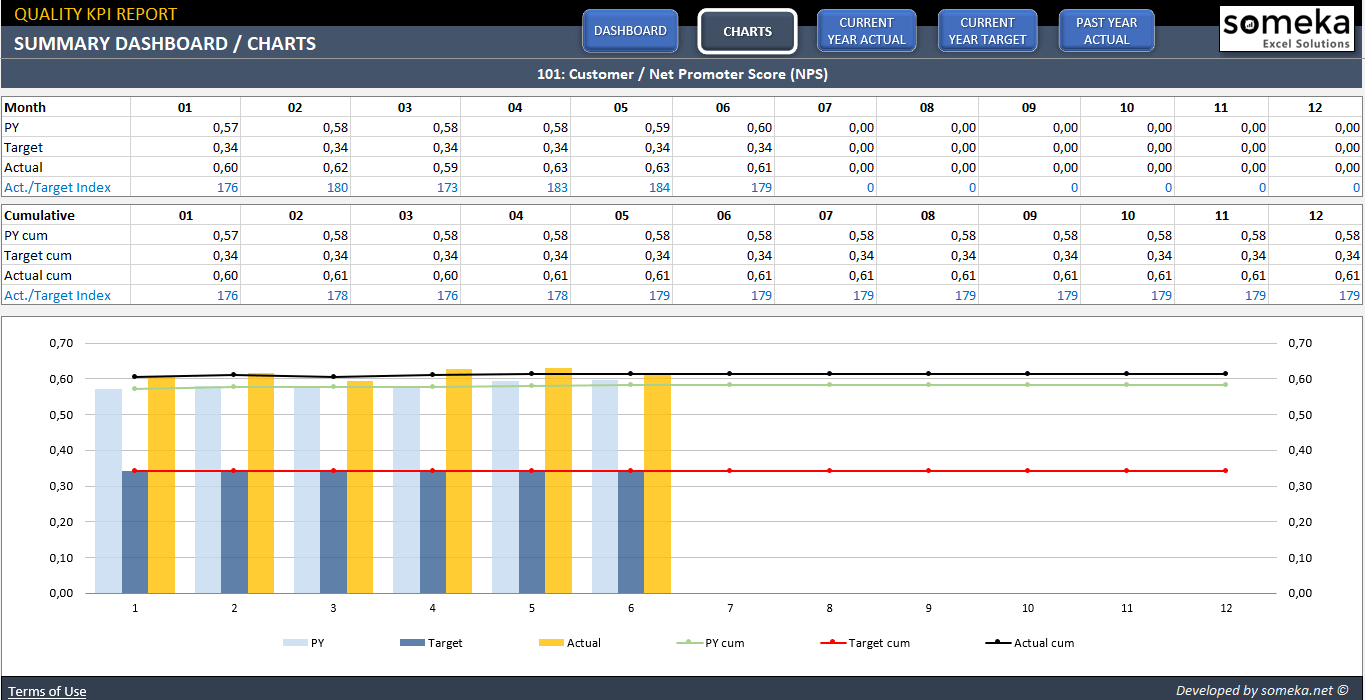
1. Net Promoter Score (NPS)
Quality Metrics / Customer Satisfaction / Customer Relationship / Brand Value / Sales
Description:That metrics can be used to measure the loyalty or satisfaction of a customer. It shows the quality of relationship between customer and your company. The metrics numbers come from respondents/customers. NPS above zero usually is taken as good result. Respondents who rate your company are usually separated in tree groups: Promoters, Detractors and Passives. On average Promoters buys more, stay loyal customers, or even promote your company among other potential customers. The Net Promoter Score is calculated by subtracting the percentage of Detractors from the percentage of Promoters. Number of Passives increase the total number of respondents, and due to that it lowers down the final NPS.
Calculation Method / Formula:% of promoters – % of Detractors
Should be High or Low?:If the number is going down through a period of time, there might be some problem between your company and customers.
2. Number of Complaints per Period
Quality Metrics / Customer Satisfaction / Brand Value / Quality / Cost
Description:Number of customer complaints due to poor quality services or products in a specific period of time.
3. Customer Retention Rate
Quality Metrics / Customer Satisfaction / Customer Value / Brand Value / Sales
Description:It is the percentage of loyal customers who keep using/purchasing your products in the end of the measured period of time out of customers counted at the beginning of that period of time. New customers are not counted into this metrics. This can help you understand your strategies for keeping your customers.
Calculation Method / Formula:(CE-CN)/CS where CE – number of all customers, CN – number of new customers acquired, CS – number of clients at the begining of the measured period
Should be High or Low?:If the number is going down, you may search for reasons and try to implement some changes. Low number might indicate some new competitor on the market or some new interesting offers that can attract clients.
4. Average Time to Solve
Quality Metrics / Customer Satisfaction / Brand Value / Work Effectiveness / Work Time Management
Description:It is the average time to solve a problem. It may vary depending on many factors, how serious the problem is, was it some continuous error on the production line, is the problem easy to fix etc. Count from the moment when the issue appeared till closing the ticket.
Should be High or Low?:Target depends on the sector and the possible problems. Target should be possible short. Long time of waiting may conclude with lower NPS and ARS.
5. Average Time to Respond
Quality Metrics / Customer Satisfaction / Brand Value / Work Efficiency / Work Time Management
Description:It is the metrics which indicates the average timing to respond a customer even if the problem persists.
Should be High or Low?:Usually target is set no longer than few hours, long time of waiting may conclude with lower NPS and ARS.
6. Cost of Poor Quality (COPQ)
Quality Metrics / Cost / Quality / Customer Satisfaction / Brand Value
Description:Summary of the costs for internal (scrap, rework, and re-inspection) and external failures (defects reach the customer, including adverse event reporting, warranty, corrections and removals, product liability and loss of brand reputation).
Should be High or Low?:Target depends on a sector, the smaller the better but close to zero is very unlikely, but growing number can give an important tip to increase budget for the COHQ.
7. Cost of High Quality (COHQ)
Quality Metrics / Cost / Quality / Customer Satisfaction / Brand Value
Description:Total cost of what you have spent to create conforming products. These costs are mainly Appraisal (inspection and testing, quality audits and calibration) and Prevention costs (statistical process control (SPC), quality planning and training). Estimated budget for COHQ should be based on COPQ, client satisfaction and trust that can later help grow the company.
Should be High or Low?:Budget should be estimated on possible return on investment, growing NPS and ARS.
8. Opportunity Estimation Metric
Quality Metrics / Investment / Quality / Brand Value / Financial Strategies
Description:Depends on impact of the quality improvement multiplied by probability of this impact. It can show which changes might be worth to implement and which not necessary.
Calculation Method / Formula:Impact [%] x It’s Probability
Should be High or Low?:A higher value shows the effectiveness of decision making.
9. Quality Team %
Quality Metrics / Employee Management / Investment / Quality
Description:It shows size (number of employees) of the quality department comparing to all the company.
Calculation Method / Formula:# of Q dept. employees / # of all employees
10. Average rating score (ARS)
Quality Metrics / Customer Satisfaction / Product / Customer Relationship / Brand Value
Description:Rating given by the end users who already/previously used your products or services and can give some real point of view on your products.
Should be High or Low?:If the number is going down through the months of tracking, either your quality is going down or there might me competitor on the market with better quality or much lower prices.
11. Cost of quality as % of annual revenues
Quality Metrics / Cost / Quality / Customer Satisfaction / Brand Value
Description:Percentage of total annual cost spent by Quality department to the total annual company costs.
12. Defects Per Million (DPM)
Quality Metrics / Cost / Quality / Budget Management
Description:Number of Defective parts among all total manufactured parts in every million. The biggest challenge is to be able to detect all the defective parts. Otherwise if your measurement is wrong it may affect really badly on the complaint number from the customer.
Calculation Method / Formula:Defective Parts/TotalParts) x 1.000.000
Should be High or Low?:Depending on the level of automatization, sector or complexity can be rated lower or higher. If the number grows there should be performed an investigation to find where the problem lies and taken some steps.
13. Scrap Rate
Quality Metrics / Cost / Quality / Improvement Management
Description:Scrap rate is the percentage of materials sent to production that never become part of finished products. This metrics allows to estimate materials supply needed.
Calculation Method / Formula:rate = Total Scrap / Total product
Should be High or Low?:If the budget for the COHQ to low the number of scrap can rapidly go up.
14. Yield / Efficiency
Quality Metrics / Cost / Quality / Improvement Management / Product / Inventory
Description:Yield is the percentage of the correctly manufactured goods (including the rework on the production line) to the total manufactured goods.
Calculation Method / Formula:Y = (I)(G) + (I)(1-G)(R)
I = planned production parts number
G = correct parts [%]
R = reworked parts available for sale [%]
Should be High or Low?:You can increase the ratio by investing in rework processes and increasing quality of equipment, providing trainings for employees
15. Throughout
Quality Metrics / Inventory / Work Efficiency / Profitability / Capacity
Description:Throughput is the quantity of goods that company produce over a given time period. It does not mean only the capability of the production but the production that is impacted by capacity and market/client demand.
Calculation Method / Formula:(Total Units/Processing Time) x (Processing Time/Total Time) x (Good Units/Total Units) or in a shorter way (Good Units/Total Time)
Should be High or Low?:Depends on the market or the client demand. If the number is higher than the demand it might mean there is too many people working, to many equipment for not big enough work target.
16. Capacity Utilization Rate
Quality Metrics / Time Management / Work Efficiency / Market Demand / Market Share
Description:Capacity Utilization Rate is the percentage of total output capacity used at any given point.
Calculation Method / Formula:(Throughout/Potential Output) x 100
Should be High or Low?:Dropping percentage may indicate problems on the line, machines downtime, some injuries or new unexperienced workers.
17. On-time delivery (OTD)
Quality Metrics / Customer Satisfaction / Cost / Transport / Delivery Management / Inventory Management
Description:This metrics is calculated as the percentage of units delivered on time out of all delivered units.
Calculation Method / Formula:The formula stands for (Delivered goods within OTD)/ (All delivered goods)
18. Perfect order metric (POM)
Quality Metrics / Operational Efficiency / Work Efficiency / Customer Satisfaction / Time Management
Description:The percentage of orders that arrive complete, on time, damage-free (reworked included) and with a correct invoice.
Calculation Method / Formula:The formula stands for POM = (%Complete) x (%On time) x (%Damage free) x (%Correctly invoiced).
Should be High or Low?:If the number goes much below 100, there should be estimated increase of total production. However, this can increase also costs a lot.
19. Average training hours per employee
Quality Metrics / Employee Satisfaction / Employee Management / Budget Management / Quality / Work Efficiency
Description:This metrics shows you the average training hour of an employee. Training may increase the quality and decrease in the future cost of fixing mistakes.
Calculation Method / Formula:You can calculate it as: (Total number of training hours) / Total number of employees
Should be High or Low?:Target should be estimated based on evidence and comparison between higher and lower qualified workers.
20. Manufacturing Cycle Time
Quality Metrics / Cost / Investment /Work Time Management / Work Efficiency / Equipment Efficiency
Description:This is the average time needed to product of one unit from beginning till the finish. It should not be misunderstood with lead time witch measures whole time step by step and makes a summary of all steps time. Cycle time is usually much shorter and depends on how good orchestrated manufacturing cells are.
Calculation Method / Formula: units production time / number of produced units
Should be High or Low?:Lowering the time depends on correctly analyzed and planned production steps. If number start to grow that may be caused by some unexpected issues or some production time outs.
21. Active defects
Quality Metrics / Customer Satisfaction / Brand Value / Quality / Cost
Description:Number of open defects. We include also fixed but waiting for re-test defects.
22. Rejected defects
Quality Metrics / Customer Satisfaction / Brand Value / Quality / Cost
Description:Rejected defects are the defects where the consumer states a problem, but the producer or developer did not detect that defect before delivering to the client. It is the comparison of undetected (rejected by client) to the total defects detected during production.
Calculation Method / Formula:The formula for weight of Rejected defects is (#Rejected Defects)/ #Total Defects.
Should be High or Low?:If the number is close to zero, the defected units can be fixed before going to client. Delivery of the defected parts can cost the company much more than increasing budget for the detection and prevention.
23. Defects Fixed Per Day
Quality Metrics / Customer Satisfaction / Brand Value / Quality / Cost
Description:This metrics indicates the average number of reworked units during working day or working shift. This number may depend on the rework team organization. If the defect can be fixed on the line or it has to go through the separate rework cell. Usually if there is a person or a team responsible for rework, they are trained to be able to jump from one to another production cell in case of needed support.
Should be High or Low?:The number depends on number of defects, but the manufacturing line should be organized in a way that the number of fixed defects is close to the number of occurred defects in a unit of time.
24. Severe Defects
Quality Metrics / Customer Satisfaction / Brand Value / Quality / Cost
Description:It measures percentage of critically defected goods to the total defects. Usually the critical are the units that cannot be reworked and going to the scrap.
Calculation Method / Formula:Critically defected goods / Total defects
25. Supplier Defect Rate
Quality Metrics / Customer Satisfaction / Brand Value / Quality / Cost
Description:This metrics indicates the percentage of materials from suppliers not meeting quality specifications.
Should be High or Low?:If the number of bad quality materials is growing it may be a hint for a supplier research. All the material rejections mean longer delivery time, longer time related to complaint documentation.
Below is the summary of Quality KPI metrics:
Most Important KPIs for Different Industries
Performance means different things for each industry or department. So, we collected the most significant KPIs for every industry out there. Learn more about them now!
Related Posts


