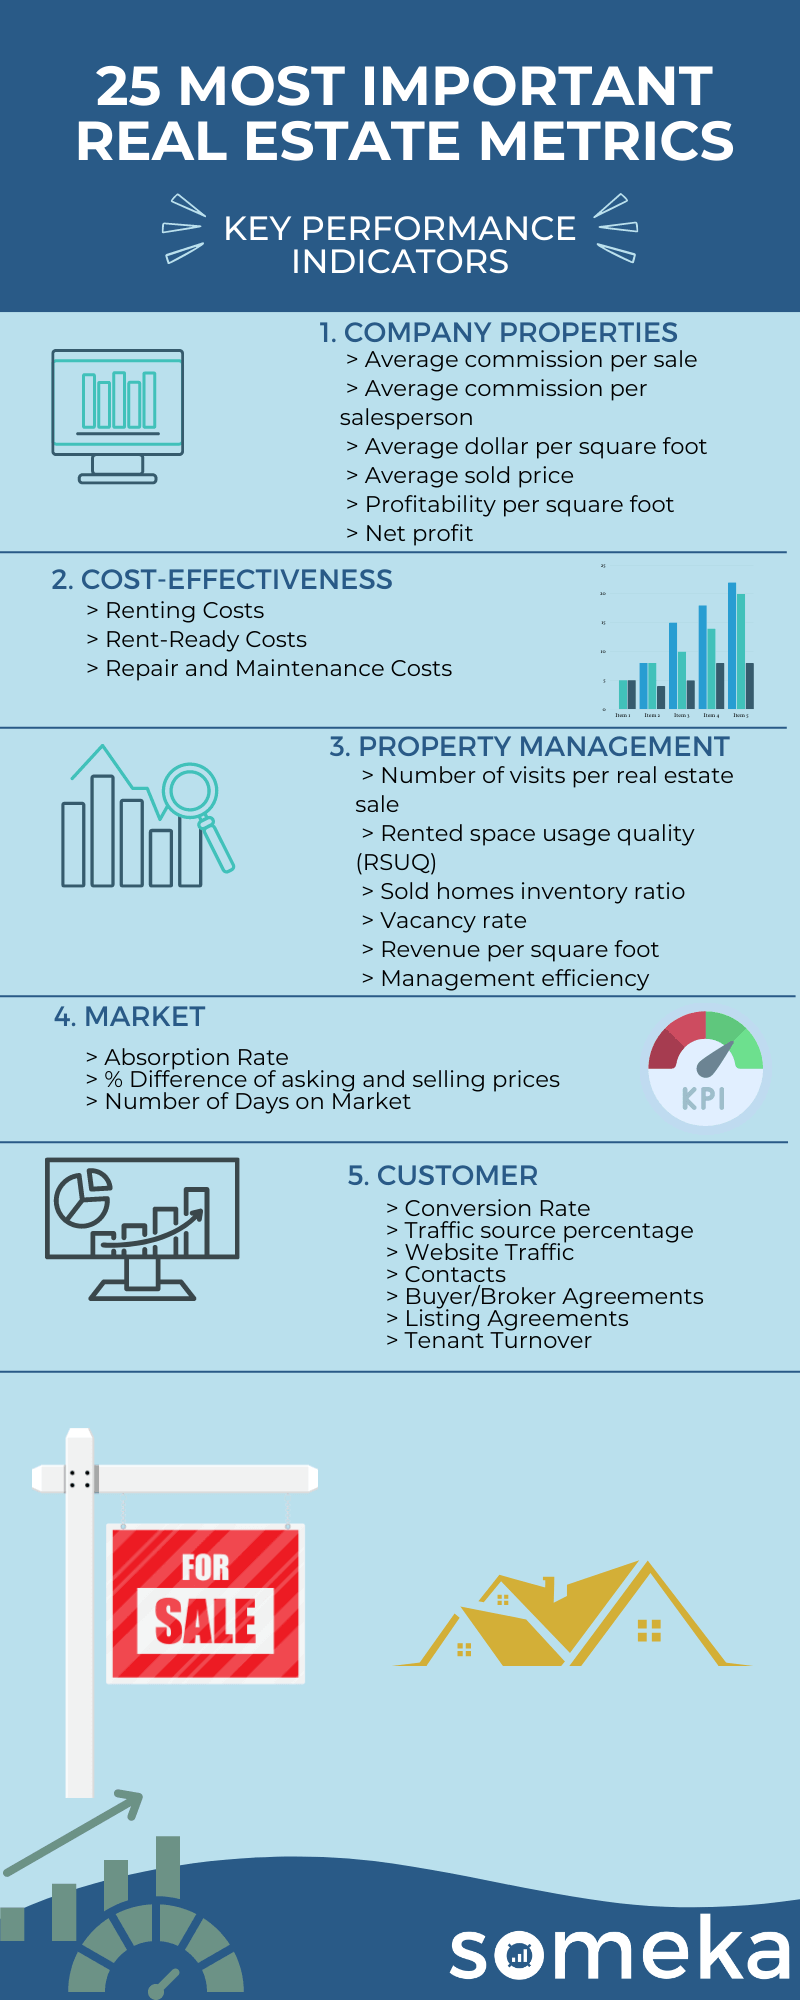
25 Most Important Real Estate KPIs & Metrics
Real Estate is a demanding and competitive industry and to get ahead, you need to track the overall state of your business. Of course, to do it correctly, learning the real estate KPIs and key metrics is a must.
In Someka, we are familiar with the real estate industry and we prepared Real Estate Dashboard templates for years. Here is our guide to the most used real estate key performance indicators. What are they and why are they important?
What is KPI in real estate?
A real estate KPI measures a critical aspect of your real estate business and it presents relative info about its overall conduct. It is also called a real estate key metric.
Why should you track real estate KPIs?
Measuring the performance of a real estate agency might be confusing because of so many different criteria that affect the state of the real estate agency. Therefore, applying real estate KPIs provides you with an easy way to track your real estate business’ operations. You can also use online forms to monitor your metrics.
What are the most important KPIs in real estate?
Real Estate KPIs are various and they should be chosen especially for your agency’s operations. You can select the right real estate metrics amongst the 25 most common real estate KPIs below.
Real Estate Metrics

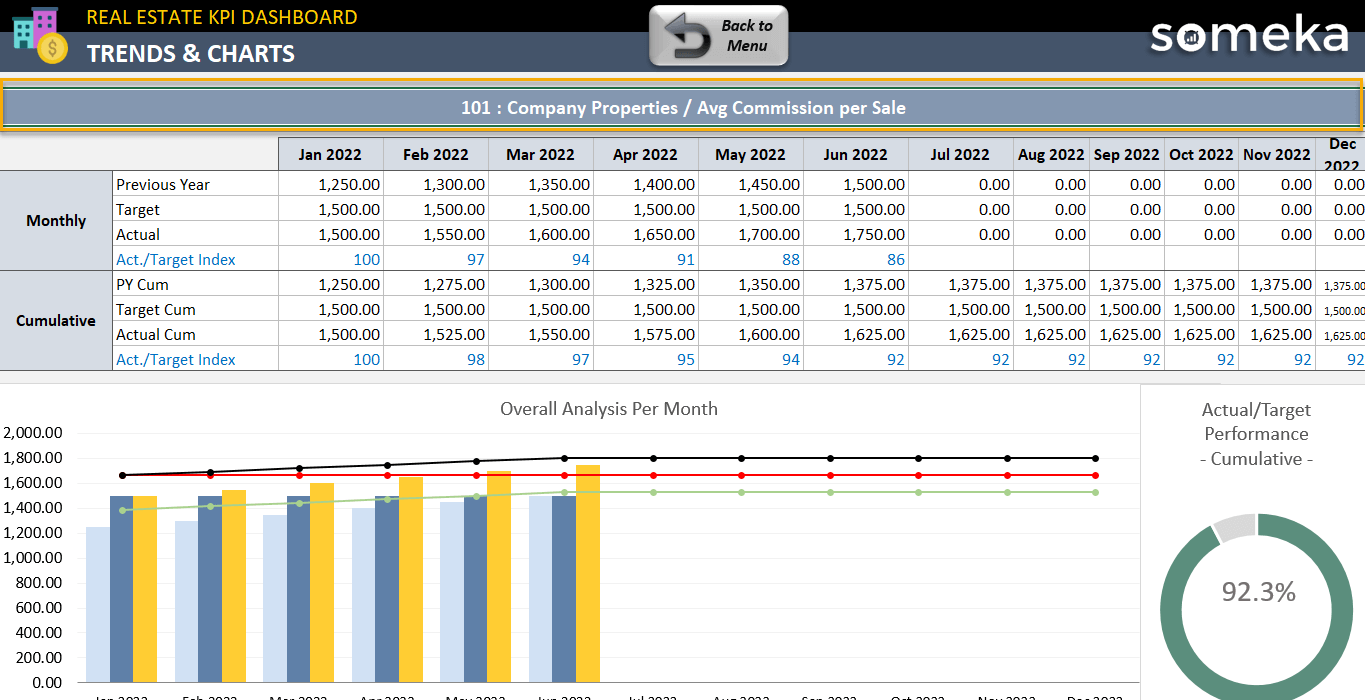
1. Average commission per sale
Real Estate Metrics / Revenue / Financial Strategies / Sales / Work Effectiveness
Description:How much money a real estate company earns on average for one transaction. It can depend on the client target and extra services in the offer. May depends on trust and interaction with the client. Built label and professional look of the office, agents and the website.
Calculation Method / Formula:The total commission in a month (or a other period of time) / # of all transaction Real Estate office launched in that given time.
Should be High or Low?:Commission depends on the market standards and built label of your company.
2. Average commission per salesperson
Real Estate Metrics / Revenue / Financial Strategies / Sales / Work Effectiveness
Description:This shows the average amount of money that each agent makes for all transactions during some given period of time. Most likely within a month. This may be depended on the qualifications of the agents and the marketing strategy.
Calculation Method / Formula:The total commission in a month (or a given time) / # of salespersons in the Real Estate office.
Should be High or Low?:If the numbers are going down it may be caused by some factors like a season or some new hired people without enough experience or some new competitors on the market.
3. Average dollar per square foot
Real Estate Metrics / Revenue / Market Demand / Work Effectiveness / Sales
Description:It shows the average price per square foot of the real estate properties. The numbers usually within a period should growth. If there are no sudden changes in the market this number should also show us how prices are changing month* by month* (*or period of time)
Should be High or Low?:This is more an informative number.
4. Average sold price
Real Estate Metrics / Revenue / Work Effectiveness / Market Demand
Description:That is the average sold home prices in a given period of time to understand direction of the market and how fast does it change.
Should be High or Low?:This is more an informative number.
5. Profitability per square foot
Real Estate Metrics / Revenue / Work Effectiveness / Market Demand / Profitability
Description:It is the average net profit per square foot. It can give a hint on more profitable direction and market targeting but also to give some idea for further calculations depended on the size of estates interest on the market, time taken to be sold.
Calculation Method / Formula:Net Profit (in a month or given time ) / sum of the square foot of the estates which you earned a profit.
Should be High or Low?:If it goes down it may suggest bigger # of sold small houses or other small properties.
6. Net profit
Real Estate Metrics / Revenue / Financial Performance / Profitability
Description:It is the total profit made at the end of the month. It is calculated as total income minus total costs including tax. It shows how profitable is your company month by month. Depend on the size of the company costs will not only grow but they might be quite complex to follow.
Calculation Method / Formula:Revenue – Total Expenses (taxes included)
Should be High or Low?:It may vary depending many factors, like time of the year, new competitors on the market etc. But in case dropping dangerously it may give a strong hint to study the reasons.
7. Renting Costs
Real Estate Metrics / Cost
Description:That is an average cost related to the renting process.
8. Rent-Ready Costs
Real Estate Metrics / Cost
Description:It is the average cost of a single property to get prepared for renting.
9. Repair and Maintenance Costs
Real Estate Metrics / Cost / Investment / Quality
Description:It is the average cost of the repair and maintenance of an estate for rent/rented.
10. Number of visits per real estate sale
Real Estate Metrics / Work Effectiveness / Market Demand / Sales
Description:This is the average number of times an agent shows the property to potential buyers before the property is being sold. This metrics shows an average, but it might have been divided by some category for example houses, locals, flats or experienced and new agents.
Should be High or Low?:If the number is growing the price of the estate might be overcalculated. However, if the number of visits is very close to 1 it might suggest increasing prices.
11. Rented space usage quality (RSUQ)
Real Estate Metrics / Work Effectiveness / Market Demand / Quality
Description:It shows an average interest by size of an estate it is a number of customers visits a day divided by size of the rented estate. The value can be calculated in 2 different ways 1* Average RSUQ OR 2* Weighted average RSUQ
Calculation Method / Formula:1) Total visits / Total square feet of the house visited
2) Visit % (House A) / Square foot (House A) + Visit % (House B)/ Square foot (House B) + …
Should be High or Low?:Here the target might be different. If the average number of visits is close to 1 the overall result will be very good, but it might also mean that the prices could be higher.
12. Sold homes inventory ratio
Real Estate Metrics / Revenue / Inventory Management / Budget / Assets / Business Performance
Description:This metrics tracks number of homes that were sold out of the total available estates in a given market. This can help track the market behavior and plan direction accordingly.
Calculation Method / Formula:# houses sold / Listed houses (or listed as for sale)
Should be High or Low?:Percentage of the sails may have a big impact on the future prices of the estates.
13. Vacancy rate
Real Estate Metrics / Work Effectiveness / Market Demand / Revenue / Sales / Marketing
Description:This metrics tracks number of estates that have been rented over total available renting units. This can help track the market behavior and redefine prices or strategies.
Calculation Method / Formula:#Houses rented / Listed houses (or listed as for renting).
Should be High or Low?:Percentage of the ranting may have a big impact on the future prices of renting.
14. Revenue per square foot
Real Estate Metrics / Revenue / Market Demand / Work Effectiveness / Sales
Description:It is the average net revenue amount you gain per square foot. It can help with estimating the property value. This metrics will show how does the market changes during years or between seasons.
Should be High or Low?:This is informative metrics that can help with better evaluation of prices.
15. Management efficiency
Real Estate Metrics / Revenue / Financial Strategies / Work Efficiency / Sales
Description:This metrics shows how efficient on average are your workers. It shows a number of sold/rent units in compare to number of hired people. It can show if more hired people increase the efficiency and higher number of people on which position may be better or worse.
Calculation Method / Formula:(The number of leased and/or sold houses) / number of staff.
Should be High or Low?:The higher number the better efficiency.
16. Absorption Rate
Real Estate Metrics / Work Effectiveness / Market Demand / Revenue / Sales / Marketing
Description:This metrics shows a market demand related to the portfolio of your agency.
Calculation Method / Formula:# of Houses your real estate office sold / # Total Houses available in the region you determine.
17. % Difference of asking and selling prices
Real Estate Metrics / Work Effectiveness / Market Demand / Revenue / Sales
Description:It is the % difference between intended and agreed sell price of the properties that the real estate agent sells. This may give an idea for example how big discount may lead to successful closing the deal.
Calculation Method / Formula:(Price (Ask) – Price (Sell)) / Price(Sell).
Should be High or Low?:There should be set some range between the house should be sold.
18. Number of Days on Market
Real Estate Metrics / Work Effectiveness / Market Demand / Sales
Description:This is the average number of days a property remains in inventory (from listing to closing). It may indicate an interest and current situation on the market but also price evaluation both too high and too low.
Should be High or Low?:Target should be set close to minimum. Or balanced between days and possible income.
19. Conversion Rate (visitor to action)
Real Estate Metrics / Sales / Marketing Effectiveness / Digital Marketing / Customer Value / Cost
Description:This metrics counts percentage of Number of successful sales or rents in compare to number of visits. This number in compare to how fast it was sold can be used as one of the parameters for the property evaluation.
Calculation Method / Formula:# of successful actions / # of total visits.
20. Traffic source percentage
Real Estate Metrics / Marketing Strategies / Advertising / Marketing Effectiveness
Description:It is the percentage of referrals over total visits on your website. You can see the value of online advertising in compare to just standard website search engine. Based on that budget for the advertising/referring can be decided.
Calculation Method / Formula:(# referrals/ # total visits to your website)
Should be High or Low?:Target depends on profit from the investment in digital marketing.
21. Web Visits / Website Traffic
Real Estate Metrics / Marketing Strategies / Advertising / Marketing Effectiveness
Description:It is the total number of web visits during given time/month
Should be High or Low?:Low number may suggest investment in some marketing.
22. Contacts
Real Estate Metrics / Customer Value / Sales / Work Effectiveness
Description:It is the number of customer or potential customer you are in contact every month.
Should be High or Low?:Low number may suggest investment in some marketing.
23. Buyer/Broker Agreements
Real Estate Metrics / Sales / Work Effectiveness / Quality / Cost
Description:The number of buyers who agreed to sing an exclusive contract with one of your agents. High number may indicate experienced agents and high ranking of your company among customers.
24. Listing Agreements
Real Estate Metrics / Customer Value / Sales / Work Effectiveness
Description:The number of contracts signed between your agents and potential sellers and/or renters
25. Tenant Turnover
Real Estate Metrics / Customer Satisfaction / Cost / Market Demand
Description:It stands for Tenants who have moved out during the month (or a given time) over the total number of units in the same given place.
Calculation Method / Formula:# of Tenants who have moved out / # of Total units
Should be High or Low?: To big number may cost owners bigger loss but as many real estators say that turnover may allow for sufficient increase of rent price.
Below is the summary of Real Estate KPI metrics:
Most Important KPIs for Different Industries
You can check our KPI articles with the most used KPIs for every industry, if you are looking for key metrics for other departments or sectors.
Related Posts


