20 Most Important Recruitment KPIs & Metrics
The HR departments and recruiters look for recruitment metrics to measure the performance of their hiring activities. So, we have collected all the necessary Recruitment KPIs and metrics for you!
But first, you can learn more about the Recruitment key metrics!
What is KPI in recruitment?
Recruitment KPIs or key performance indicators are used to determine the performance of hiring activities as a whole in businesses.
Why should you track Recruitment KPIs?
You should track recruit key metrics to have a clear point of view about the state of your hire and onboarding processes. That way, you can improve and advance your recruitment efforts and staff.
What are the most important KPIs in Recruitment?
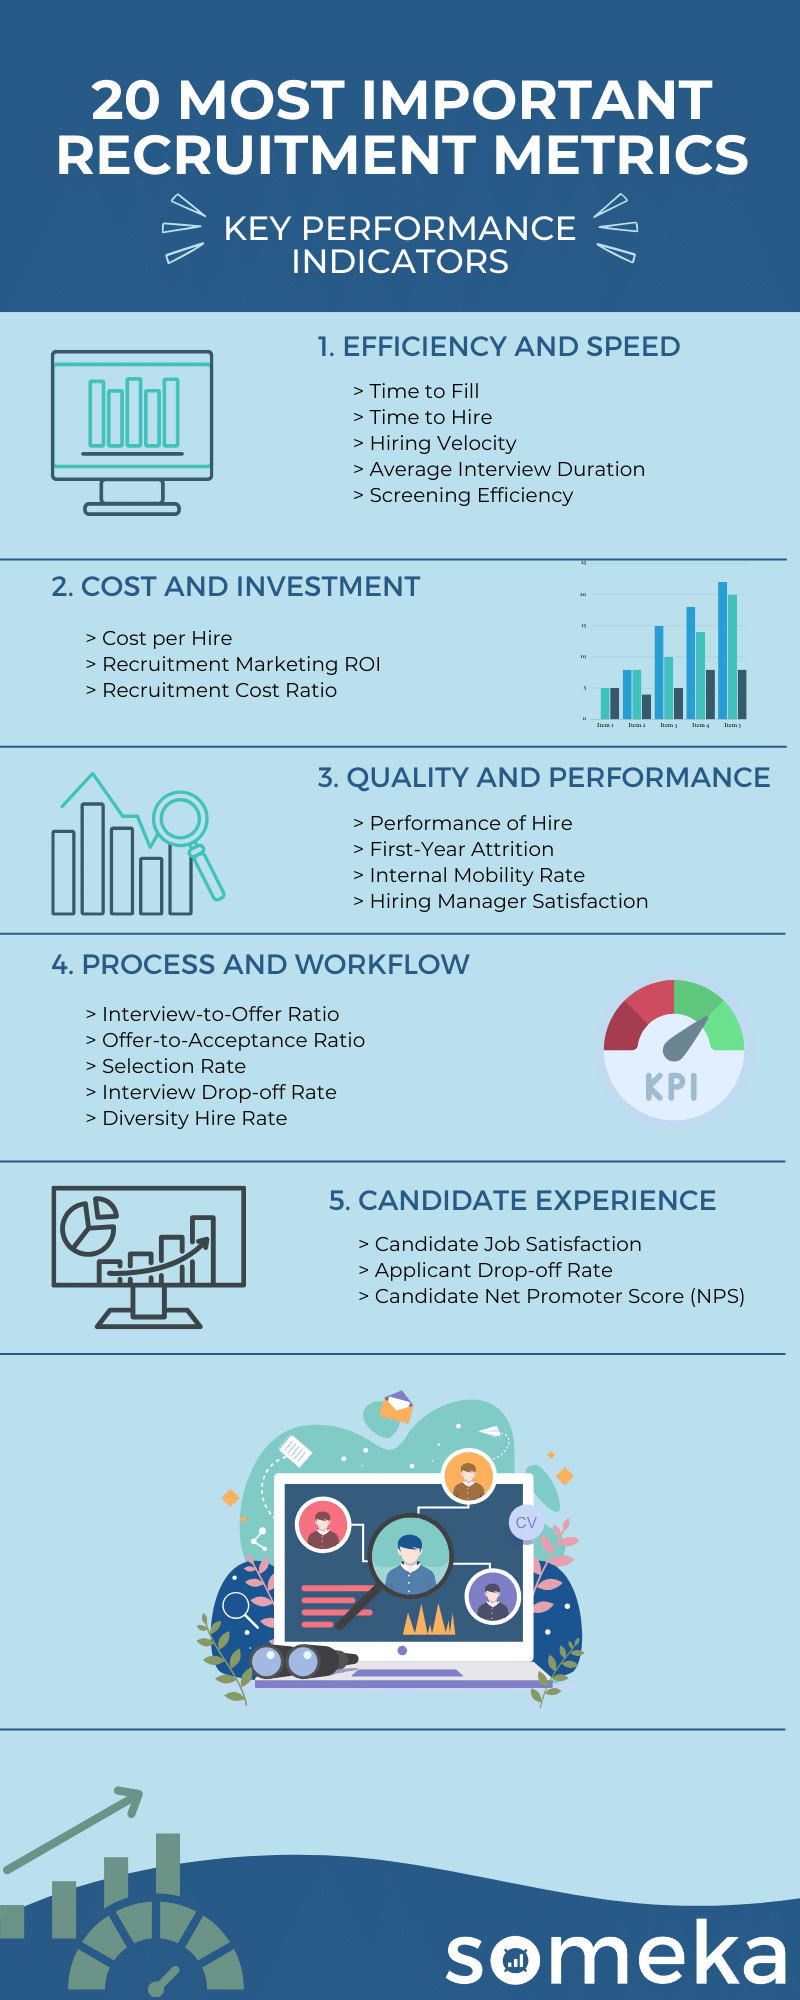
Recruiters deal with different issues in each other company, so there are various metrics you can use. However, you can see the top 20 Recruitment KPIs below to get a better idea.
Recruitment Metrics
1. Time to Fill
Recruitment Metrics / Efficiency and Speed / Timing
Description:Measures the average number of days it takes from a job requisition to acceptance of the job offer..
Calculation Method / Formula:Subtract the date when the job requisition was opened from the date the offer was accepted.
Should be High or Low?: The lower the better. Otherwise it will take too much time to fill vacancies.
2. Time to Hire
Recruitment Metrics / Efficiency and Speed / Timing
Description:This shows the time it takes from when a candidate applies or is sourced to when they accept the job offer.
Calculation Method / Formula:Subtract the date the candidate entered the pipeline (applied or was sourced) from the date the candidate accepted the job offer.
Should be High or Low?: If it’s increasing, it means that your hiring process is too long.
3. Hiring Velocity
Recruitment Metrics / Efficiency and Speed / Recruitment KPIs for Timing
Description:The speed at which positions are filled; calculated by dividing the total number of open positions by the number of positions filled in a specific period.
Calculation Method / Formula:Calculate the number of positions filled in a certain period and divide by the number of days in that period.
Should be High or Low?:If the % is going up it may indicate a slow pace hiring process.
4. Average Interview Duration
Recruitment Metrics / Efficiency and Speed / Time Management
Description:The average length of time interviews last; calculated by dividing the total duration of all interviews by the number of interviews conducted.
Calculation Method / Formula:Add up the total time spent on interviews for a position and divide by the number of interviews conducted.
Should be High or Low?:If the average interview duration is too long, this may be a waste of time. And if it’s too short, this may also signmal ineffective screening.
5. Screening Efficiency
Recruitment Metrics / Efficiency and Speed / Time Management
Description:The effectiveness of pre-interview screening in identifying qualified candidates; calculated by the percentage of screened candidates who are invited for interviews.
Calculation Method / Formula:This can be the ratio of candidates who passed the initial screening to those who entered the screening phase or the percentage of screened candidates who make it to the interview stage.
Should be High or Low?:If the percentage goes down, this means your screening process needs improvement.
6. Cost per Hire
Recruitment Metrics / Cost and Investment / Expenses
Description:The total costs associated with hiring a new employee divided by the number of hires; includes advertising fees, recruiter fees, and other recruitment expenses.
Calculation Method / Formula:Add up all the costs associated with hiring (advertising, recruiter fees, referral bonuses, etc.) and divide by the total number of hires.
Should be High or Low?:You should keep your hiring costs at minimum without compromising on recruitment quality.
7. Recruitment Marketing ROI
Recruitment Metrics / Cost and Investment / Expenses
Description:The return on investment for recruitment marketing efforts; calculated by dividing the value of hires from marketing sources by the cost of those marketing efforts.
Calculation Method / Formula:Subtract the cost of recruitment marketing from the value of hires attributed to marketing, then divide by the cost of recruitment marketing.
8. Recruitment Cost Ratio
Recruitment Metrics / Cost and Investment / Recruitment KPIs in Costs
Description:The cost of recruitment activities as a percentage of the total compensation of
Calculation Method / Formula:Divide the total cost of recruitment by the total starting compensation of new hires in a specific time frame, and multiply by 100 to get a percentage.
Should be High or Low?:You should find the balance between your total recruitment costs and employee compensations.
9. Performance of Hire
Recruitment Metrics / Quality and Performance / Performance
Description:Shows the evaluation of new hires based on performance criteria (like reviews or sales numbers) and compare against the performance of established employees or a predetermined benchmark.
Calculation Method / Formula:You can use performance review scores.
Should be High or Low?:You should get the most performance of your new hires.
10. First-Year Attrition
Recruitment Metrics / Quality and Performance / Retention
Description:It shows the percentage of new hires who leave the company within their first year.
Calculation Method / Formula:Divide the number of employees who leave within their first year by the total number of hires in that year.
Should be High or Low?:The first year attritions make your hiring and orientation efforts useless. So, you should keep this percentage low.
11. Internal Mobility Rate
Recruitment Metrics / Quality and Performance / Retention
Description:It shows the percentage of positions filled by internal candidates.
Calculation Method / Formula:Divide the number of positions filled internally by the total number of positions filled in a given period.
Should be High or Low?:Increased internal mobility will fill your open positions in a more cost-effective manner.
12. Hiring Manager Satisfaction
Recruitment Metrics / Quality and Performance / Hiring Quality
Description:The level of satisfaction hiring managers have with the recruitment process; typically measured through surveys and calculated as an average score.
Calculation Method / Formula:Usually assessed via a survey on a scale (e.g., 1-5), then calculate the average score.
Should be High or Low?: These scores will be better to be high for an effective recruitment process.
13. Interview-to-Offer Ratio
Recruitment Metrics / Process and Workflow / Results
Description:The average number of interviews conducted before making a job offer; calculated by dividing the total number of interviews by the total number of offers made.
Calculation Method / Formula:Divide the number of interviews conducted by the number of job offers made.
Should be High or Low?:A lower ratio will indicate most of non-resulting interviews.
14. Offer-to-Acceptance Ratio
Recruitment Metrics / Process and Workflow / Results
Description:It helps to track the ratio of accepted offers to the total offers made.
Calculation Method / Formula:Divide the number of accepted job offers by the total number of job offers made.
Should be High or Low?:A maximized ratio shows that you’re in line with candidates accepting your offers.
15. Selection Rate
Recruitment Metrics / Process and Workflow / Results
Description:It shows how many of the applied candidates are hired.
alculation Method / Formula:Divide the number of hires by the total number of applicants.
Should be High or Low?:It’s better to have a higher selection rate. This will show the quality of your candidate pool.
16. Interview Drop-off Rate
Recruitment Metrics / Process and Workflow / Process Results
Description:This metrics shows the percentage of candidates who are interviewed but do not receive an offer.
Calculation Method / Formula:Divide the number of candidates who were interviewed but did not receive an offer by the total number of interviewed candidates.
Should be High or Low?:If the % is much higher than the targeted rates, then it shows that too many of the interviewed candidates can not pass to the offer stage.
17. Diversity Hire Rate
Recruitment Metrics / Process and Workflow / Ethics
Description:It indicates the percentage of hires from underrepresented groups.
Calculation Method / Formula:Divide the number of hires from underrepresented groups by the total number of hires.
Should be High or Low?:Target depends on the sector, corporate culture and demographic data.
18. Candidate Satisfaction
Recruitment Metrics / Candidate Experience / Satisfaction
Description:It assesses how satisfied candidates are with the recruitment process; usually measured through surveys and calculated as an average score.
Calculation Method / Formula:Typically measured through surveys post-hire, and can be calculated as the average of these survey scores.
Should be High or Low?:It will show you the general satisfaction level of your candidates.
19. Applicant Drop-off Rate
Recruitment Metrics / Candidate Experience / Satisfaction
Description:This metrics shows the percentage of candidates who start but do not complete the application process.
Calculation Method / Formula:Divide the number of applicants who start the application process but do not complete it by the total number of applicants who began the process.
Should be High or Low?:If this rate is higher than expected, this shows that some candidates are leaving your process earlier.
20. Candidate Net Promoter Score (NPS)
Recruitment Metrics / Candidate Experience / Satisfaction
Description:This metrics measures candidate willingness to recommend the company’s recruitment process to others; calculated based on responses to the NPS survey question.
Calculation Method / Formula:Subtract the percentage of detractors (candidates who would not recommend the company) from the percentage of promoters (candidates who would recommend the company)
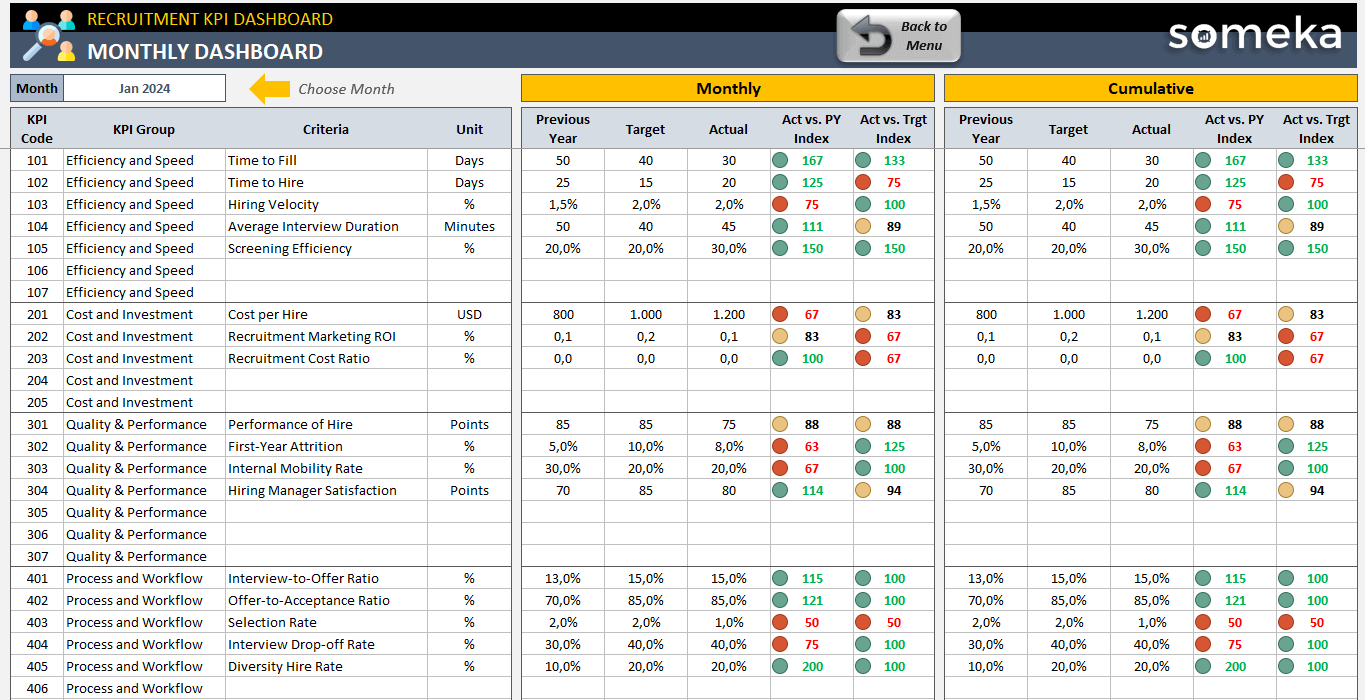
Below is the summary of Recruitment KPIs and performance metrics:
Most Important KPIs for Different Industries
If you are interested in other industries or departments and their performance, you should learn more about their KPIs via our related articles!
Related Posts


