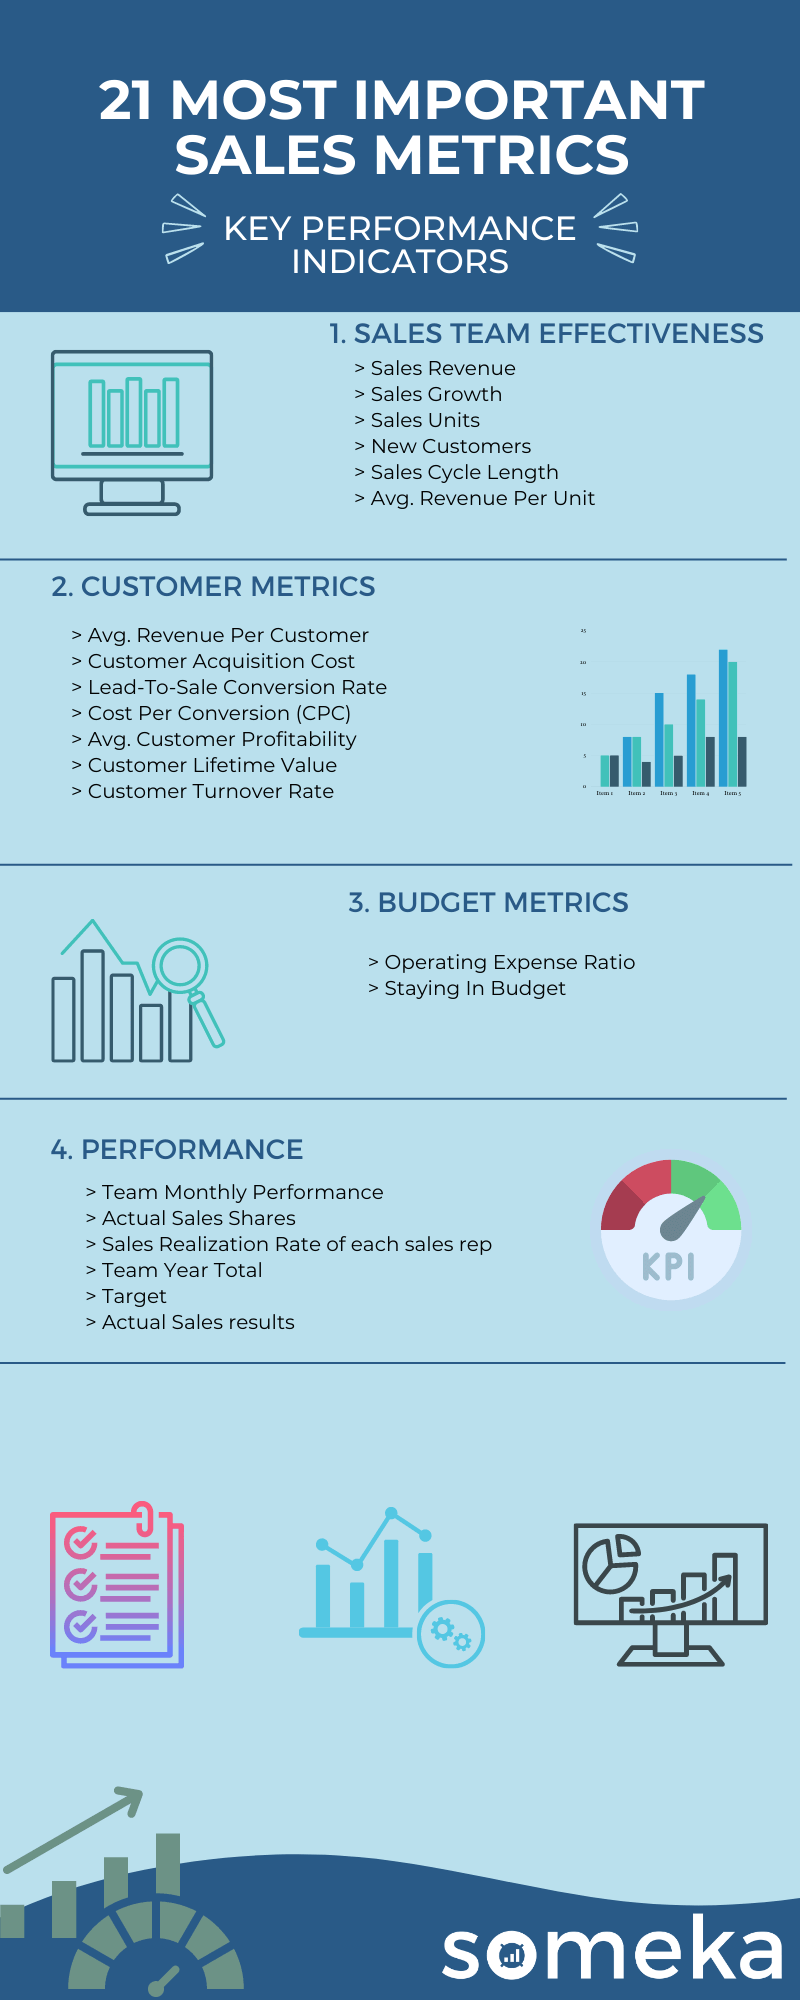
21 Most Important Sales KPIs & Metrics
Sales can be called the core element of any for-profit business. So, it is essential to track your sales team’s performance or the overall situation of leads and sales. Sales KPIs (key performance indicators) are metrics that are used exactly for those purposes to determine the state of a company.
In Someka, we’ve been developing Sales Dashboard templates for years, and now, for our readers, we gathered the essential Sales KPIs you should track and the basics of key metrics.
What is KPI in sales?
Organizations use sales KPIs (key performance indicators) to test and see whether their sales departments or projects go well according to the projections or not.
Why should you track sales KPIs?
Sales performance is one of the most critical aspects of any for-profit organization. Sales numbers indicate the overall success and growth of the companies. So, you should track sales KPIs frequently if you want to see whether your company is growing or stagnant.
What are the most important KPIs in sales?
Sales KPIs are various and your company or organization may need a specific sales or marketing metric that is not common. For the most used sales KPIs, you should read more!
Sales Metrics
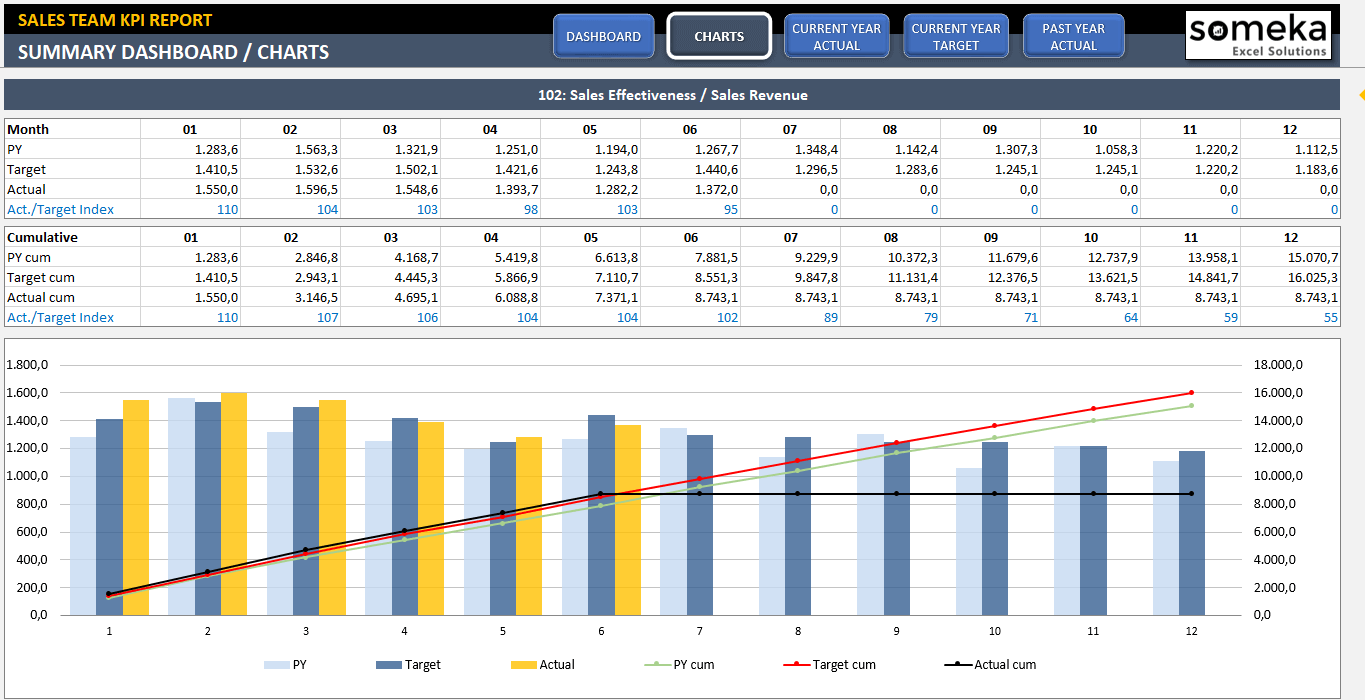
1. Sales Revenue
Sales Metrics / Work Efficiency / Financial Performance / Revenue / Profitability / Sales
Description:Total value of all goods or services sold. You should not include any returns or allowances. It is main share of the revenue.
Calculation Method / Formula:Sales price * number of units sold
Should be High or Low?:If the value drops you may have look closer on your investments, marketing and budget planning.
2. Sales Units
Sales Metrics / Revenue / Financial Strategies / Sales / Work Effectiveness
Description:Sales Units – total number of sold units in a period of time.
Calculation Method / Formula:Total number of sold units
3. Sales Growth
Sales Metrics / Revenue / Financial Strategies / Sales / Work Effectiveness / Marketing Strategies
Description:It measures effectiveness of your sales team. If and how much they can influence the growth of income through some period of time. To measure it you need to compare your sales value between some given periods of time.
Calculation Method / Formula:(sales revenue from current month – sales revenue from previous month) / sales revenue from previous month
Should be High or Low?:If your company is growing the number will most likely be fairly higher. Later on, the target will depend if your company is releasing new products or how is your brand value placed on the market among the other companies.
4. New Customers
Sales Metrics / Customer Satisfaction / Brand Value / Market Share / Sales / Marketing Effectiveness
Description:You can measure total number of your customers and how it is changing through the time.
Should be High or Low?:The number should grow within a time, but how fast it grows all depends on effectiveness of marketing strategies and the market demand.
5. Sales Cycle Length (SCL)
Sales Metrics / Customer Relationship / Sales / Work Effectiveness / Performance
Description:The most used way to monitor sales cycle is to start from the client’s entering till an end when the sale is closed. That metrics depends on your offer and client target. Times will vary depending on number of items your client is going to buy. If you are selling electronic, clients need to get first all technical questions answered, in case of cloths you need to take into account time for try on etc.
Should be High or Low?:If sales cycle length is growing by time, you may think about your sales strategies or try to understand what a cause can be. Maybe if your inventory grew much then your customers also take more time for decision process or maybe there are some problems with your sales manpower.
6. Avg. Revenue Per Unit (ARPU)
Sales Metrics / Financial Performance / Revenue / Profitability / Customer Value / Sales
Description:Average Revenue per User also known as Average Revenue per Unit. Average revenue generated by an average subscriber per month (or year). You can estimate how much a single user is worth for you and decide what kind of advertising or marketing strategies are worth to invest in.
Calculation Method / Formula: Divide the total revenue by the number of subscribers.
Should be High or Low?:This number depends on your offer prices. If your products are fairly not expensive you probably have to think more about reaching more customers and try to keep them with your competitive price offers. But in that case, it may be not worth to invest in pay-per-click advertisement method.
7. Avg. Revenue Per Customer (ARPC)
Sales Metrics / Financial Performance / Revenue / Profitability / Customer Value / Sales
Description:Average Revenue per Customer (similar to APRU). Average revenue generated by an average customer per month (or year). You can estimate how much a single customer is worth for you and decide what kind of advertising or marketing strategies are worth to invest in.
Calculation Method / Formula: Divide the total revenue by the number of customers.
Should be High or Low?:This number depends on your offer prices. If your products are fairly not expensive you probably have to think more about reaching more customers and try to keep them with your competitive price offers. But in that case, it may be not worth to invest in pay-per-click advertisement method.
8. Customer Acquisition Cost (CAC)
Sales Metrics / Marketing / Costs / Sales / Customer Value
Description:It is a total cost of advertising to convince a potential customer to buy your product or service. It may show you how good is your marketing strategy. The target of any marketing should be gaining as much as possible new customers not just visitors without real value. You have to remember to include in the expense’s salaries, costs of software, equipment, rent etc. Conversion is very often mix with acquisition of a client it is important to know the difference, acquisition means gaining a potential client that starts a subscription but he haven’t spent money yet while conversion counts only customers who spent already money on your product or services.
Calculation Method / Formula:(Total Marketing + Sales Expenses) / number of New Customers Gained
Should be High or Low?:It is related to your campaign and marketing strategies. You should choose it according to your target based on a value of an average customer.
9. Lead-To-Sale Conversion Rate
Sales Metrics / Sales / Marketing Effectiveness / Digital Marketing / Customer Value / Cost
Description:This is a ratio between total number of leads and number of customers coming from the given group of leads. It shows how many of them actually bought some of your products. The target is to have this ratio fairly high but even if conversion rate is not very high, but the number of leads is growing your total sales will grow as well.
Calculation Method / Formula:number of new customers / total number of all leads
Should be High or Low?:You may check how your strategies or product improvement influence on the conversion rate and based on that choose some directions in growing your company.
10. Cost Per Conversion (CPC)
Sales Metrics / Sales / Marketing Effectiveness / Digital Marketing / Customer Value / Cost
Description:Since acquiring leads and customers through cost-per-click advertising is usually expensive, it is very important to compare it with ROI. If number of your new prospects is much higher than the acquired customers, the actual profitability of paid campaigns may drop to very low results. Conversion is very often mix with acquisition of a client it is important to know the difference,
Calculation Method / Formula:Average toal cost to gain a new customer
Should be High or Low?:If the cost is growing most likely you have a lot of visits of new potential prospects, but the conversion rate is going down.
11. Avg. Customer Profitability (CPV)
Sales Metrics / Financial Performance / Revenue / Profitability / Customer Value / Sales
Description:Total revenue coming from the customers compared with the cost related to this income measured in given period of time. It is very similar metrics to Customer lifetime value. The main difference is that in CLV we take into calculation all the money spent now and in the future for example due to active subscription by the customer while the customer profitability is based on the sales current and previous only. However, most of the time it is calculated exactly the same as CLV
Calculation Method / Formula:revenue earned (in period of time) – costs related to the customer relationship (in the same period of time)
Should be High or Low?: To keep this metrics on a proper level you should be tracking sales teamwork and adjust the number or employees to actual demand. If there are not enough employees your real costs may increase due to the bad customer experience etc. However, overemployment may also cause your company unnecessary extra expenses.
12. Customer Lifetime Value – LTV
Sales Metrics / Financial Performance / Revenue / Customer Value / Sales
Description:Estimate value of the net profit coming from the entire future relationship with a client. It is the total amount of profit that average client is likely to spend over the time while being a client (Customer lifespan).
Calculation Method / Formula:one of the ways to measure LTV is:
Average value of sale * number of transactions * Retention time * profit margin
Should be High or Low?:Lower or higher number depends on type of your products or services. You can set some target and with correct investments in development and marketing strategies you can try to increase that number.
13. Customer Turnover Rate
Sales Metrics / Customer Satisfaction / Market Demand / Cost
Description:Also called the attrition rate. It is a percentage of churned customers out of all customers connected either by some contract or subscription for services or products in some period of time (in a month). The main reason usually for the attrition of the customer is poor customer experience or slow service performance.
Should be High or Low?:To decrease the percentage and increase the customer satisfaction you may consider develop tactics how to value your customers and how to build a relationship with the customer.
14. Sales Budget Ratio / Operating Expense Ratio (OER)
Sales Metrics / Budget Management / Revenue / Sales / Business Performance / Work Efficiency
Description:It’s important to understand your operational effectiveness by tracking the operating expense ratio. It is related to daily company’s core operations. The lower those expenses are, the higher profit is made. operating revenue and operating expenses are related to your company’s main activity
Calculation Method / Formula: Sales Expenses/ Revenue
Should be High or Low?:You can track changes and estimate possible outcomes on operating improvements.
15. Staying In Budget
Sales Metrics / Budget Management / Planning Effectiveness / Cost / Savings
Description:How many projects out of total were delivered within set budget. It can give a projection on the further estimations. Projects overestimated are calculated as on budget, which can give a little false output value. If calculated just for one project it will just give the idea of percentage how accurate was the budget estimation in compare to reality.
Should be High or Low?:If the number is much below 100, it is also good to calculate % of projects with overestimated budget. That can give some lead for mistakes in estimation process itself.
16. Team Monthly Performance
Sales Performance Metrics / Revenue / Financial Performance / Profitability / Sales / Work Efficiency
Description:There is plenty of metrics showing team performance like revenue or margin profit.
17. Actual Sales Shares
Sales Performance Metrics / Revenue / Financial Strategies / Sales / Work Effectiveness / Market Share
Description:Actual ratio of sales according to the target realization performance of sales team
18. Sales Realization Rate of each sales rep
Sales Performance Metrics / Financial Performance / Revenue / Sales / Profitability / Work Effectiveness
Description:Sales realization is a percentage of actually sold goods where seller received payment out of total sales together with the one where the payment wasn’t successfully finished
Calculation Method / Formula:number of recieved payments / number of total sold products (or services)
Should be High or Low?:In case of dropping number, you may check if there is no problem with payment methods or there are some misunderstandings that leads customer to withrow or not pay the money.
19. Team Year Total
Sales Performance Metrics / Work Efficiency / Financial Performance / Revenue / Profitability / Sales
Description:Total yearly sales revenue.
20. Target
Sales Performance Metrics / Work Efficiency / Financial Performance / Revenue / Profitability / Sales
Description:Target can be set for example as a sales target per salesman.
Calculation Method / Formula:Team Yeat Total / number of salesmen
21. Actual Sales results
Sales Performance Metrics / Work Efficiency / Financial Performance / Revenue / Profitability / Sales
Description:Total value of all goods or services sold. You should not include any returns or allowances.
Calculation Method / Formula:Sales price * number of units sold
Should be High or Low?:If the value drops you may have look closer on your investments, marketing and budget planning.
Below is the summary of Sales KPI metrics:
Most Important KPIs for Different Industries
Success doesn’t look the same for every industry. Therefore, there are various KPIs applicable to different industries. We collected the most common KPIs for every industry, check them out!
Related Posts


