27 Most Important Supply Chain KPIs & Metrics
Supply chain systems are complex and they might be confusing to analyze to develop better supply chain management. That’s why tracking Supply chain KPIs is utterly important. But what are the supply chain metrics you need to track?
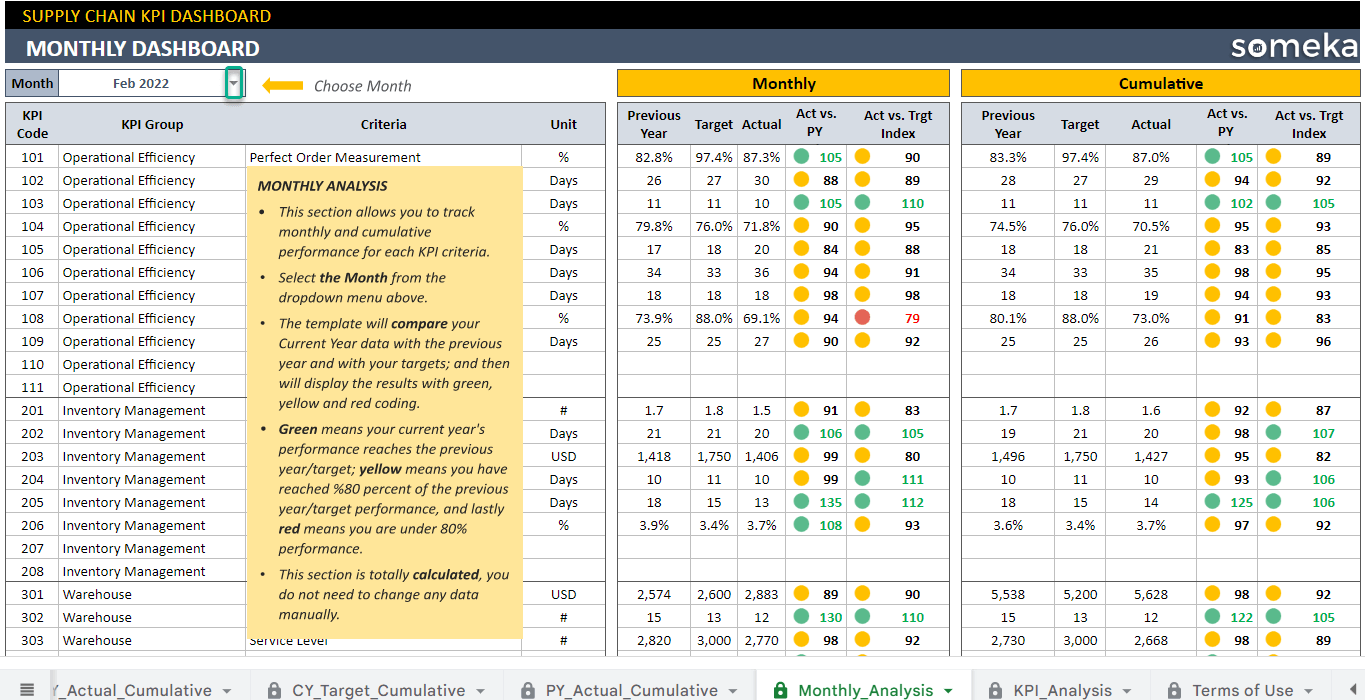
We, as Someka, created many successful Supply Chain Dashboard Templates. With the knowledge that came from this experience, we have written the list of the most used supply chain KPIs you should measure. Let’s start from the basics!
What is kpi in supply chain?
In general, KPI stands for Key Performance Indicator. A supply chain kpi is a well-defined and measurable metric to track in order to improve the quality of logistics related services. For supply chain, there are many metrics you should analyse and optimize to improve the processes.
Why should you track supply chain kpis?
Supply chain is a very demanding area and delivery related processes should be improved on a daily basis. That’s why you should be tracking and improving the most important supply chain kpis regularly.
What are most important kpis in supply chain?
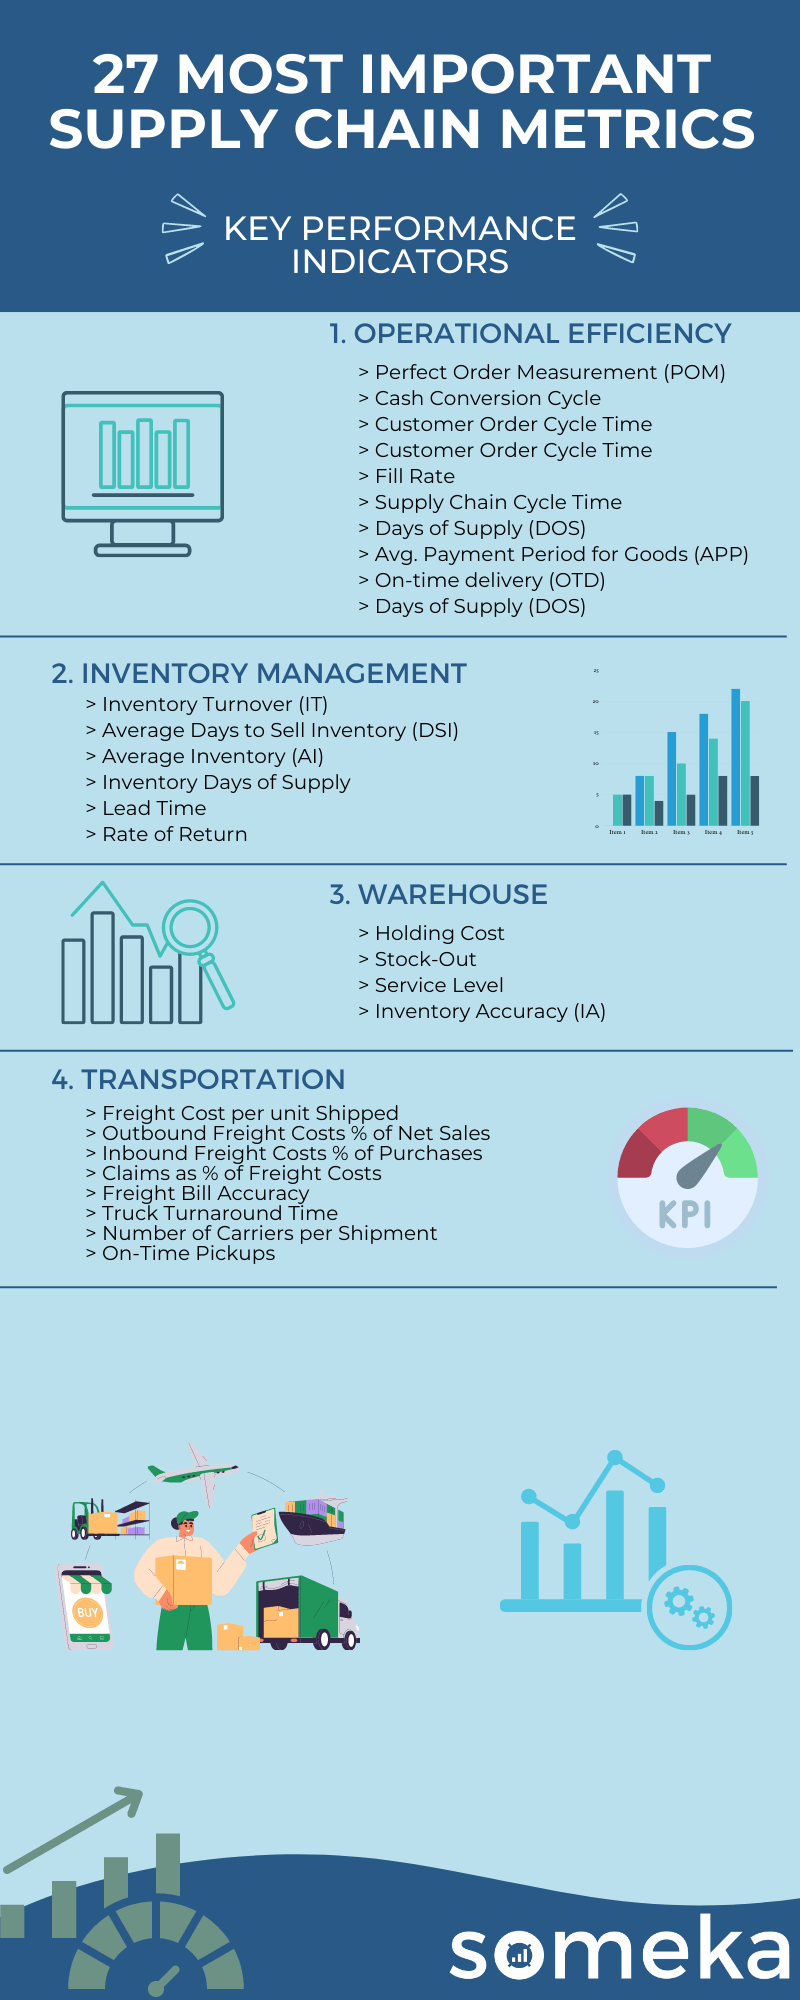
There are lots of metrics and key performance indicators for supply chain. So, choosing the right ones to focus on is critical. During our consulting studies in years, we’ve dealt with hundreds of different supply chain kpis. Then we’ve worked on the data, eleminated and consolidated the metrics and listed down the 27 most used supply chain kpis to track.
Supply Chain & Logistics Metrics
1. Perfect Order Measurement (POM)
Supply Chain & Logistics Metrics / Operational Efficiency / Work Efficiency / Customer Satisfaction / Time Management
Description:The percentage of orders that arrive complete, on time, damage-free (reworked included) and with a correct invoice.
Calculation Method / Formula:The formula stands for POM = (%Complete) x (%On time) x (%Damage free) x (%Correctly invoiced).
Should be High or Low?:If the number goes much below 100, there should be estimated increase of total production. However, this can increase also costs a lot.
2. Cash to Cash Cycle Time / Cash Conversion Cycle (CCC)
Supply Chain & Logistics Metrics / Operational Efficiency / Financial Performance / Revenue / Profitability
Description:It measures time needed to convert company investments into inventory and sales into cash.
Calculation Method / Formula:Sales Days + Inventory Days – Payable Days
Should be High or Low?:This metrics can allow you to manage your inventory and track your company development through the time.
3. Customer Order Cycle Time
Supply Chain & Logistics Metrics / Customer Satisfaction / Cost / Transport / Delivery Management / Inventory
Description:The average time that takes to fulfill the purchase order. Counting time starts from receiving PO and end after successful delivery where delivered goods match the purchase order.
Should be High or Low?:This metrics is very important for building good relationship with customers and it is important to always work to improve that metrics.
4. Fill Rate
Supply Chain & Logistics Metrics / Customer Satisfaction / Cost / Transport / Delivery Management / Inventory Management
Description:It is a percentage of goods immediately available from the stock or production line while the purchase order arrives out of all purchase orders.
Should be High or Low?:If the ratio goes down, you should work on your market demand projections. This metrics is important for building your brand. If your rate will be dropping, you may lose some of your current or potential customers.
5. Supply Chain Cycle Time
Supply Chain & Logistics Metrics / Customer Satisfaction / Cost / Transport / Delivery Management / Inventory
Description:It measures average total customer order cycle time but assuming your stock is empty, and you need to include all the time needed to order and receive parts/products from your supplier/s.
Should be High or Low?:You should be aware of that time depending on the supplier you are working with and be sure the timing is reliable.
6. Days Sales Outstanding / Days of Supply (DOS)
Supply Chain & Logistics Metrics / X
Description:Inventory Days of Supply Explanation
7. Avg. Payment Period for Goods (APP)
Supply Chain & Logistics Metrics / Assets / Inventory Management / Sales / Business Management
Description:Average payment period is the average amount of days that company needs to pay off money owed by a company to its creditors. Average account payable is a status between beginning and end of the calculated period (usually one year).
Calculation Method / Formula:average accounts payable / (Total credit purchaices / number of days in a year)
Should be High or Low?:If the average number is growing it may have negative effect on the credit value. If the time is growing there might me some extra interest to pay back.
8. On Time Shipping Rate / On-time delivery (OTD)
Supply Chain & Logistics Metrics / Customer Satisfaction / Cost / Transport / Delivery Management / Inventory Management
Description:How many projects out of total were delivered on time. It can give a projection on the further estimations. Projects overestimated are calculated as on time, which can give a little false output value. If calculated just for one project it will just give the idea of percentage how fast project was completed in compare to the estimation.
Calculation Method / Formula:number of projects completed / number of sheduled projects to be completed
Should be High or Low?:If the number is much below 100, it is also good to calculate % of projects with overestimated time. That can give some lead for mistakes in estimation process itself.
9. Days of Supply (DOS)
Supply Chain & Logistics Metrics / X
Description:Inventory Days of Supply Explanation
10. Inventory Turnover (IT)
Supply Chain & Logistics Metrics / Revenue / Inventory Management / Budget / Assets / Business Performance
Description:Also known as stock turn and shows how many times (or how big part of) the average inventory is sold per month. It is a bad idea to have higher inventory value than the monthly sales value.
Calculation Method / Formula:Cost of goods sold / average stock value.
Should be High or Low?:The lower is the ratio the higher are costs of storage/warehouse.
11. Average Days to Sell Inventory (DSI)
Supply Chain & Logistics Metrics / X
Description:Inventory Days of Supply Explanation
12. Average Inventory (AI)
Supply Chain & Logistics Metrics / Revenue / Inventory Management / Budget / Assets / Business Performance
Description:It is an average of beginning and ending inventory balance. Together with sell-through rate you can measure your warehouse’s effectiveness and take some valuable steps in your inventory maintenance strategies.
Calculation Method / Formula: (Current month inventory + Previous month inventory) /2.
Should be High or Low?:If the number is high together with high sell-through you are on a good direction. But there is no point to keep high inventory if your sell-through goes low.
13. Inventory Days of Supply
Supply Chain & Logistics Metrics / X
Description:Inventory Days of Supply Explanation
14. Lead Time
Supply Chain & Logistics Metrics / Work Efficiency / Work Time Management / Sales / Inventory Management
Description:Unlike cycle time it measures whole time step by step and makes a summary of all steps time. So as a conclusion that is a maximum time that it takes to full fill the purchase order.
Should be High or Low?:It is important to keep it stable and make sure in case of trouble with one of the steps of the line to fulfil the PO you have always backup plan created.
15. Rate of Return
Supply Chain & Logistics Metrics / Quality / Brand Value / Cost / Product Investment
Description:Rejected defects are the defects where the consumer states a problem, but the producer or developer didn’t detect that defect before delivering to the client. It is the comparison of undetected (rejected by client) to the total defects detected during production.
Calculation Method / Formula:The formula for weight of Rejected defects is (#Rejected Defects)/ #Total Defects.
Should be High or Low?:If the number is close to zero, the defected units can be fixed before going to client. Delivery of the defected parts can cost the company much more than increasing budget for the detection and prevention.
16. Holding Cost
Supply Chain & Logistics Metrics / Inventory Management / Budget Management / Cost
Description:Those are costs related to store inventory. You should sum up your warehouse rent cost, security, insurance and personnel costs, depreciation of your stock.
Should be High or Low?:You can try decrease your cost by decreasing size of your stocks by better cooperation with your suppliers. You can increase frequency of your delivery according to market demand.
17. Stock-Out
Supply Chain & Logistics Metrics / Customer Satisfaction / Cost / Transport / Delivery Management / Inventory Management
Description:A situation in which the required item is not available in the inventory. Stock-out is a bad sign for a customer who will probably start to search for another retailer in the market. If you have a high stock-out level, you should check your other inventory metrics and reorganize it accordingly.
Calculation Method / Formula:Can be measured as a ratio of revenue: Lost sales / (Ravanue + Lost Sales)
or ratio of number of oredered goods: # Out of stok odered goods / (Total number of ordered goods)
Should be High or Low?:The target is to keep the stock-out at minimum but on the other hand you should be careful not to increase your average inventory level high above needs.
18. Service Level
Supply Chain & Logistics Metrics / Customer Satisfaction / Work Efficiency / Quality
Description:Measures performance of your service team. Some of the metrics that are part of this measurement are: % of calls answered. % of customers who wait shorter than standard fixed time, perfect delivery ratio.
Calculation Method / Formula:Calculation depends on the company and it’s sector.
Should be High or Low?:It is important to keep the service level as a high-quality asset of your company. You should remember that it is a high percentage of customers leaving after a bad customer experience.
19. Inventory Accuracy (IA)
Supply Chain & Logistics Metrics / Revenue / Inventory Management / Budget Management / Assets
Description:This metrics shows an accuracy between physical status of the inventory and the calculated status based on the records of all the actions (income, sales etc.). Inaccuracy can be related to thefts, damages, mistakes from supplier side, misplaced or missing labels, wrong location in the storage, miscalculations.
Should be High or Low?:If the accuracy is going down, there are plenty of strategies helping to improve the status. High inaccuracy can cause later a lot of problems with customers delivery time.
20. Freight Cost per unit Shipped
Supply Chain & Logistics Metrics / Cost / Budget Management / Financial Performance / Transport
Description:An average cost of one-unit shipping.
Calculation Method / Formula:Total freight costs / number of units shipped per period
Should be High or Low?:If the costs are growing you can try to optimize the load or change the shipping company for the cheaper one if you don’t lose on the delivery time.
21. Outbound Freight Costs % of Net Sales
Supply Chain & Logistics Metrics / Transport / Cost / Financial Performance
Description:This metrics shows how big part of the sales income goes to the shipment of your goods costs.
Calculation Method / Formula:outbound freight costs / Net sales
Should be High or Low?:Lower shipment costs can allow you to decrease prices if there is a need like that and be more competitive on the market.
22. Inbound Freight Costs % of Purchases
Supply Chain & Logistics Metrics / Cost / Budget Management / Financial Performance / Transport
Description:This metrics measure the percentage of the shipping costs of the goods/parts your company buys.
Calculation Method / Formula:inbound freight costs / total purchaises
Should be High or Low?:The same as with the outbound shipping cost lower shipment costs can allow you to decrease prices if there is a need like that and be more competitive on the market.
23. Claims as % of Freight Costs
Supply Chain & Logistics Metrics / Cost / Budget Management / Financial Performance / Transport
Description:It is a value of losses as percentage of all shipping costs.
Calculation Method / Formula:(Total loss + damage claims) / total freight costs
Should be High or Low?:Generally, it is calculated separately for each shipment and it is important to have that value on a possible minimum.
24. Freight Bill Accuracy
Supply Chain & Logistics Metrics / Revenue / Cost / Budget Management / Transport
Description:Auditing shipping bills is an important metrics and it helps you to stay aware on the level of problem and allow you to track if some of the actions taken allows you to maximize the result.
Calculation Method / Formula:number of correct freight bills / total number of freight bills
25. Truck Turnaround Time
Supply Chain & Logistics Metrics / Inventory Management / Cost
Description:Average time after truck arriving to the facility and the time when it can leave. It takes into account waiting time, all the paperwork, driving from the parking to the loading spot and the time of loading the goods.
Should be High or Low?:To improve the performance of the transportation there can be made some process simplification made or rearrangement in the warehouse to speed up the overall turnaround time.
26. Number of Carriers per Shipment
Supply Chain & Logistics Metrics / Transport / Cost / Financial Performance
Description:It is a number of trucks per each shipment.
Should be High or Low?:If the shipments are related to a big number of careers there are some possibilities to decrease it by optimize the load and decreasing also by that costs per shipment.
27. On-Time Pickups
Supply Chain & Logistics Metrics / Customer Satisfaction / Cost / Transport / Delivery Management / Inventory Management
Description:This is one of the factors that can decrease transport performance related to the Truck Turnaround Time and on time delivery.
Should be High or Low?:If the percentage is dropping it may effect on time delivery (OTD), decrease your performance and finally can cause some troubles with the customer satisfaction.
Below is the summary of Supply Chain KPI metrics:
Most Important KPIs for Different Industries
All industries have different dynamics hence various kpis are being tracked and measured. Below you can see the list of different sectors and areas where we have listed most important kpis for each of them.
Related Posts


