How to Create a Timeline in PowerPoint? | Step-by-Step Guide
Do you struggle with preparing presentations and often turn to PowerPoint when it comes to timelines? Are you curious about alternative methods outside of PowerPoint? Let’s dive into the fundamentals and answer the important question: “How to Create a Timeline in PowerPoint?” Our aim is to provide you with a plain approach to arranging events chronologically. There are two primary methods to achieve this in PowerPoint.
First and foremost, it is important to note that PowerPoint, Microsoft‘s most popular presentation program, has some tools and capabilities for creating visually appealing and informative presentations. The ability to make timeline visuals is one such capability, which is useful for displaying historical events, project milestones, or any chronological arrangement of events. Our goal is to make the process of creating a PowerPoint timeline for your project timeline needs as simple as possible. You can also get the difference between PowerPoint and Excel.

We will lead you through the process of creating a timeline in PowerPoint in this detailed step-by-step guide, allowing you to unleash the power of visual storytelling and timeline slide examples. If you are ready to gain experience, we can begin!
1. How to Create a Timeline in PowerPoint?
On Microsoft PowerPoint, you can draw your timeline with shapes and arrows, or alternatively you can use SmartArt for a timeline design. We’ll go through timeline with SmartArt via a step-by-step guide.
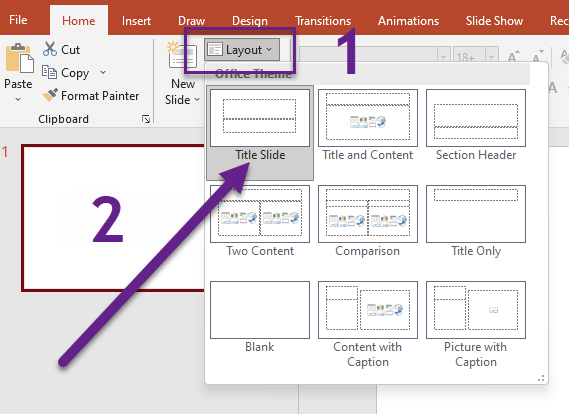
Step 1: Launch PowerPoint and Choose a Slide Layout
To begin creating your timeline, open PowerPoint and select a slide layout that best suits your needs. You can choose a blank slide or use a pre-designed template from the built-in PowerPoint template library. The way has been shown below:
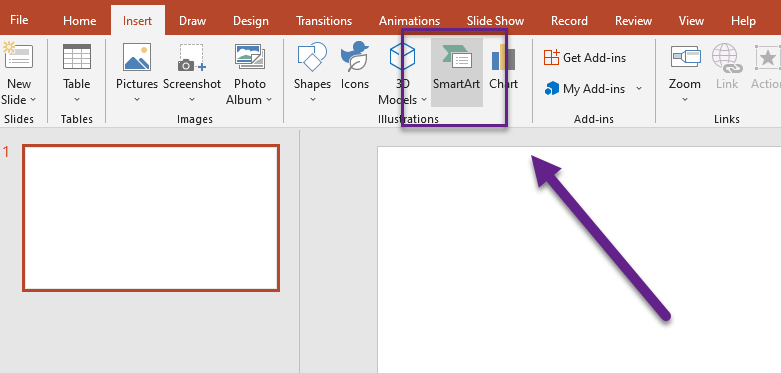
Step 2: Insert a SmartArt Graphic
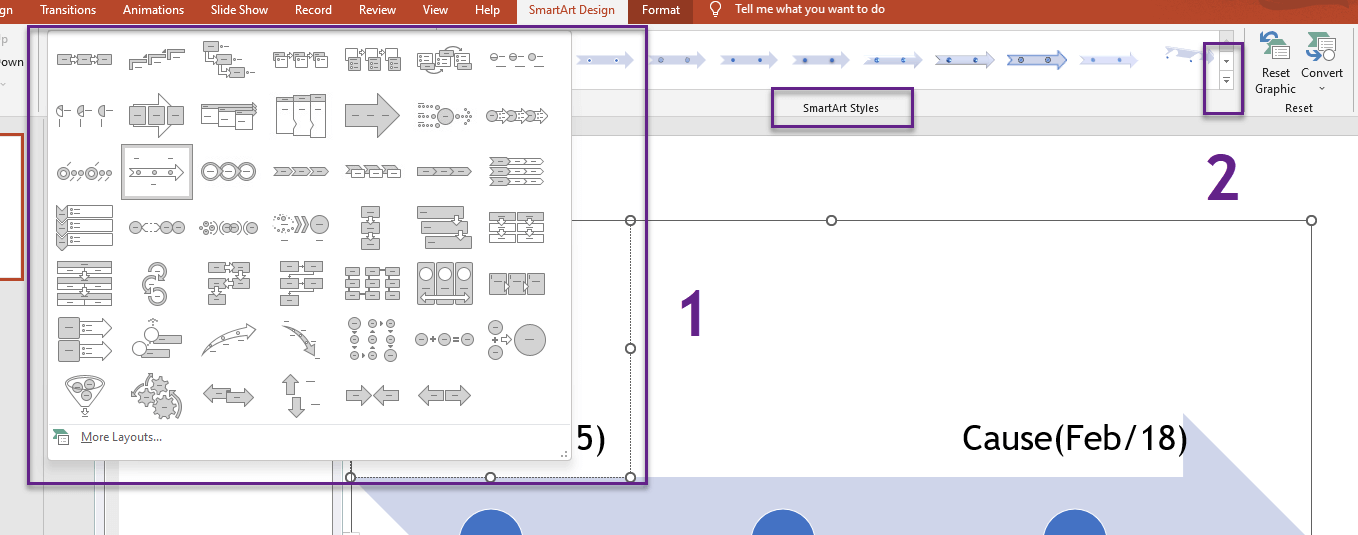
PowerPoint provides an array of built-in SmartArt graphics that can be easily customized for creating timelines. Obviously, to insert a SmartArt graphic, navigate to the “Insert” tab on the PowerPoint ribbon and click on the “SmartArt” button. In the SmartArt gallery, choose the “Process” category and select the timeline layout that aligns with your needs.
Step 3: Enter Timeline Data
Once you have inserted the SmartArt timeline graphic, a text pane will appear on the left side of the slide. This is where you can enter your data. Each bullet point represents a milestone or event on your timeline. You can add or remove points as needed and change the text to reflect your specific events.
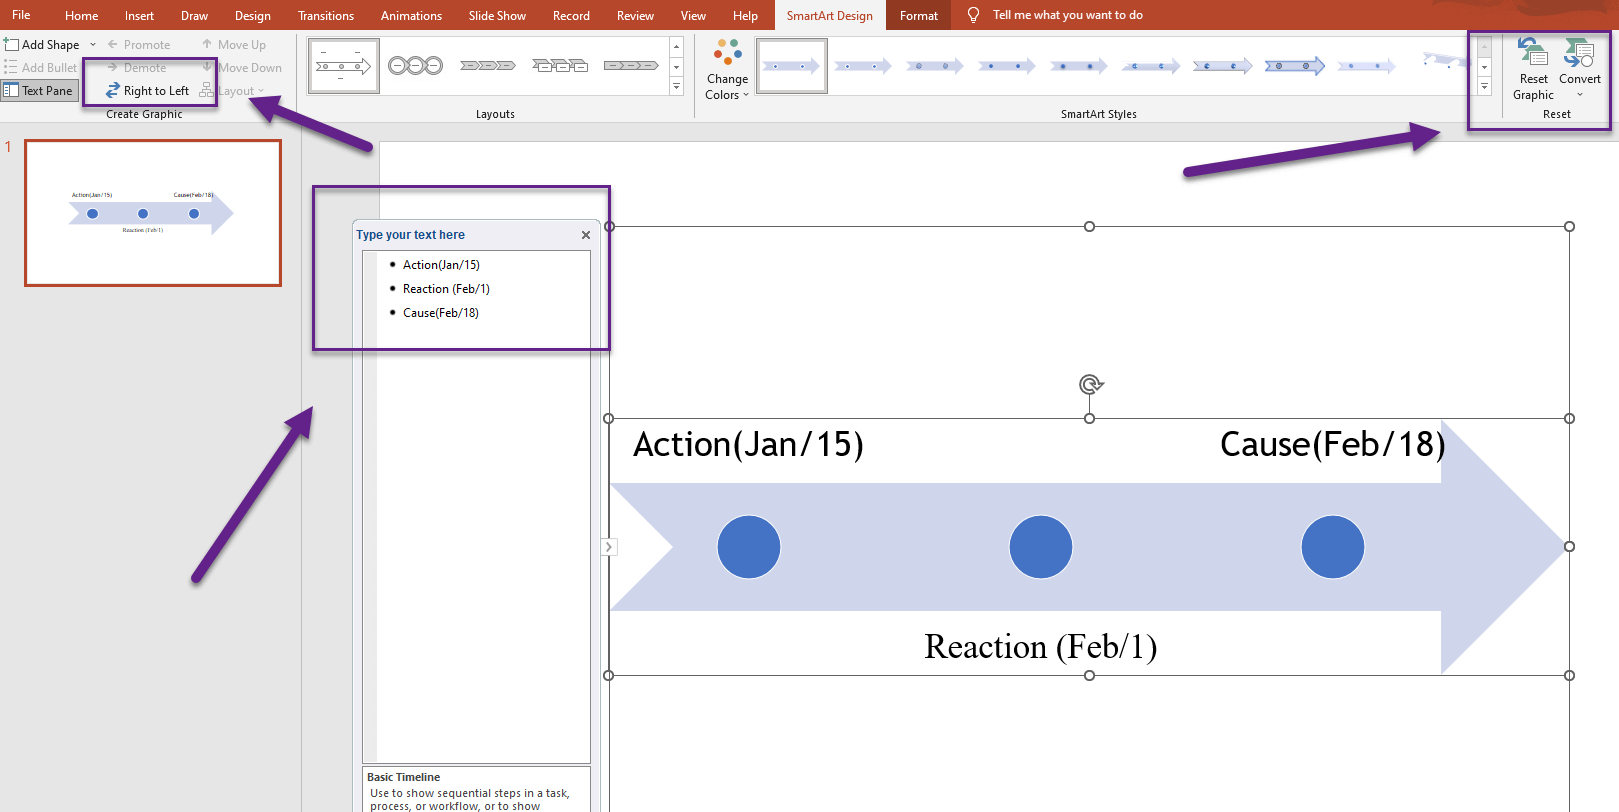
Step 4: Customize the Timeline
PowerPoint enables you to edit the appearance of your timeline to match your desired style and presentation theme. Select the graphic and utilize the formatting options in the “SmartArt Tools” tab to edit colors, shapes, and layout. You can also resize and reposition elements to create a visually appealing design or docket options that you find suitable.
Step 5: Resize, Present and Share Your Timeline
Hence, once you have created and customized your timeline, it’s time to present and share it. Before that, you may want to resize, as shown below:
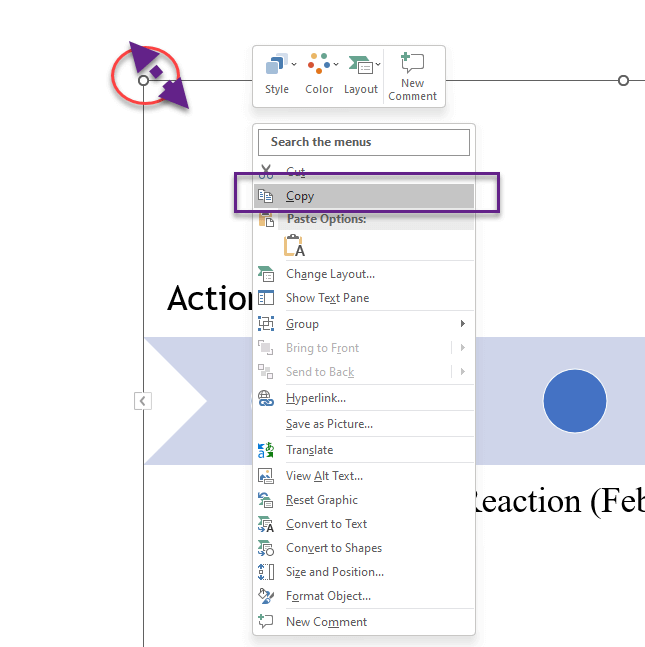
Finally, to enter the Slide Show mode to showcase your timeline to an audience. You can also save your PowerPoint file as a PDF or image file to distribute it digital way or print it for physical outputs. Or copy it to transfer to an Excel worksheet.
 2. Ready-to-use Timeline Excel Template

A timeline graph is used to show the progression of events across time. Aside from that, it is often recommended to represent the cycle of historical events or the events you have experienced within a specific time period. This timeline generator is an Excel spreadsheet template that lets you create a timeline with single day and time range events.
Another reason to utilize this timetable is to arrange your work and keep your chores in order. People also use this template to make future plans. You may also represent the chronological arrangement of event, such as in a historical timeline. Let’s see how simple it is to create a timeline milestone chart in Excel Timeline Template.
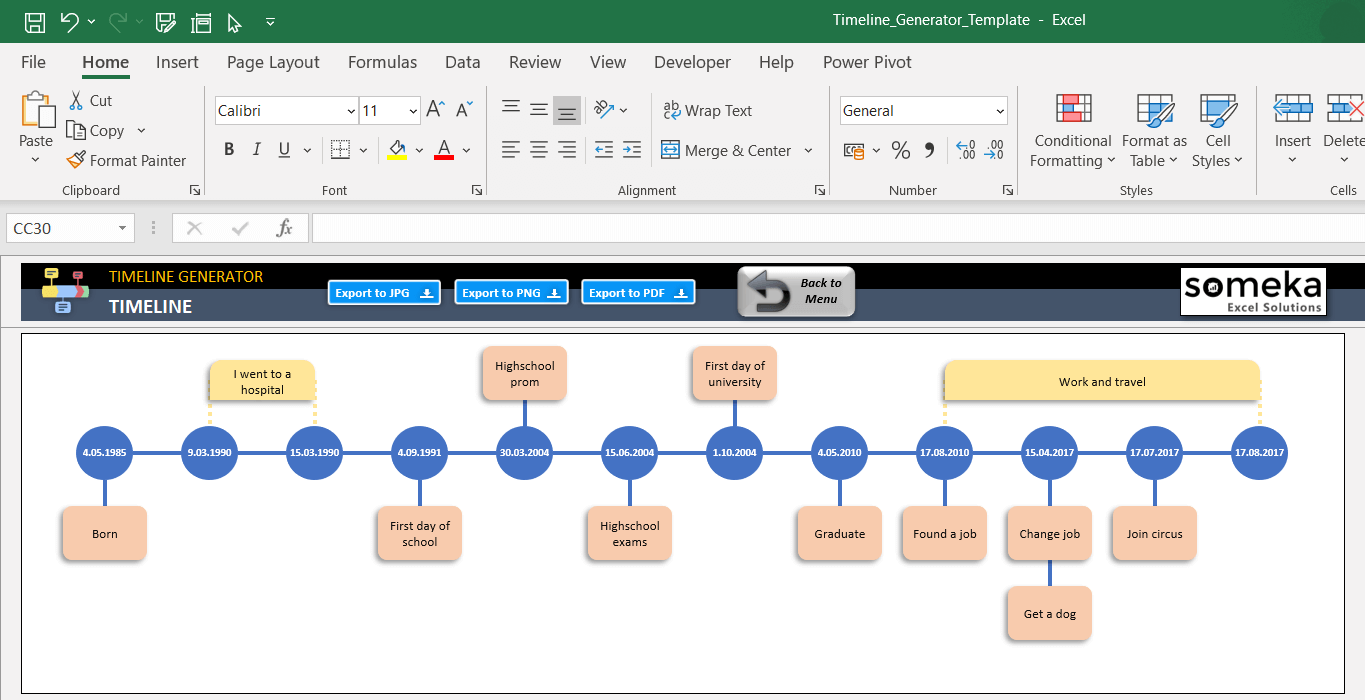
– This history timeline diagram is automatically created on Excel Timeline Template by Someka –
So, simply provide the event name, start date, and finish date in the Data Input section. Once you have entered the necessary information, you can click the “Draw Timeline” button, and the tool will swiftly create the timeline graph based on your inputs.
Finally, after you get your timeline in the preferred timeline design. There are three options on the timeline page for selecting the document format into which you want to export. These buttons allow you to export to PDF, JPG, or PNG files. With a single click, you can choose the best solution for you. This is totally up to you!

3. Conclusion
PowerPoint is an basic tool that enables you to create timelines or presenting the events chronological way. However, to make or create some actions, they are not dynamic; on the contrary, you have to do them manually. In that case, using Someka Excel templates will be your time saver to protect your energy. By following this detailed step by step guide, you can unlock the full potential of PowerPoint’s features and customization options to craft visually appealing and highly informative timelines.
Hence, it is crucial to maintain a concise and focused timeline, ensuring that it remains visually engaging while aligning with your overall goals. You know what they say, showing is just as important as doing.
By investing the time and effort to create a well designed timeline, you have the opportunity to elevate your storytelling and leave a lasting impact on your audience. As an important note, PowerPoint offers some limited possibilities to creating effective timelines. But, Excel timeline templates will provide robust capabilities to create diagrams in seconds.

4. FAQs
1. Is there a timeline template for PowerPoint?
Simply, yes. PowerPoint offers a wide range of pre-designed timeline templates that you can use as a starting point. To access them, open PowerPoint, click “File” select “New” and search “timeline” in the template search bar. Then, to choose a template that suits your needs, and you can edit it to fit your specific needs. If you have enough time to create, it can be an proper option.
2. How do you create a timeline in PowerPoint for free?
Creating a timeline in PowerPoint for free is easy but very time consuming. There are some different options. Open PowerPoint and start with a blank slide. From the “Insert” tab, click on “SmartArt” and choose a layout from the “Process” category. Then, enter your data in the text pane, edit the design, and add visuals and animations as desired. PowerPoint’s built in actions provide ample options to create a professional looking without any extra cost. Or as an alternative way, you can prefer to use some ready to use Excel templates to create a timeline, which is also free. Then, you can transfer it from Excel to PowerPoint.
3. How Do I show Office Timeline in PowerPoint?
Besides, Office Timeline is a third party add-in that improves PowerPoint’s capabilities for creating timelines. Then, to show Office Timeline in PowerPoint, you first need to install the Office Timeline add-in on your computer. Therefore, visit the Office Timeline website and download the appropriate version for your PowerPoint setup. Once installed, Office Timeline can be accessed from the PowerPoint ribbon. This is a suggested way to improve PowerPoint options.
4. How to Do Timeline Animation in PowerPoint?
Firstly, to animate your timeline in PowerPoint, select the elements you want to animate, such as the milestones or events. Go to the “Animations” tab on the PowerPoint ribbon and choose an animation effect from the options available. In PowerPoint, you have the option to choose entrance animations or utilize motion path to add movement. Consequently, to edit its timing, and order to create the desired effect.
5. How do I Create a Timeline in Excel or PowerPoint?
Although both Excel and PowerPoint offer options for creating timelines, they serve different purposes. In Excel, you can use a stacked bar chart or a scatter plot chart to create a basic timeline. Enter your data in a custom format, select the appropriate chart type, and edit it. Within the ready to use template, these Excel functionalities have been increased. Otherwise, PowerPoint seems to provide more changable in terms of design and visual elements. But all these PowerPoint sides are manual driven ones, even when you use SmartArt to create.
Recommended Readings:
How to Make a Timeline in Excel?
How to Create to Flowchart in PowerPoint? Easy Steps with Examples
How to Create Org Chart in PowerPoint? – With Video & Examples
Related Posts


