KWL Charts: Teaching Strategy that Work for your Students!
Contents
- What is a KWL Chart?
- Benefits of KWL Charts
- How to Use KWL Charts?
- Column 1: Know
- Column 2: Want to Know
- Column 3: Learned
- Tools for KWL Charts
- Advantages of Using Excel
- How to Use Excel For Educational Purpose
Teachers try to find various ways and instructive techniques to engage their students in the learning process. Some effective tools already exist; waiting to be used by them.
KWL chart is one of the effective teaching strategies to help in learning. In this article, you will get comprehensive information about KWL charts, their benefits, usage and the right tools.

What is a KWL Chart?
KWL is an educational strategy which stands for: Know, Want to Know and Learned. In other words, KWL Charts is a graphical organizer that helps students to get involved in the learning process.
It is mainly used by teachers to cooperate with their students and guide them through a topic. It can be applied to any subject or lesson.
KWL chart improves classroom activities so students become aware of what they are learning. When they have a text to read they realize what they expect from that and what they could learn.
They record their learning process by doing followings:
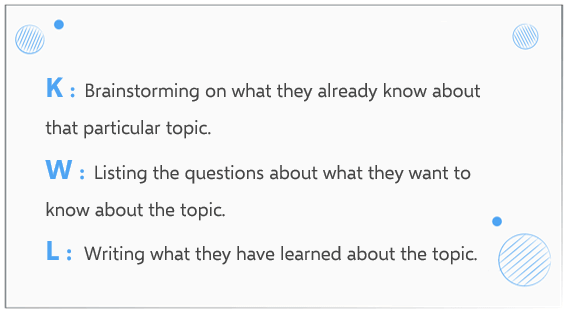
All are recorded in the three columns of the chart. There are also additional variations of a KWL chart which can be included SIFR sections: Still want to know, Importance, Found and Remember.
These columns can be added to the chart to continue.
Check Free Educational Resources
Benefits of KWL Charts:
Offering some benefits for both students and teachers, it is very easy to use and effective on students learning processes.

Using this approach:
- Sets a purpose: Students know why they are about to read a particular text.
- Highlights existing knowledge: It motivates students to think over and detects their prior knowledge about the topic.
- Gives a direction: By recognizing what they already know, students could set their learning goals and expectations.
- Is practical and flexible: It helps to visualize the learning process easily, also provides a flexibility to use it for a different subject or needs.
- Brings students and teachers together: It engages students in the learning process and provides teachers identification students needs.
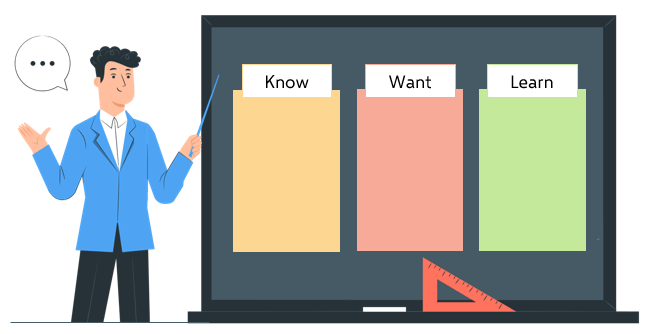
How to Use KWL Charts?
The chart is divided into three columns: K, W, and L. You fill out before, during, and after the lesson. You either create your chart by hand or using an online tool to make it faster and easier.
After defining the topic, you can start creating your chart by following these steps.
 Not a data visualization expert? No problem! Check our easy-to-understand Excel chart makers to create org charts, gantt charts, flow charts and more!
 Not a data visualization expert? No problem! Check our easy-to-understand
 Column 1: Know
First of all, students need to determine what they already know about the topic of the text.
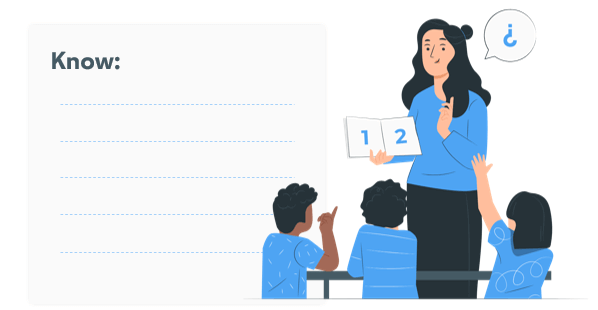
This phase begins with creating the chart, continues by asking students to think about what they know. Students can work as small groups, or take their notes individually and share with the rest of the class.
Ask them to brainstorm about their knowledge; what they think they know and what they associate with the topic.
You can encourage them to explain their ideas or fill the chart together with the class after reviewing their notes. Their associations are recorded in the first column. At this stage, you can guide them or correct some of their points if necessary.
Recommended Reading: Eisenhower Matrix: How to Prioritize Tasks and Increase Productivity?
Column 2: Want to Know
After identifying students knowledge, now you can ask them what they want to know and fill the second column in the chart.
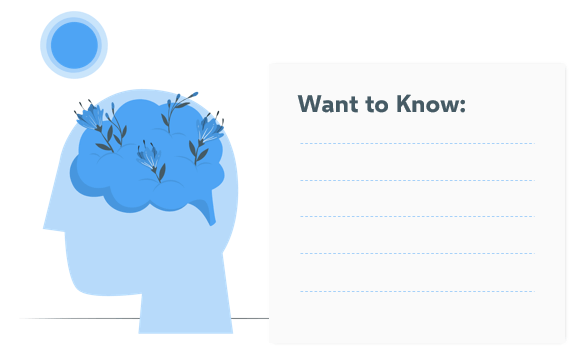
Students should bring out their ideas about what they want to learn at the end of this text. However, if they are unsure about what they want to know; you can prompt them with some questions.
In this way, they can clarify their expectations by answering those questions. You can consider asking:
- “What do you want to learn about this topic?”
- “What do you think you will learn about this topic?”
- “How to learn more effectively?”

To help your students make their goals more meaningful, you can use this SMART Goals Framework in Excel to have your students write their own goals.
Questions should be student-oriented and engaging. This phase helps you to understand their approach to that topic.
Column 3: Learned
You can have them read the text and fill the L column with their learning outcomes.
This can be done during or after reading. They will record what they are learning by answering the questions in the W column. In addition, ask them if they found something interesting besides those questions.

At the end of this step, discuss with your students about their learning.
Ask their feedback about the activity, and if there is anything they wish they had done differently in the first step. You can give your feedback to them as well and comment on their ideas.
After recording the last column; students become more conscious about their gains, and teachers have the chance to track the learning progress of their students. You can develop your lesson plans based on the overall objectives, or use the StuDocu teaching materials containing a lot of effective tips and strategies to improve your lesson plan.

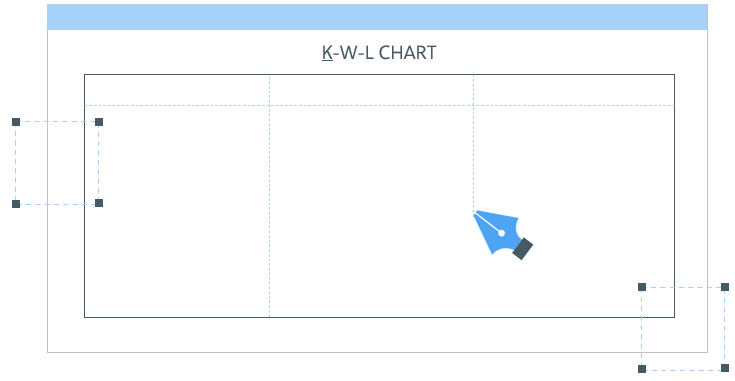
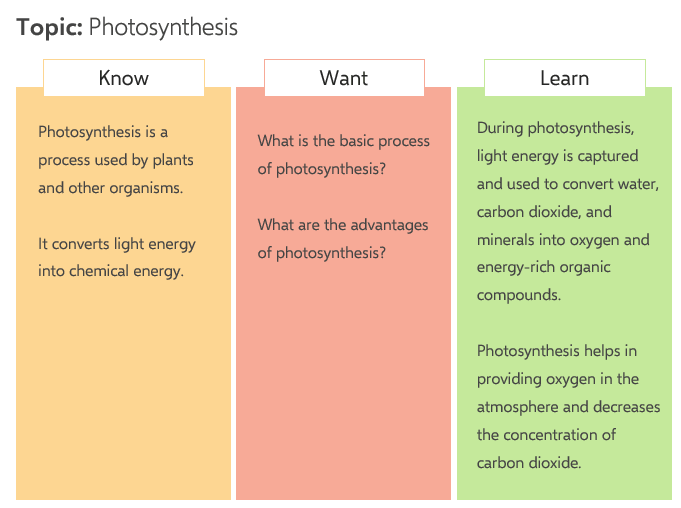
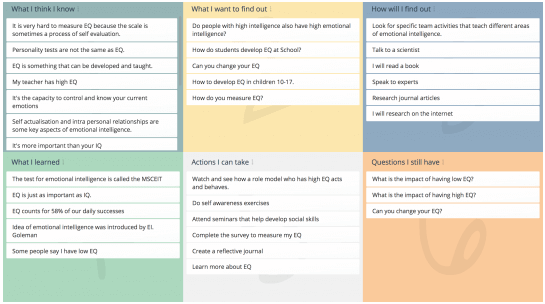
KWL Chart Example
Here is an example of a KWL chart:
Tools for KWL Charts
If you don’t prefer to create your chart by hand, you can use one of the ready charts. There are online interactive tools with options:
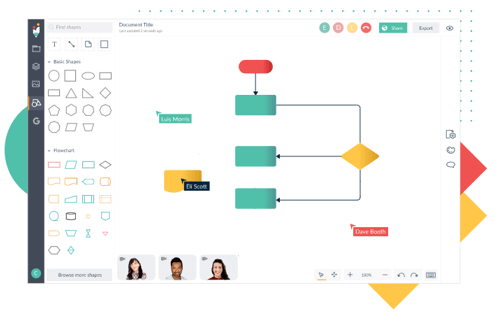
- Creately: is an online tool with various chart templates. It offers customization and export options. You can add images, links or notes to your chart.
-
- Miro: is a basic template that you can create your KWL chart online, and it also offers tools for agile practices like daily standups.
- Lucidchart: is a cloud-based visual diagramming solution that you can find many blank templates. It is printable and accessible by anyone with a Lucidchart account.
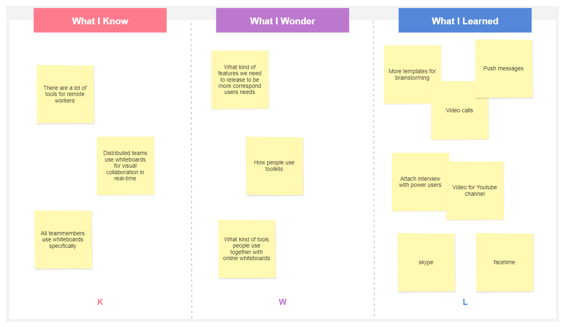
- GroupMap: is another tool for creating similar charts online. People can invite the others and work collaboratively to share their opinions. The tool is easy to access remotely.
- Excel: is a well-known tool that you can benefit from creating KWL charts. Like its many other functions, it is easy to use and doesn’t require any installation. You can organize your lesson plans with minimum effort.
After making your KWL analysis, you can also prepare your essay or article to present your study, and with a college essay writing service, you can deliver high quality papers.
Advantages of Using Excel:
Using Excel for KWL charts has some benefits over other solutions:
- Affordability: Comparing to other options, Excel is affordable for everybody.
- Time-Saving: It doesn’t require any learning process; you only need basic computer skills. It also offers you the fastest method so you can create your chart in only a few minutes.
- Ease of Use: You can update your data and form your template. In the end, you can easily import your chart into pdf; save it on your computer and use it on other digital platforms.
- Customization: It provides you tremendous selections; you can choose the shape, colors or text fonts and view your changes immediately.
- Ready Templates: Excel offers students and teachers suitable templates to manage their classroom activities.
How to Use Excel For Educational Purpose:
These lesson plan templates in Excel are created for students and teachers to keep their works in place and track their progress. They are ready to download.
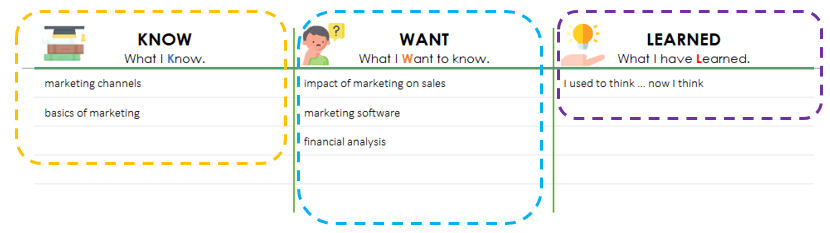
- KWL Chart Template: You can use this blank Excel template to build, share, discuss with your students and present KWL charts to classroom. Just write down your notes under each column according to your current knowledge and build up on them within a time.
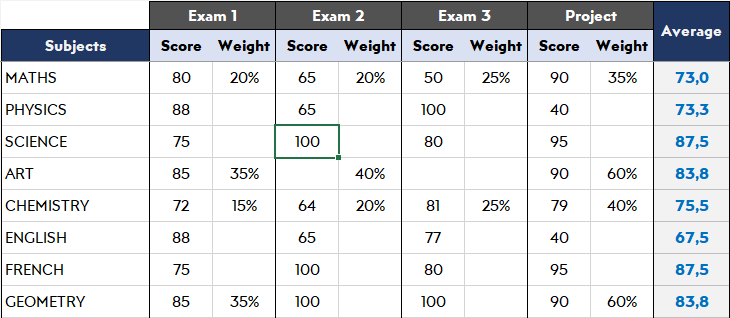
- Student Lesson Plan Template provides students lesson study calendar template, well-organized study plan for each lesson and visualized performance tracking. It includes 5 sections; dashboard, lesson schedule, study plan, exams and homework & projects.
In the dashboard; students input lesson names under the subject, and exam dates or assignments under the calendar column. They can set their lesson schedule; then study plan helps them to schedule their studies.
For the exam section, they can write their scores and even visualize them on the side. If you’re having essays, either you write it or use a team of essay writers for you, you can record your scores in this section. In the homework and projects part, students choose a lesson, write description and deadline. Then, the tool brings the completion rate for each subject.
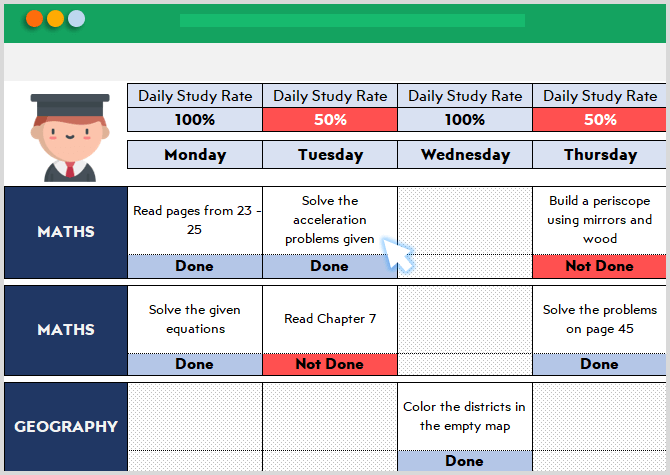
- Teacher Lesson Plan Template, on the other hand, provides teachers daily and weekly lesson plan template, well-organized plan for each lesson; also allows them to visualize student tracking. It includes 6 sections; dashboard, attendance, daily lesson plan, weekly lesson plan, homework and exam results.
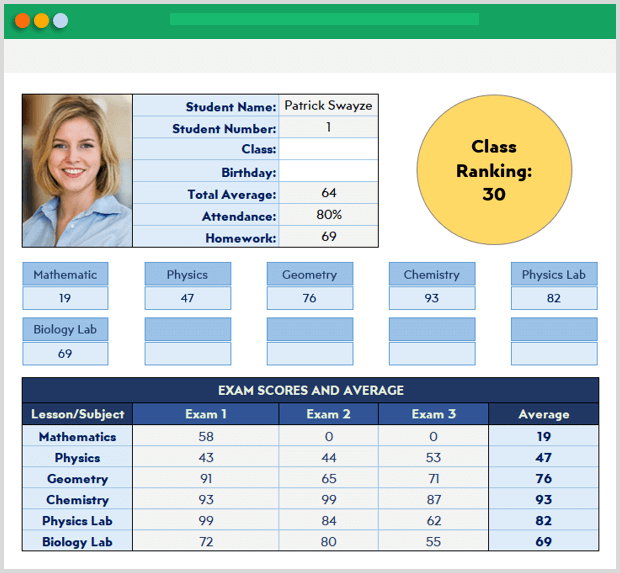
In the dashboard, teachers can insert students info and the subject details. They can also display students profiles individually and even keep notes for them. In other sections; teachers can update the attendance of the students, create a daily or weekly lesson plan, record the homework and exam results.
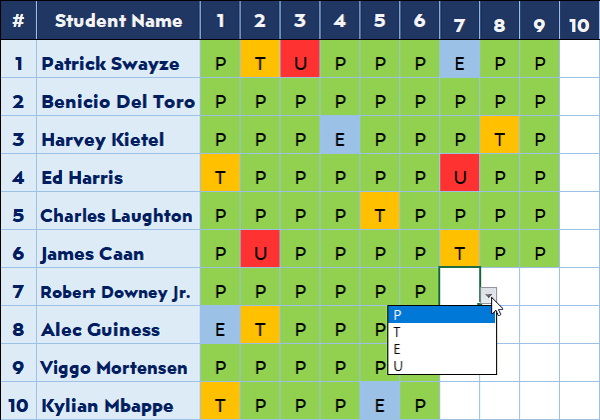
This template allows teachers to keep the student records and overview their performances.
FINAL WORDS
KWL charts are effective organizers to facilitate learning activities. Students engage in the learning process and teachers get the chance to create lesson plans that address the interests of their students.
These free Excel Templates is a starting point for those looking to improve comprehension in the classroom. You can easily integrate your teaching system into Excel and track your students progress without any hassle.
For those looking to other educational templates, take a look our Education Category.
Related Posts