How to Make a Venn Diagram on Google Docs? Step-by-Step Guide
Welcome to the “How to make a Venn diagram on Google Docs? Step-by-step guide” blog. Since Google Docs is getting pretty popular day by day, everybody wants to do their analysis and planning on it. Especially, diagrams like Venn diagrams are one of the most popular analysis styles in workbooks.
There are several reasons for using Google Docs such as a sharable workbook and simultaneous edit option by multiple users. After this blog, you will be able to create your own Venn diagram and won’t need to make searches like “how to make a Venn Diagram on Google Docs”.
In brief, this log will help you to create several Venn Diagrams types such as the 2 circles model, flower model, stacked model, linear model, two-set intersections diagram, and triangular Venn diagram.
Table of Content
1. Types of Venn Diagrams
2. How to Make a Venn Diagram on Google Docs?
3. Automatic Venn Diagram Template
4. FAQs
5. Conclusion
1. Types of Venn Diagrams
As we discuss there are several different Venn diagram methods. But what are the types of venn diagrams? Before diving into how to make Venn in Google Docs, let’s see some diagram types.

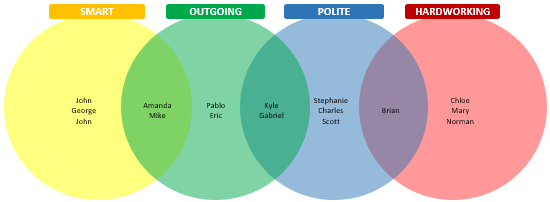
1.1. Flower Model
The flower model Venn diagram is a highly applicable analysis method for 6 or more variable problems. Obviously, there are many intersections area in this Venn diagram style. The flower model Venn diagram is useful for complicated data to analyze.

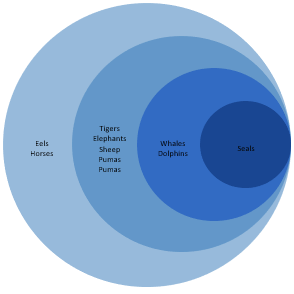
1.2. Stacked Model
The stacked model Venn diagram is a concept that is used in machine learning and multiple reason-result problems. Such as, it is highly popular in AI learning and algorithms analysis.
1.3. Linear Model Venn Diagram on Google Docs
The linear model Venn diagram is used to visualize mathematical problems and efficiency problems.
1.4. Other Google Docs Venn Diagrams
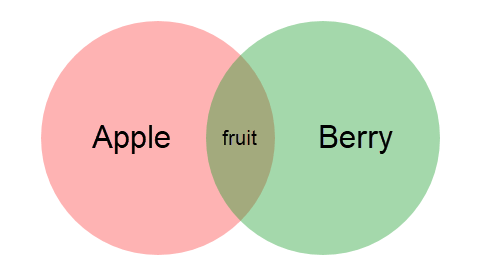
Probably, the most popular Venn diagrams on Google are Venn circles. Whether you want to draw a flower model or a stacked model, you can use Venn circles. Still, you can choose a triangle or rectangle too. It is really depending on your taste. There is no difference between the Venn circles diagram and the triangular Venn diagram. There is also candle shape Venn diagram and the best example is Box Whisker Plot Maker.
2. How to Make a Venn Diagram on Google Docs?
Firstly, designing your own Venn diagram on Google Docs is pretty straight forward and we will explain it to you in 6 basic steps.
Step 1 – Opening Drawing Window
First of all, you should have a Google account to open Google Docs. Then, open your new Google Docs workbook. Now you have a clear Google Docs page.
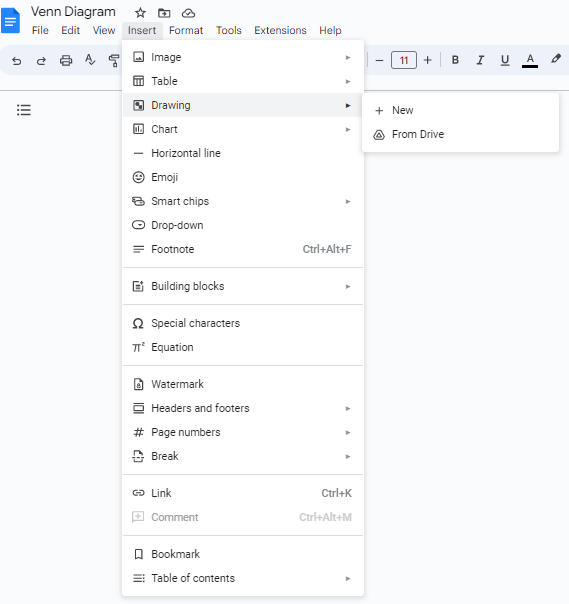
Step 2 – Inserting shapes
Secondly, click the insert button on the top panel and choose drawings then new drawings. There are a couple of different Venn diagram modules that you can draw: 2 circles model, flower model, stacked model, stacked model, linear model, triangular Venn diagram, Venn circles, intersection area, two-set intersections, etc.
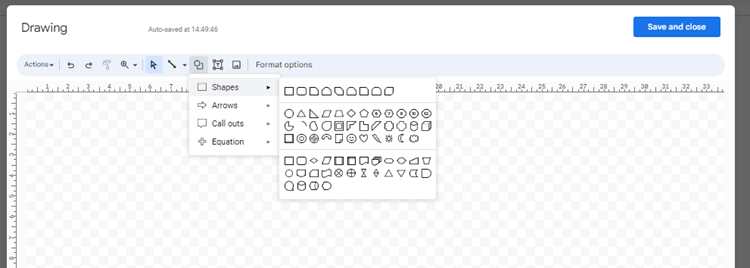
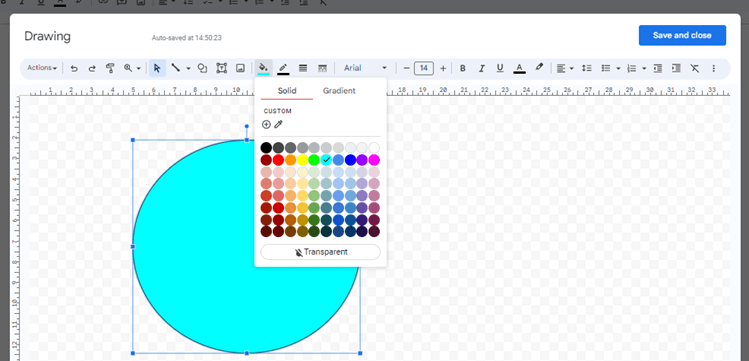
Step 3 – Formatting the shapes
After you click new drawings, a new panel will appear on top. Then, you can choose any type of shape and color here.
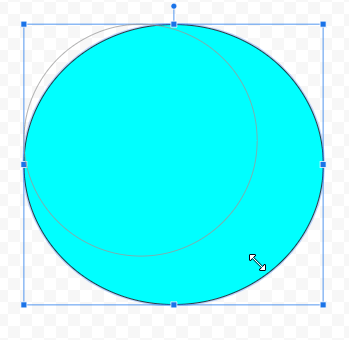
Step 4 – Sizing and duplicating the shapes
Next, you just size your shape! For instance, a triangular Venn diagram needs 3 shapes. So, you can duplicate them with copy-paste option. Lastly, add your shapes and design your Venn Diagram.
Step 5 – Designing the intersections
Lastly, choose all the shapes you just add and reduce the transparency! intersection sections will be different colors since they will be overlapped, and some parts of shapes become different colors.
Step 6 – Saving of Venn Diagram on Google Docs
When you Save and close your drawing window, the Venn diagram is automatically added to your document.
3. Automatic Venn Diagram Template
If you do not have time to create these diagrams manually, you can just download our Venn Diagram Template.
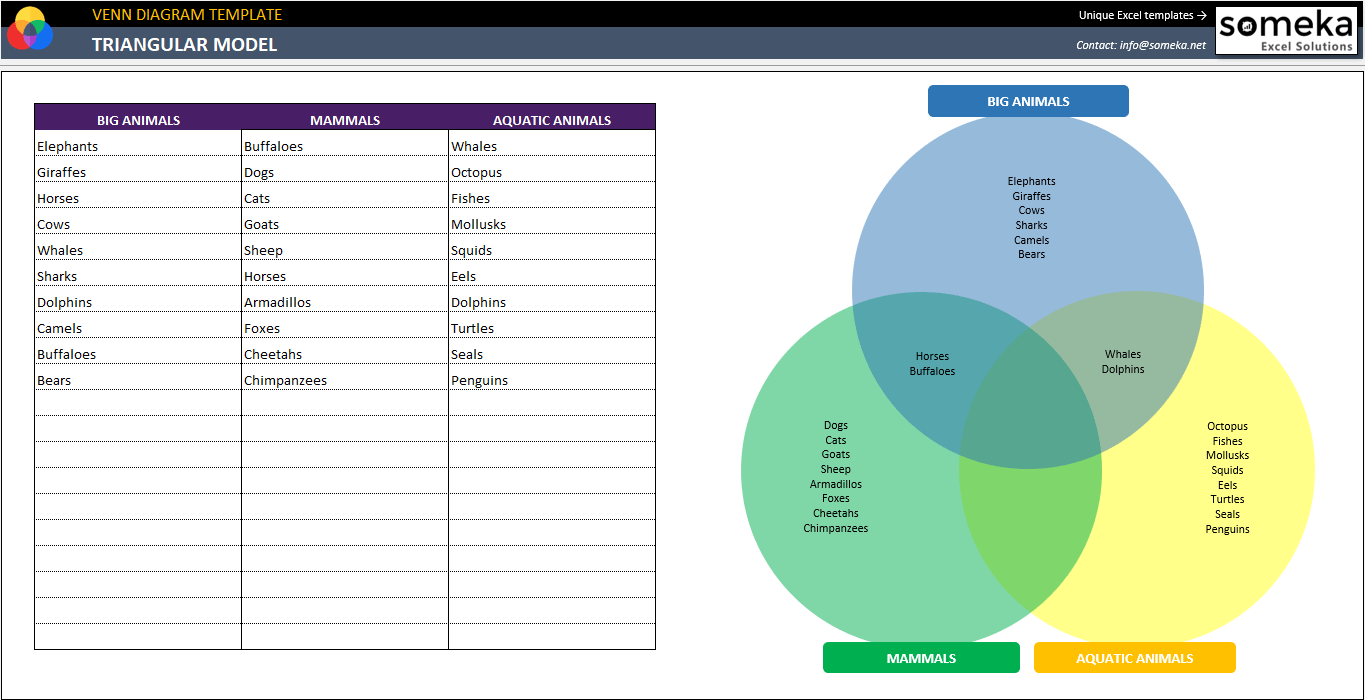
– This diagram is created on Venn Diagram Excel Template by Someka –
This template lets you create different types of Venn charts in seconds. You just write your data set and click on the circle model you like.
Lastly, if you want to move your Venn to your Google Docs document, you can easily take a screenshot or just copy-and-paste your shapes.
4. FAQs about How to Make a Venn Diagram on Google Docs
1- How do you overlap circles in Google Docs?
You should create two different shapes first. Then click on one of the Venn circles and drag it onto the other shape. If you already lower your transparency, you will be able to see the intersection area clearly.
2- How do I create a diagram in a document?
Depending on the workbook style there might be different methods. Firstly, if you have an add shapes module in your workbook, you can open a drawing window and add your shapes. All then is to format your shapes. Or you can use a spreadsheet to create your diagrams, then export it to your document.
5. Conclusion
There are several ways to design your own Venn diagram on Google Docs. But if you want to create dynamic charts, then a Venn diagram template will provide you with an automatic solution. In this way, you can do any type of Venn diagram you like! Since all analysis methods favor a type, this method can be applied to any area.
In conclusion, You can check our tips and tricks to master your Google Docs or Google Sheets skills.
Recommended Readings:
What is a Pareto Distribution? Here is an Eye-Opening Guide to Pareto Charts!
Related Posts