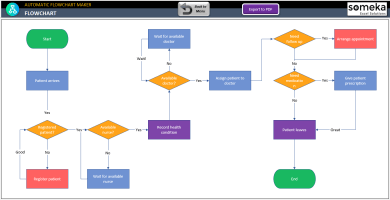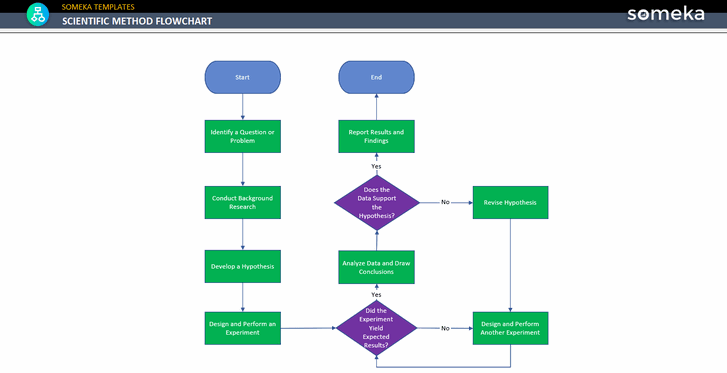
The Scientific Method Flow Chart is developed to visualize the phases of scientific experiments. Each scientific project has its unique process and can be very complex. So it’s always beneficial to prepare a flowchart before starting the experiment. This way, you’ll react faster and accurately whatever the outcome.
The Scientific Method Flowchart includes phases such as; identifying a problem, conducting research, developing a hypothesis, performing an experiment, analyzing the outcome, reporting the results, etc. This Scientific Method Flowchart is fully customizable, so you can add additional stages and edit the existing ones.
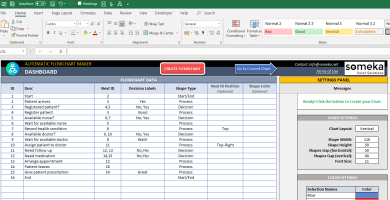
You can download the Scientific Method Flowchart above.
The Scientific Method Flowchart is available as a PDF file and an Excel file.