Data Analysis Excel Templates
Professional Data Analysis Excel Templates. Automatic chart and diagram makers. Visualize your data in dynamic dashboards.
Ready-to-use spreadsheet templates. Sleek-design tools with dynamic dashboards. Instant download files in Excel and Google Sheets.
Ready-to-use spreadsheets for Data Analysis
We’re living in an info world, but how to analyze all that big data? Our Data Analysis Excel Templates will help you choose the right data visualization methods to report and present your statistics and data inputs.
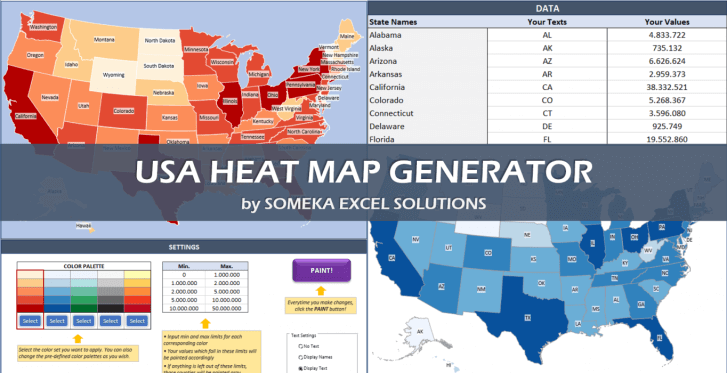
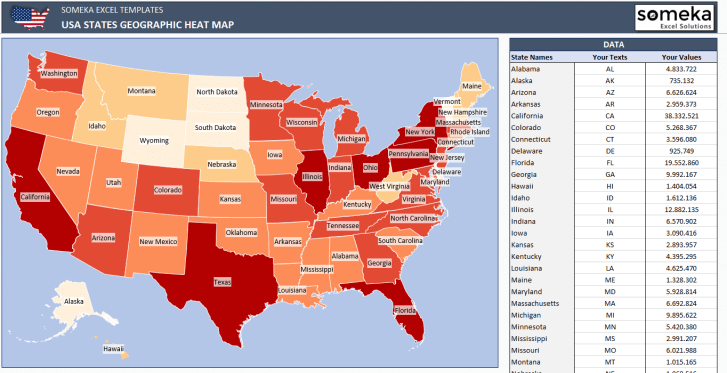
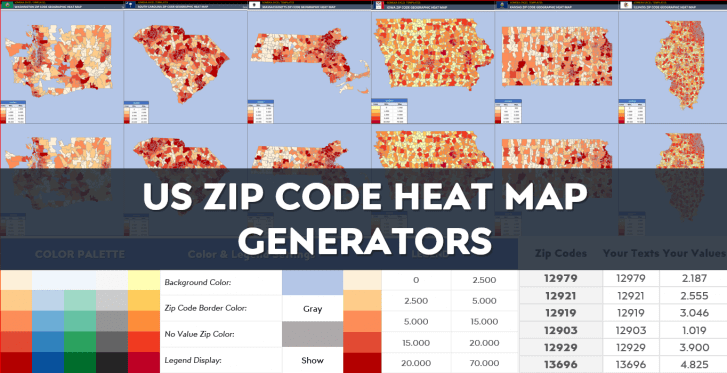
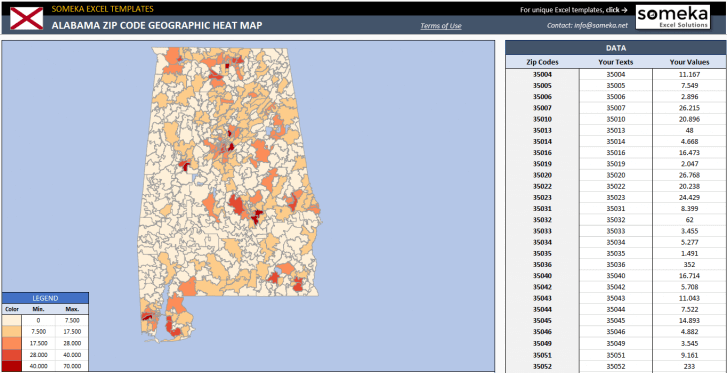
With these data analysis tools in Excel, a single click will be enough to create charts and diagrams with sleek-design dashboards. Input your data and let our templates visualize it for you.

All in Excel. No need to install any extra software.
Do you want to analyze complex data, uncover insights, and present your findings with professional tools in Excel? Then you’ll find professional-looking templates to handle all your data analysis needs seamlessly.
In addition to the basic data analysis templates, you’ll also find comprehensive models for statistical analysis, financial analysis, business intelligence, and research data visualization. We also provide templates for various applications such as sales analysis, market research, and operational performance.
1. For who?
This Data Analysis Templates in Excel will help many people to analyze data including but not limited to business owners, start-ups, e-commerce businesses, consultants, data analysts, as well as students, teachers and academy people.
- Data Analysts: You can perform detailed data analysis, create comprehensive reports, and uncover insights.
- Financial Analysts: It’s possible to analyze financial data, create financial models, and generate detailed reports.
- Business Owners: You can monitor business performance, track key metrics, and make informed decisions.
- Market Researchers: For your research studies, you can conduct market analysis, visualize research data, and present findings.
- Academics: Also for students and professors, these tools will help to analyze research data, visualize trends, and present academic findings.
- Consultants: You can provide clients with data-driven insights and visual reports.
- Sales Managers: It’s easy to monitor sales data, analyze trends, and improve sales strategies.
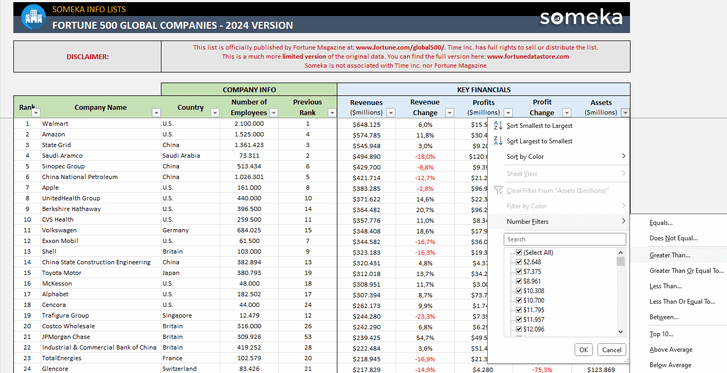
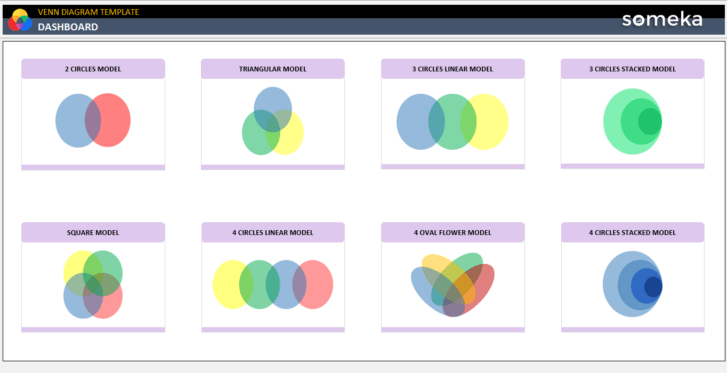
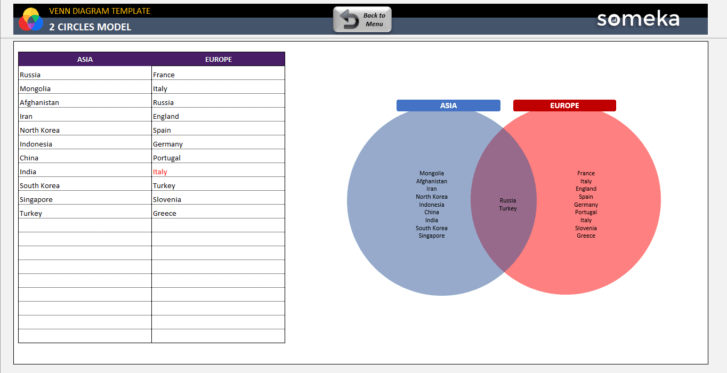
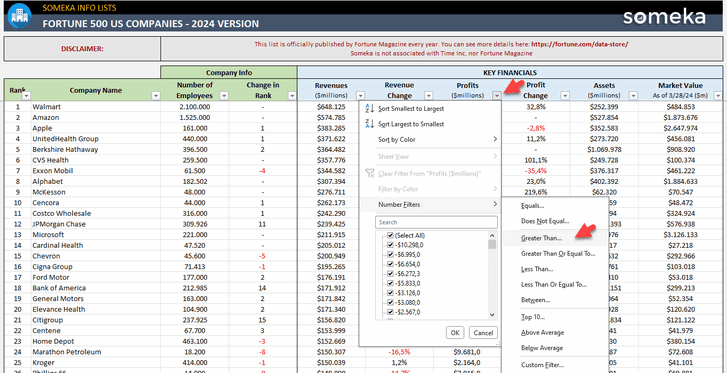
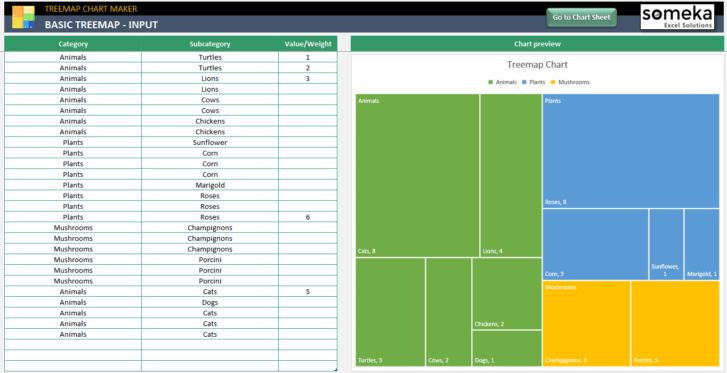
You will easily assess your data in pareto, treemap, box and whisker, histogram charts or Venn diagrams. Many other useful chart makers are available here.
A very professional company, tailoring packages to allow your company to grow.
Halil Bayat – Turkey
2. Functionalities
Our data analysis Excel templates are equipped with a range of functionalities to meet your daily needs:
- Data Visualization: Create dynamic charts, graphs, and dashboards for easy data interpretation.
- Statistical Analysis: Perform statistical tests and analyze data distributions.
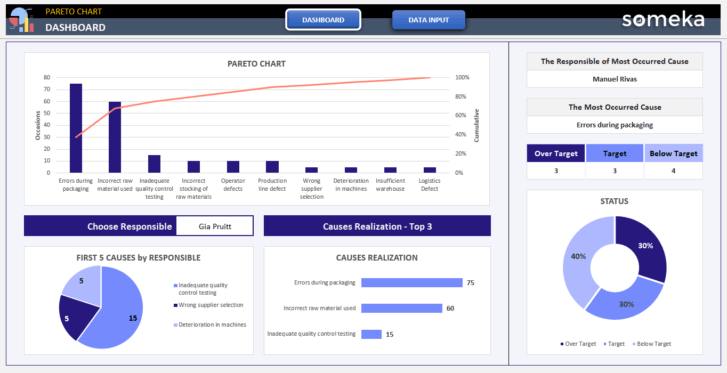
- Pareto Analysis: Create pareto charts for any of your data.
- Financial Modeling: Build financial models, perform financial analysis, and create detailed reports.
- Business Intelligence: Track key performance indicators (KPIs) and monitor business metrics.
- Trend Analysis: Analyze data trends over time and identify patterns.
- Forecasting: Predict future trends and outcomes based on historical data.
- Data Cleaning: Clean and prepare raw data for analysis.
3. Benefits
- Auto chart makers for big data
- Dynamic dashboards included
- Fully editable and printable
- On-sheet instructions
- Works both on Windows and Mac
- Ready-to-use
4. Use Cases
You’ll use these data analysis spreadsheets in many areas, such as:
- Business Performance Analysis: Monitor and analyze key business metrics.
- Financial Reporting: Analyze financial data and generate detailed financial reports.
- Market Research: Conduct market analysis and present research findings.
- Sales Analysis: Track sales data and analyze sales performance.
- Project Management: Monitor project performance and optimize resources.
- Academic Research: Analyze research data and present academic findings.
- Operational Performance: Track and analyze operational metrics for efficiency.
- Customer Analysis: Understand customer behavior and preferences through data analysis.
How to use Data Analysis Excel Templates?
All our data analysis tools are available in Excel. So, without any installation or set-up, you can easily download our templates.
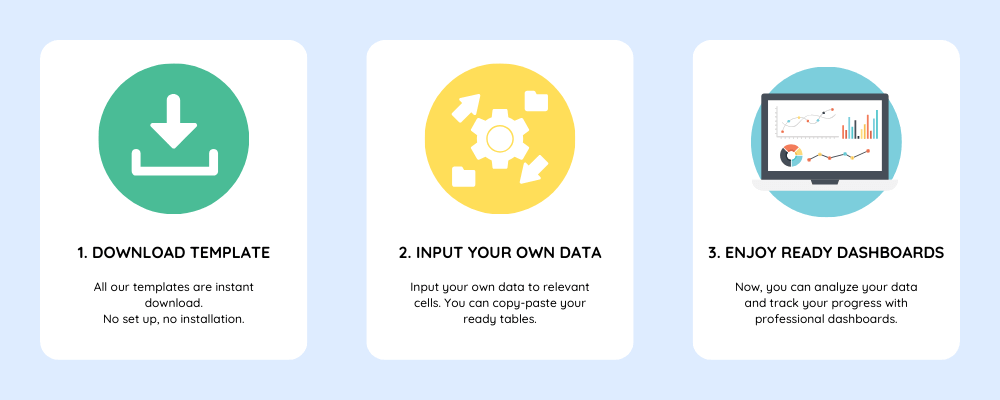
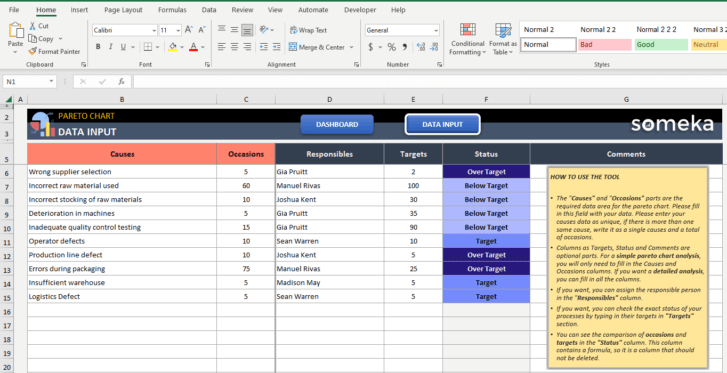
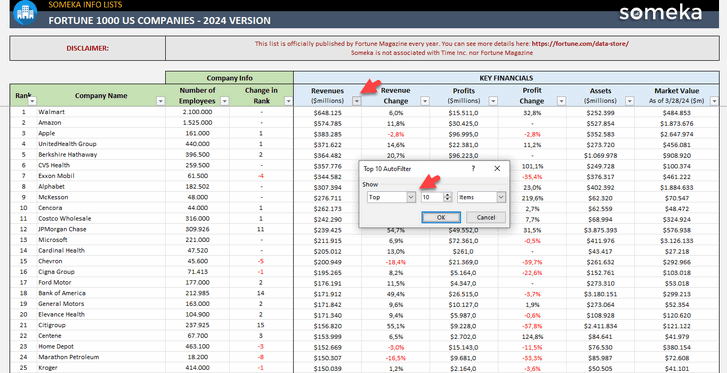
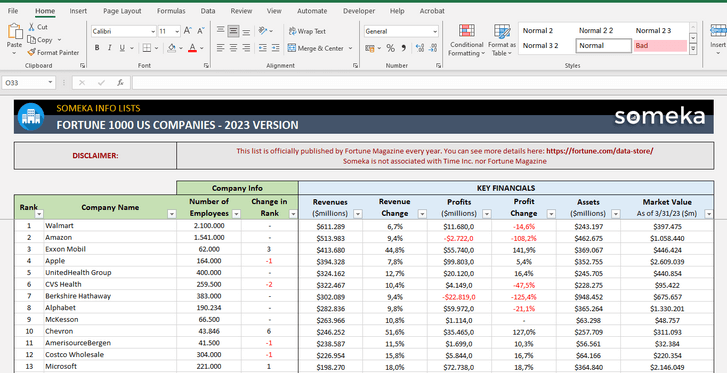
All you have to do is input your data and create dynamic charts, trend lines, calculators, and so on.
So, all the bars and graphics will update automatically.
Why Excel for Data Analysis?
Excel is the most common software in the data analysis world. And that’s no surprise. Here’s why:
- Flexible
- Easy to customize
- Supports a variety of functions
- Powerful in data visualization
- Grid-wise format
- Data analysis tools and features
- Cheaper than many other alternatives
What’s the history behind our Data Analysis Excel Templates?
We know that every single person in work life deals with lots of data. So, we try to create generic data analysis tools for any data type.
We start our data analysis tools with statistical templates such as Histogram makers, treemap chart creators, box and whisker plots, venn diagram generators.
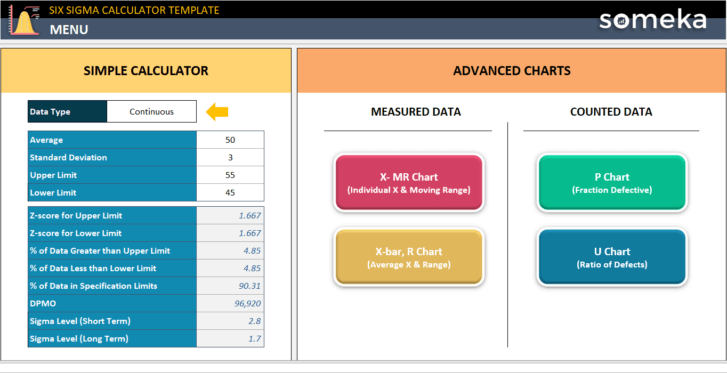
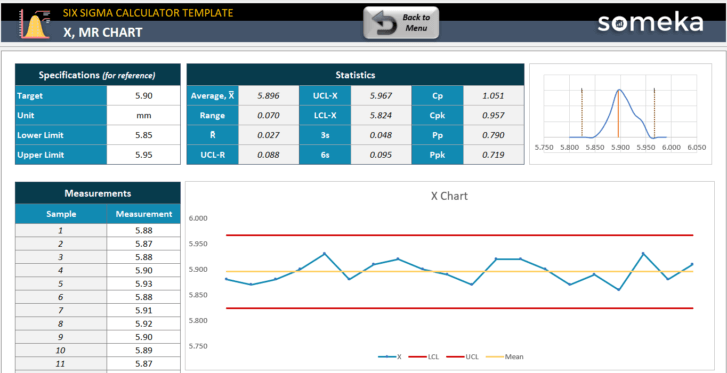
Then, we have also added Pareto Chart creator and six sigma calculator to our analysis portfolio.
Now, we are still in touch with our users and experts to create new tools for other models and statistical calculations.
FAQs
-
Can I customize the templates to fit my data analysis needs?
Absolutely! Our templates are highly customizable, allowing you to tailor them to your specific data analysis requirements.
-
Can I use these templates for both business and academic purposes?
Certainly! Our templates are versatile and can be used for both business data analysis and academic research.
-
Are there templates for specific data analysis needs?
Yes, we offer a wide range of templates for various data analysis needs, including statistical methods and chart types.
These templates have drastically improved our data analysis capabilities.
We now have clear and actionable insights at our fingertips!
Chris Lee – Business Owner, Elite Solutions