Excel Heat Maps
Geographic visualization with Excel Heat Map Templates. Input your data and create heat maps with a button click. No installation needed.
Ready-to-use spreadsheet templates. Sleek-design tools with dynamic dashboards. Instant download files in Excel and Google Sheets.

Ready-to-use spreadsheets for Geographic Heat Maps
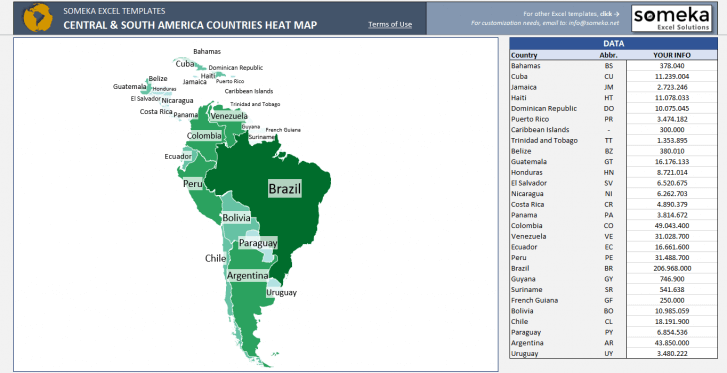
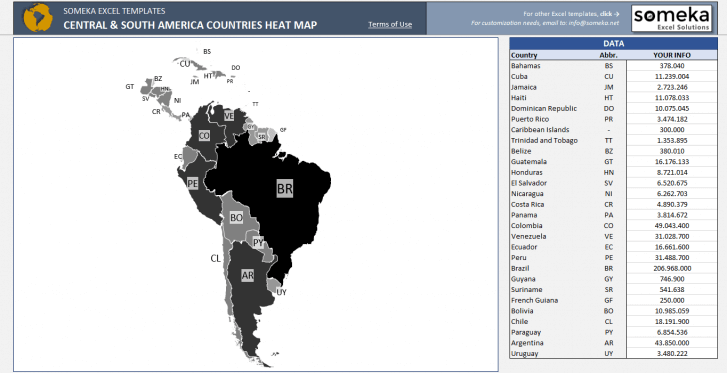
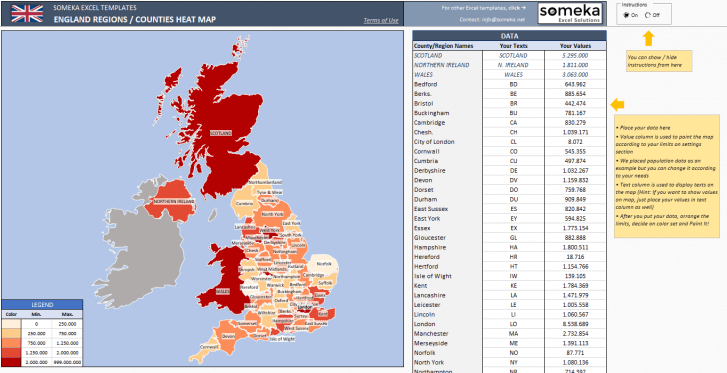
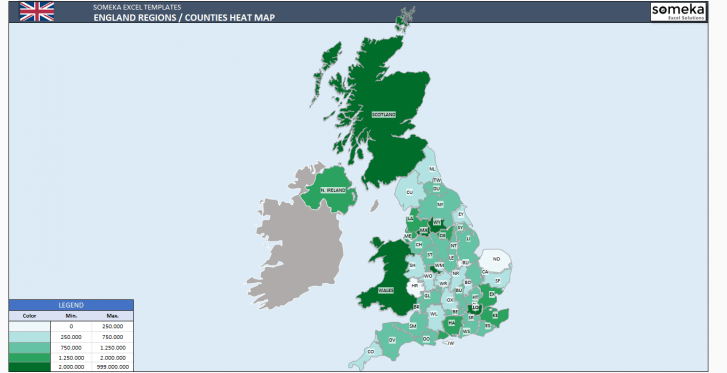
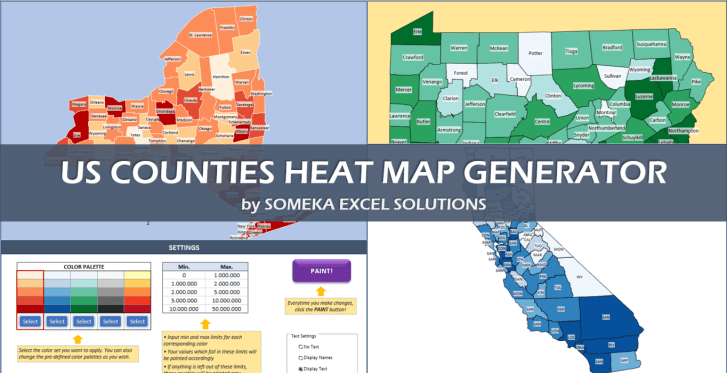
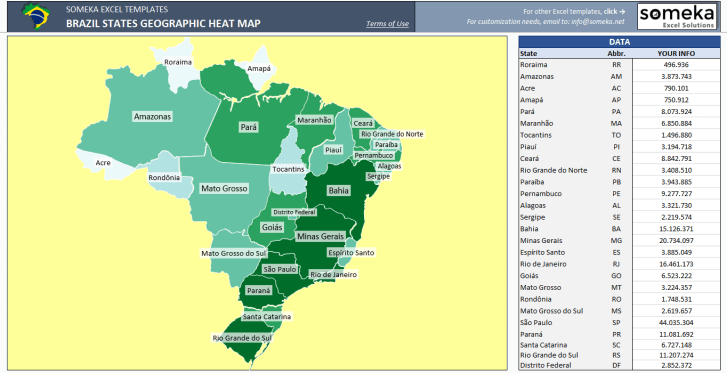
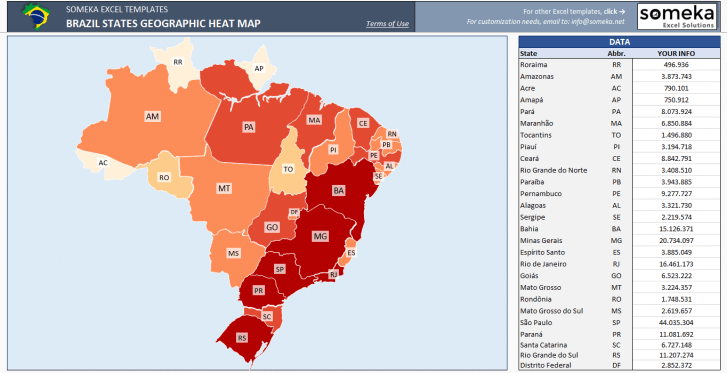
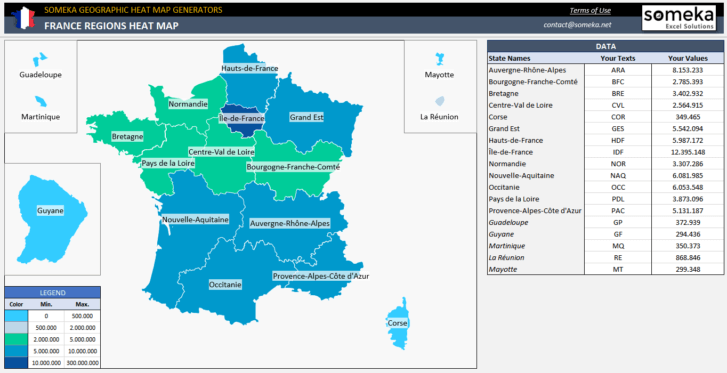
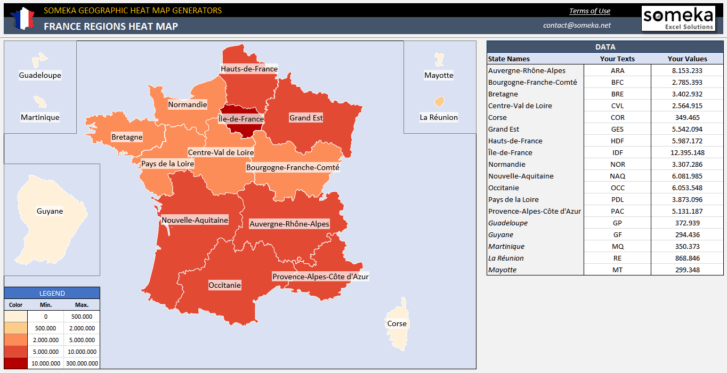
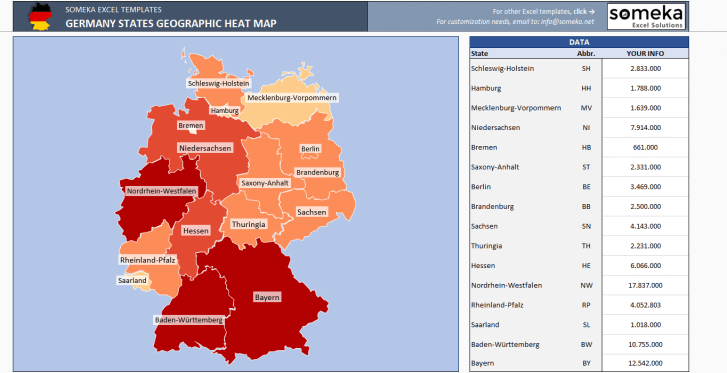
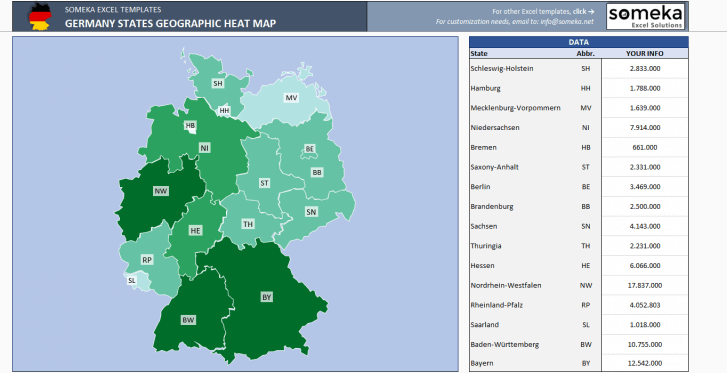
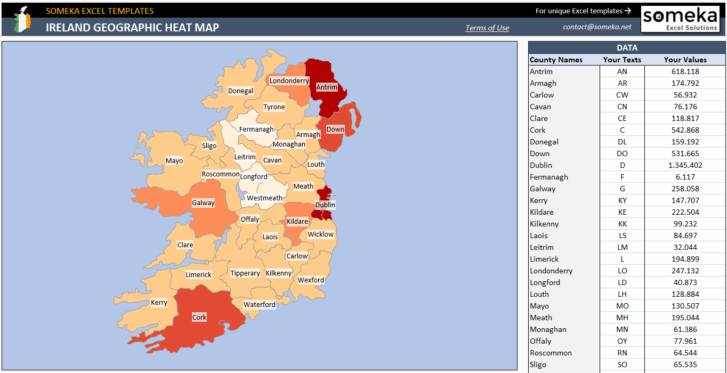
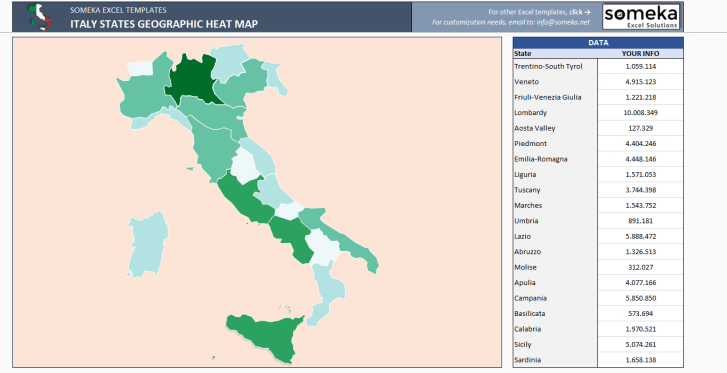
Someka Excel Heat Map templates are special tools to visualize your data in a geographical map. Any academic or business data such as sales, expenses, population, birth rates etc. will be presented in colored maps with a single click!
![]()
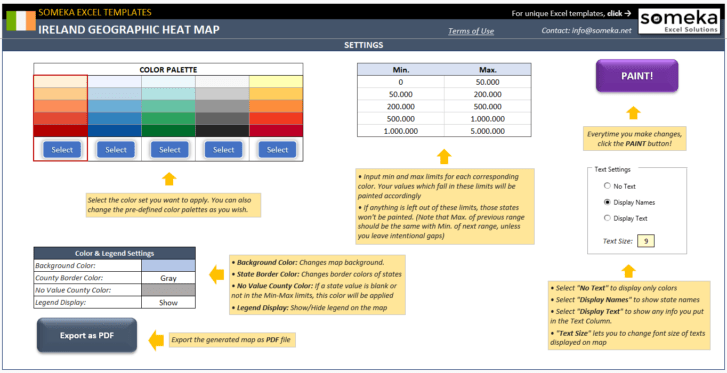
All our Excel heat maps consist of a setting section, where you can adjust your geographic template according to your own needs. No need for any extra software. They all work in Excel.
No more complicated lists. Now present your data with unique mapping tools!
1. For who?
Any kind of data may be visualized in these choropleths. So, everyone from all over the world may use these templates.
- Data Analysts: You can visualize and analyze geographic data to uncover trends and insights.
- Market Researchers: For your market research studies, you can conduct regional analysis and present findings with compelling visuals.
- Sales Managers: As a sales manager, you will track sales performance across different regions and identify areas for improvement.
- Business Owners: Here’s a unique tool to understand geographic distribution of customers, sales, and market potential.
- Marketers: You can analyze market penetration and campaign performance across different regions.
- Consultants: These mapping tools will provide clients with geographic insights and visual reports.
- Academics: You can visualize research data and present geographic trends.
- Government Officials: It’s also possible to analyze demographic data, public service reach, and regional development.
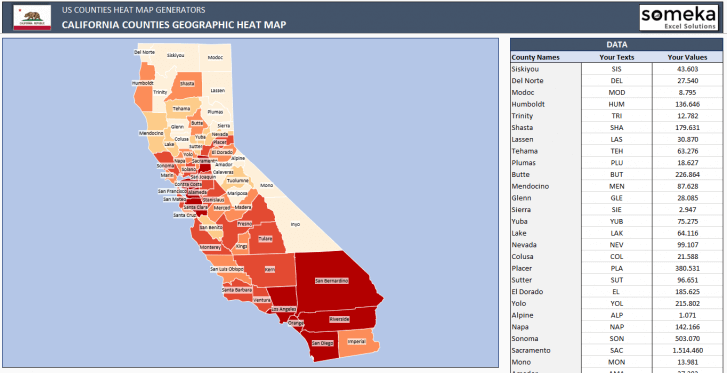
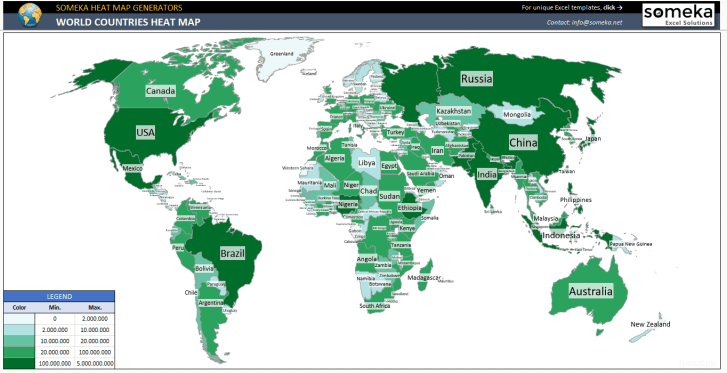
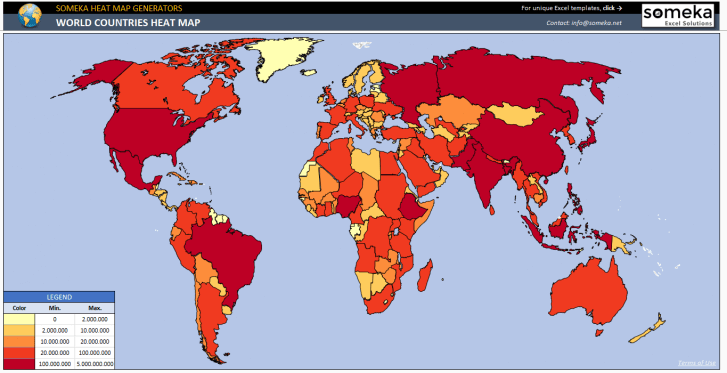
In addition to world map, you can also find country-based regional maps for Africa, Europe, Latin America as well as city-based or state-based maps for US, Australia, Canada, China, India, UK, and much more. Moreover, we have special US Zip Code and US County Heat Map templates for American analysts.
These maps are beyond my imagination.
Congrats to Someka team.
Henry Orwell – Canada
2. Functionalities
Our geographic heat map Excel templates are will help you create visual maps with your data:
- Heat Map Generation: Create geographic heat maps to visualize data distribution and intensity.
- Regional Analysis: Analyze data at various geographic levels, including country, state, and city.
- Customizable Color Scales: Tailor color scales to represent data accurately and effectively.
- Data Input Flexibility: Easily input your data and generate heat maps instantly.
- Interactive Maps: Use interactive features to explore data and gain deeper insights.
3. Benefits
- Customizable heat maps
- Export to pdf feature
- Easy-to-use
- Professional data visualization for your slides
- Suitable for both Mac and Windows
- No installation needed
4. Use Cases
-
- Sales Analysis: Track sales performance by region and identify high and low performing areas.
- Market Research: Conduct geographic market analysis and present findings.
- Demographic Studies: Visualize population distribution, age groups, and other demographic data.
- Customer Distribution: Understand geographic distribution of your customers.
- Public Health Analysis: Track the spread of diseases and public health metrics across regions.
- Educational Research: Analyze and present geographic trends in educational data.
- Environmental Studies: Visualize geographic data related to environmental research.
- Government Planning: Analyze and present data for regional planning and development.Our templates are highly flexible and can be used in various scenarios and needs. Among the most common use cases for our geographic heat map generators.
How to use Heat Map Excel Templates?
These geographic heat map creators are provided in Excel. So, you can start with downloading your template.

Once you download the Excel file, paste your data for each region or zip code area.
Click on the Generate button and your map is ready.
You can also customize your colors, fonts and other mapping features like labels or legends.
Why Excel for Heat Map Creation?
It might be hard to imagine that Excel can create these visual maps. But, yes, it’s possible. And you’ll enjoy all the features of Excel:
- Easily accessible
- Highly customizable
- Supports a variety of functions
- Powerful in data visualization
- Suitable for any data
- Data analysis tools and features
- Cheaper than many other alternatives
- You can add additional tabs
What’s the history behind our Heat Map Generator Excel Templates?
As Someka, we love to bring complex data analysis tools to our customers as simple-to-use worksheets.
The idea of creating heat maps started with this ambition.
We have worked with map visual creators to prepare the base maps. Then with some VBA magic, we have created these customizable tools.
Having very positive feedback from our users, we continue to grow our heat map portfolio with new regions, countries and maps.
FAQs
-
Can I customize the color scales in the heat maps?
Absolutely! You can easily modify the color scales to match your data representation needs and preferences. We give you ready color palettes and you can select any of them.
-
Do these templates work on older versions of Excel?
Yes, we ensure compatibility with older versions of Excel as much as possible. Most of our templates work with Excel 2007 or later.
-
I need help with setting up my template. Do you offer support?
Definitely! Our support team is ready to assist you with any questions or setup issues you may have.
-
Are these heat map templates suitable for both business and academic use?
Yes, our templates are flexible and can be used for both business data analysis and academic research.
These heat maps deserve a Woow!
My boss is really happy with the output.
Jennifer Heathaway – California