Excel KPI Dashboards
Excel KPI Dashboards with interactive trend charts. Preset metrics & editable indicators. Monthly dashboards included.
Ready-to-use spreadsheet templates. Sleek-design tools with dynamic dashboards. Instant download files in Excel and Google Sheets.
Ready-to-use spreadsheets for KPI Dashboards
Do you want to monitor and analyze your key performance indicators (KPIs) with professional and dynamic dashboards in Excel? Then you’ll find professional-looking templates to track all your business metrics and performance indicators seamlessly.
In addition to the basic KPI tracking sheets, you’ll also find comprehensive dashboard models visuals. We also provide templates for specific departments such as sales, marketing, finance, and HR.
For precision and convenience, these templates are built using Excel’s advanced features. Our templates can be a great asset to anyone involved in performance management, whether you manage a small business, work as a data analyst, or are a department head.
1. For who?
Our KPI Dashboard Excel Templates collection includes high-quality tools for executives, managers, analysts, small business owners, project managers, marketing managers, HR managers, financial analysts, and all other professionals responsible for performance tracking and reporting.
- Executives: You can monitor company-wide KPIs and make informed strategic decisions.
- Managers: If you’re on the manager level, then you can track departmental performance and align with organizational goals.
- Small Business Owners: You will stay on top of key business metrics with sleek-design dashboards.
- Project Managers: To track project milestones, deadlines, and overall performance, you can use these dashboards.
- Marketing Managers: You can monitor campaign performance, customer engagement, and ROI.
- HR Managers: As a human resources manager, you’ll be able to track HR metrics.
- Financial Analysts: You can easily analyze financial performance indicators and create detailed reports.
- Investors and Creditors: You can evaluate any business with those KPI dashboards before you make an investment or lend money.
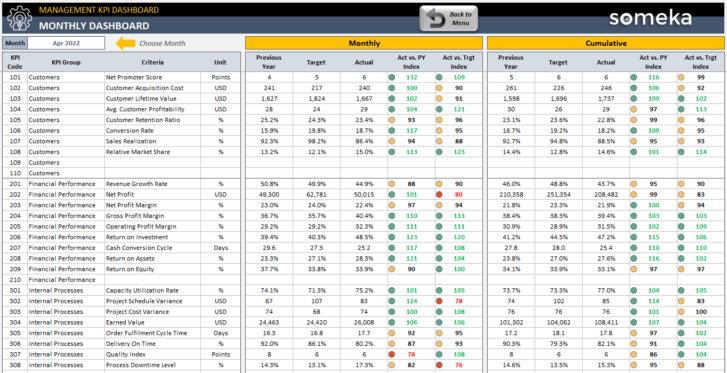
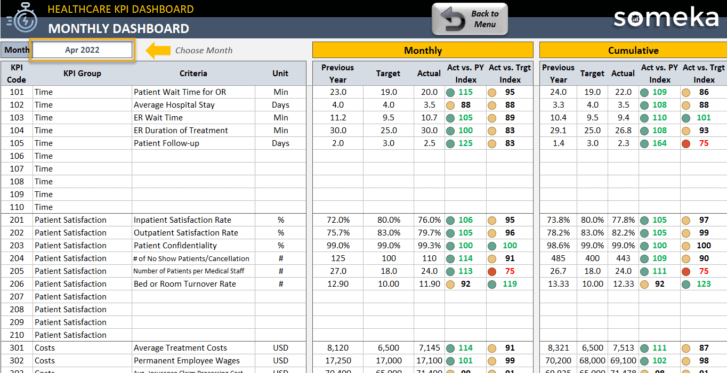
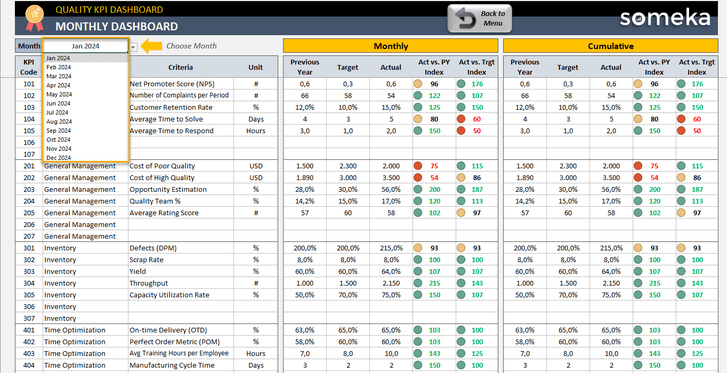
Our KPI dashboards aim to provide you with ready-to-use formats to track monthly and yearly performance metrics.
We’re using Someka KPI dashboards for reporting.
A game changer for our company!
David C. Hall – Innovatech LLC CEO – USA
2. Functionalities
Our KPI dashboard Excel templates are equipped with a range of functionalities to meet your daily needs:
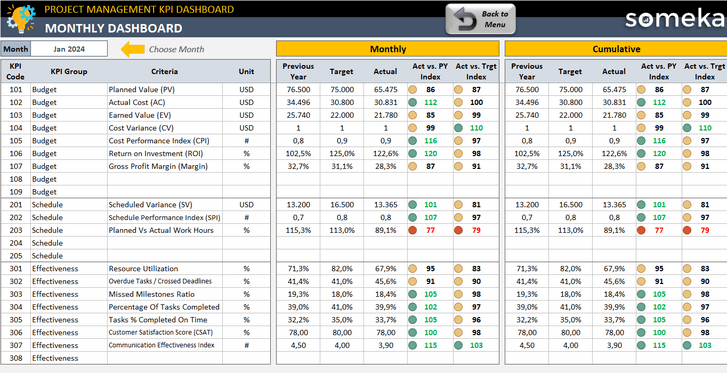
- KPI Tracking: Monitor key performance indicators across various business functions.
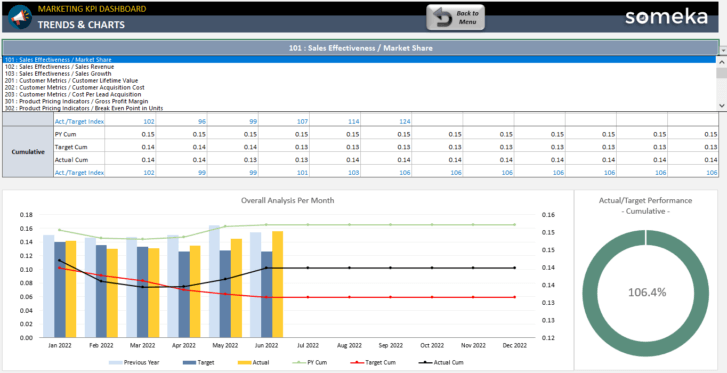
- Preset KPIs: We have already collected the most common metrics for your industry or field.
- Editable Metrics: You can edit or remove existing KPIs, or add new ones.
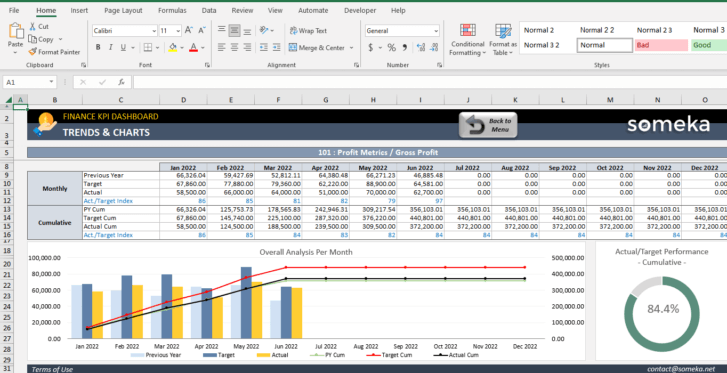
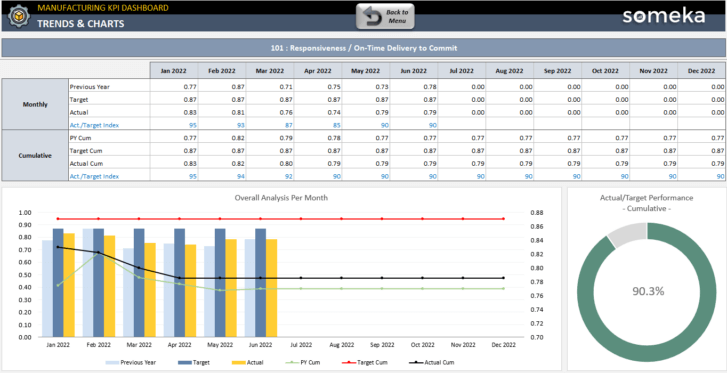
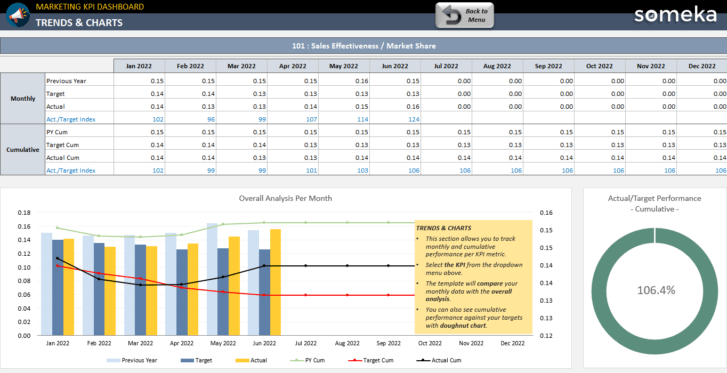
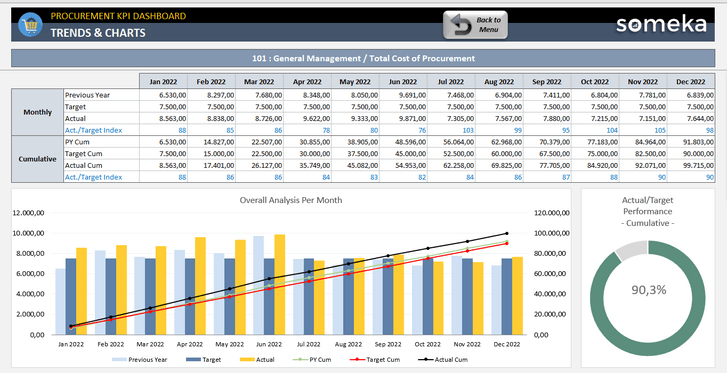
- Data Visualization: Create dynamic charts, graphs, and heatmaps for easy data interpretation.
- Goal Setting: Set and track goals, targets, and performance benchmarks.
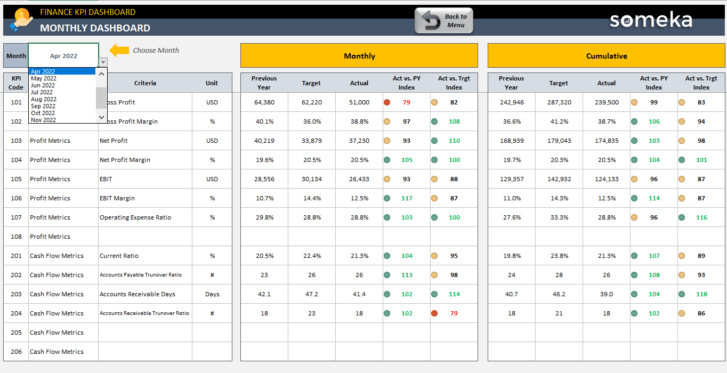
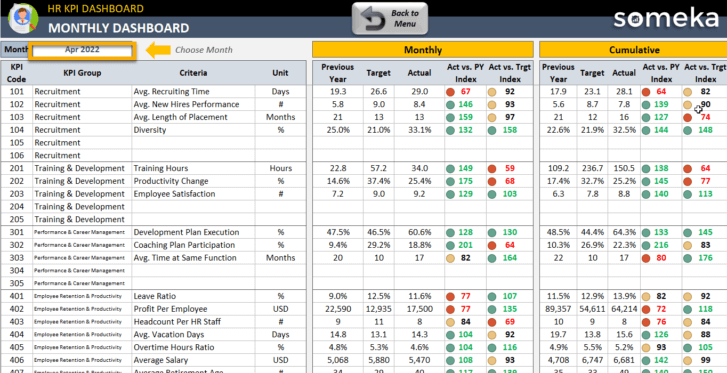
- Department-Specific Dashboards: Track KPIs specific to sales, marketing, finance, HR, and more.
- Monthly Comparison: You can compare your monthly actuals with targets and previous year.
3. Benefits
- Ready for your presentations
- Professional KPI tracking
- Preset and editable KPI metrics
- Sleek-design
- Printable and editable
- No installation needed
- Cover wide range of fields and industries
4. Use Cases
You’ll find a rich collection of KPI Dashboards here. So, you can adapt your performance tracking to one of these specific tools.
- Company Performance Tracking: Monitor overall company performance and strategic KPIs.
- Departmental Performance: Track and report on departmental KPIs.
- Project Management: Keep track of project performance, milestones, and deadlines.
- Sales and Marketing Analysis: Analyze campaign performance, sales data, and customer metrics.
- Financial Reporting: Monitor financial KPIs and create detailed financial reports.
- Employee Performance: Track employee performance, engagement, and HR metrics.
- Company Evaluation: If you’re considering an investment in a business, then you can analyze the operational and menagement metrics with those templates.
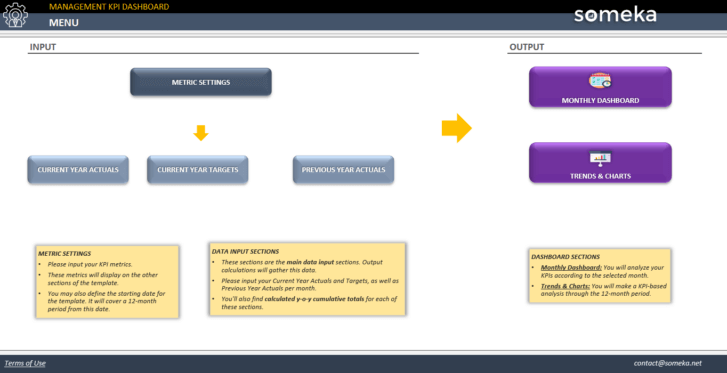
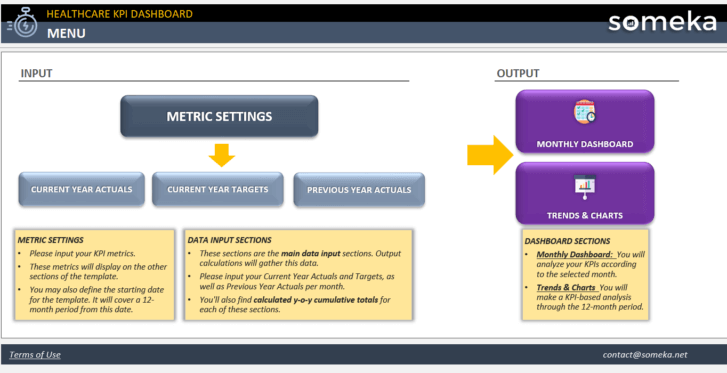
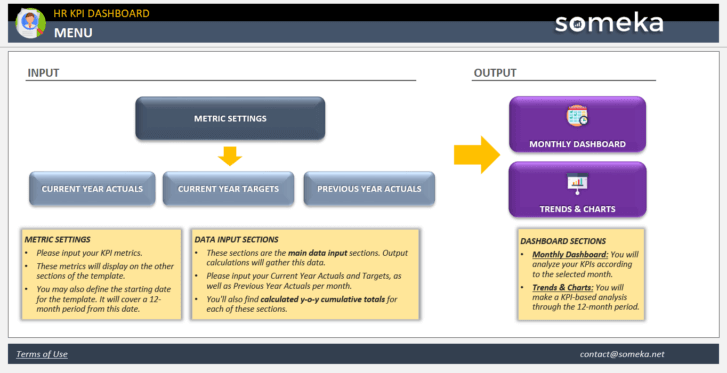
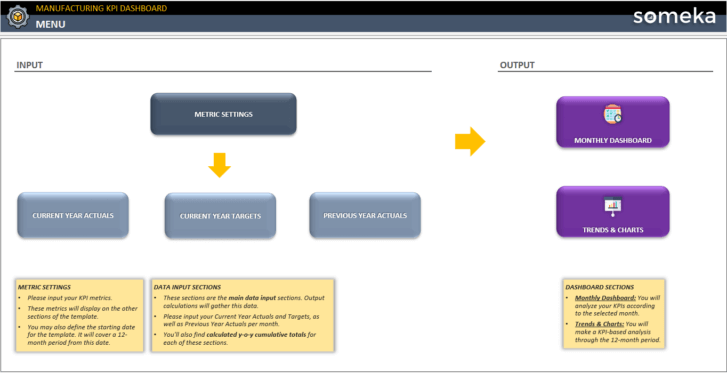
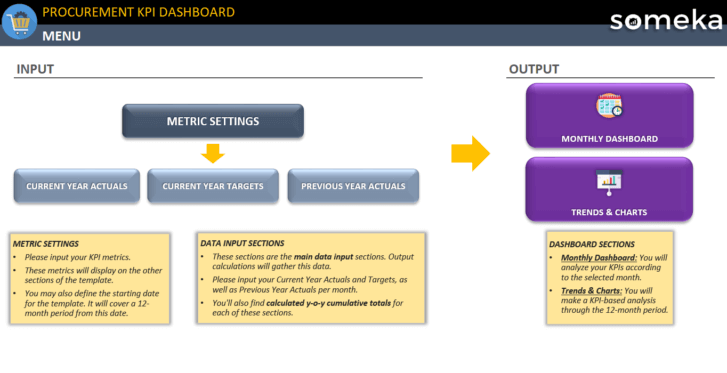
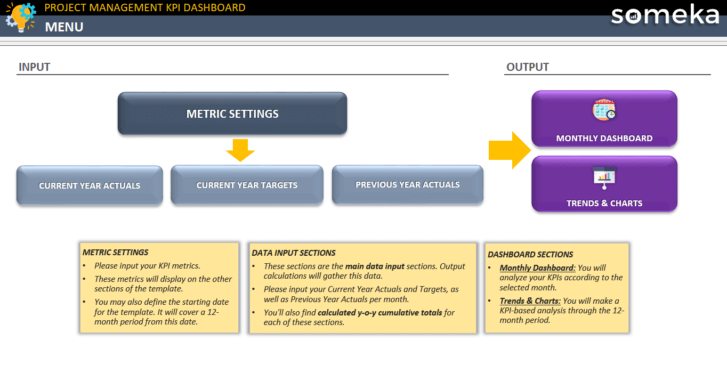
How to use KPI Dashboard Excel Templates?
We provide all our KPI dashboards in Excel with instant download.
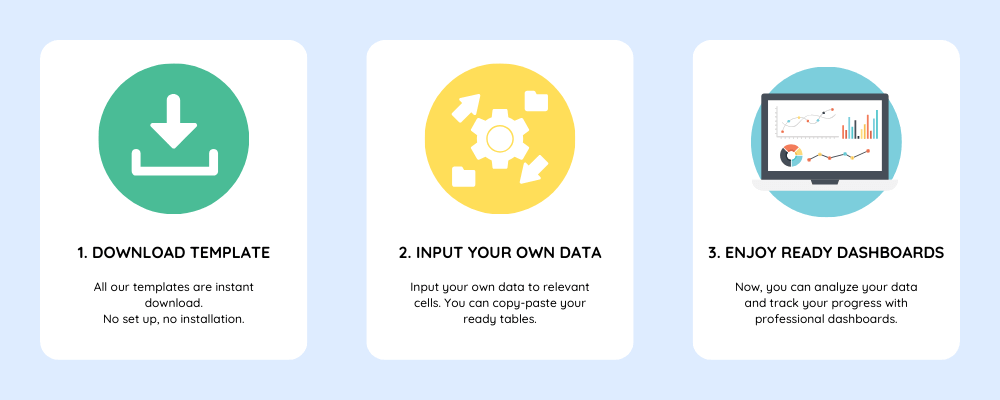
So, you can easily download Excel files to your computer.
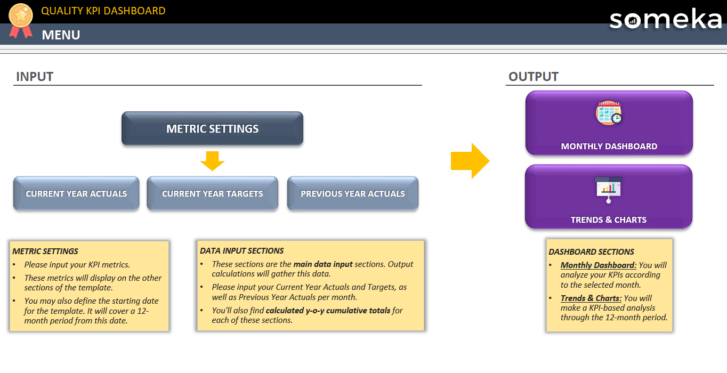
Then, you’ll set up your KPIs and targets for your business. Then, you’ll only input monthly numbers.
All monthly and KPI-based dashboards will update accordingly. You can easily analyze your business with dynamic charts.
Why Excel for KPI Tracking?
Excel is one of the best tools to monitor your performance indicators.
- Easily accessible
- Highly customizable
- Supports a variety of functions
- Powerful in data visualization
- Easy to update
- Data analysis tools and features
- Economical solution
What’s the history behind our KPI Dashboard Excel Templates?
Most our users underline that they like the business know-how behind our templates in addition to the Excel skills. And, yes. Besides all the Excel knowledge in our templates, we also try to provide our users the best practices in the industry for a specific solution.
Someka KPI dashboards are also one of the best example for this. We collect the most common metrics for various fields and provide them with our templates.
You can, of course, edit the existing metrics, but these templates will give you a starting reference.
Also, we try to give you most handy and most beautiful looking reporting features.
FAQs
-
Can I add my own logo to Someka KPI Dashboards?
Absolutely. Our templates are modifiable. So, you can make customizations like changing the logo, colors, font types, etc.
-
How secure are KPI data when using these templates?
Your KPI data is stored on your local device. So, you have the full control over the security. As these templates are in Excel, once you download our template, we do not have any access to your data in any means.
Additionally, we can recommend using password protection on your Excel files for further security.
-
Can I import those KPI Dashboards to PDF?
Surely! We provide our templates ready-to-print. You can easily save these files as pdf and share them with your managers, colleagues, or third-party corporates.
-
Can I use my own KPI metrics?
On these KPI Dashboard templates, we provide you with industry benchmarks. But, you can easily edit or remove them and/or add your own metrics.
What’s nice visualization! Smart and clean.
Jessica L. – Operations Manager, BrightFutures – UK