How to Make a Gantt Chart in Google Sheets? Ultimate Guide
Do you have a hard time creating a simple Gantt chart in Google Sheets or are your reports looking boring? The ultimate guide to making a Gantt schema will cover all your needs!
Table of Content
1. What is Gantt Chart?
2. Why Should You Learn Gantt Chart?
3. How to make a Gantt Chart in Google Sheets?
4. Automatic Gantt Chart Template
5. Conclusion
6. FAQs
1) What is Gantt Chart (WBS)?
First of all, Google Sheets is one of the most popular spreadsheet apps in the business. And, Google Sheets has tons of features and Gantt chart (WBS) creation is one of them.
Secondly, the Gantt chart aka WBS is basically a project timeline map on a spreadsheet. It is a nice way of visualization of project schedules. Hence, the Gantt chart gives a clear view of the project’s timeline and tasks. Also, the Gantt chart is made of bars and each bar represents a task timeline. It is useful for projects with many different tasks such as construction.
2) Why Should You Learn Gantt Chart Google Sheets?
At this point, Google Sheets files allow you to reach your cart from any device and let you control by many people at the same time. It is a great option for project managers.
Afterward, Gantt schema, helps you to track your project team and their timeline easily. In this manner, you can get a general idea about tasks and their timelines through any device at any time!
Additionally, a simple Gantt Chart in Google Sheets gives you flexibility and helps you manage resources better.

3) How to Make a Gantt Chart in Google Sheets?
Let’s see gantt chart making steps in Google Sheet:
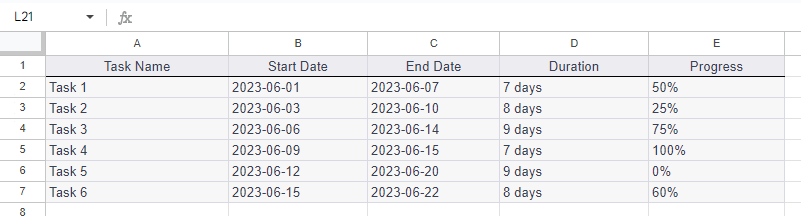
Step 1: Prepare Start and End Dates
Firstly, you should enter your tasks, start, end date, duration, and progress.
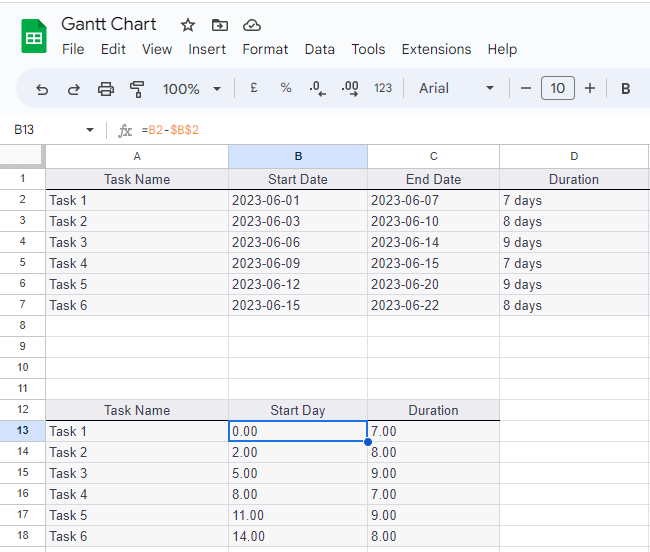
Step 2: Calculate the Durations
After you write all the necessary data, now let’s adjust it! So, we should calculate the start day and duration and how far other tasks are from the start date.
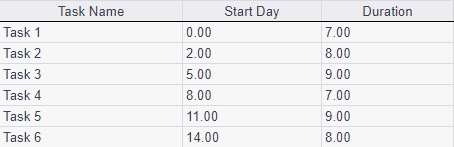
Step 3: Chart Data
When you are done with all the calculations, you’ll have the necessary data to create a Gantt chart. Besides, we choose task 1’s start date as the first day that the project starts.
Step 4: Insert chart
Now, you should pick the task name, start day calculation, and duration. Then, click the insert and chart buttons.
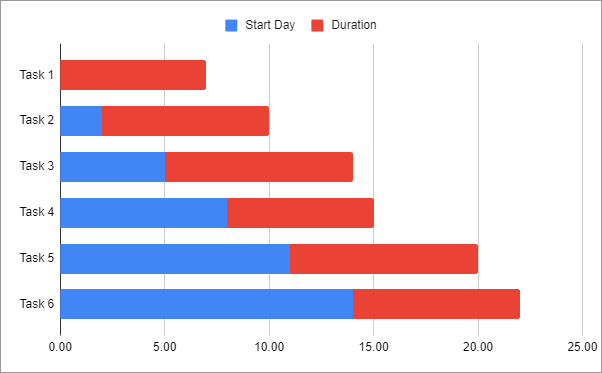
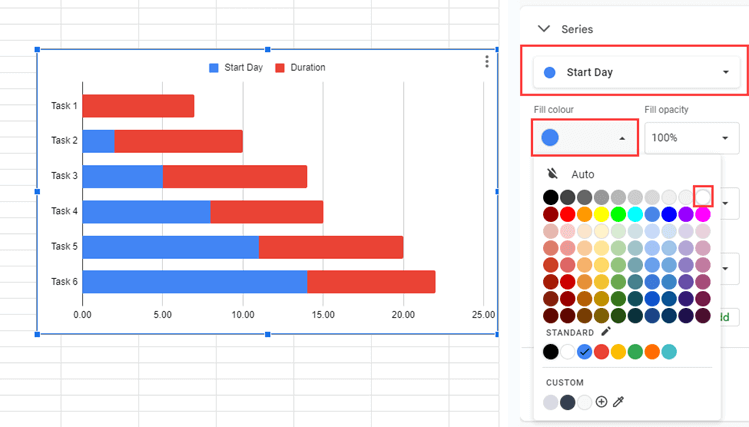
Step 5: Manipulate the chart
The next thing you need to do is, change the color of the starting day calculation.
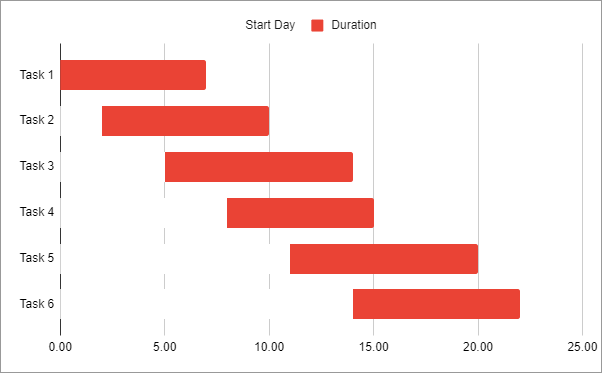
You’ll have the result just like this:
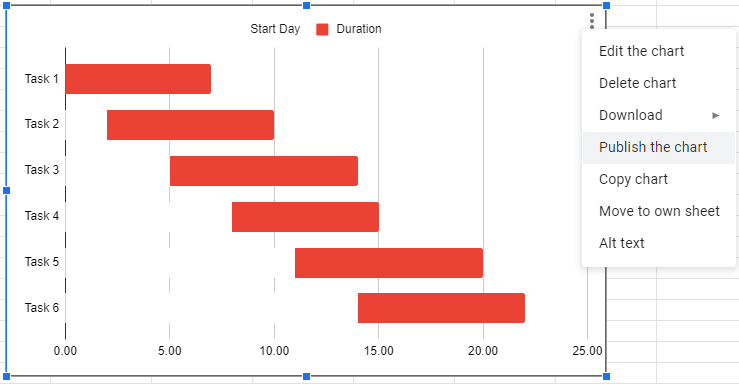
Step 6 – Share your Gantt Schema
Now, to share your Gantt view, click on the three dots on your chart and select Publish the Chart option.
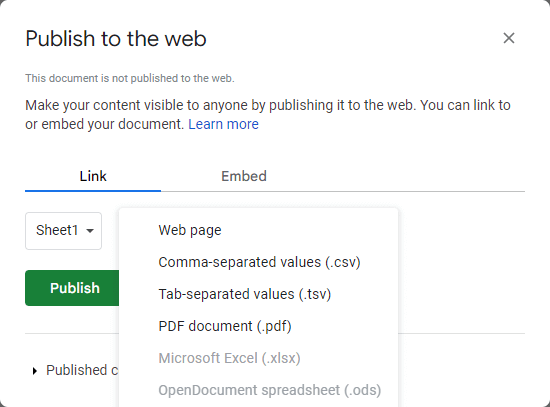
You can publish it to web as web page, csv file, tsv file or pdf file.
4) Automatic Gantt Chart Template
The Gantt schema that we explain is one of the easiest Gantt schemas you can make. If your project has several tasks with different timelines and other necessities, there is an easier way for you! Someka’s Gantt Schema Google Sheets Template can cover many different things such as employees, departments, timelines, importance, progress, phase, milestone, sub-tasks, calendars, and many more!

– This diagram is created on Gantt Chart Google Sheets Template by Someka –
You can do more than follow the timeline on Online Google Gantt Chart Template. You can adjust task plans and assign a person
A detailed calendar gathers all the timeline information and adds the dates. So, you can follow up with every task pretty easily.
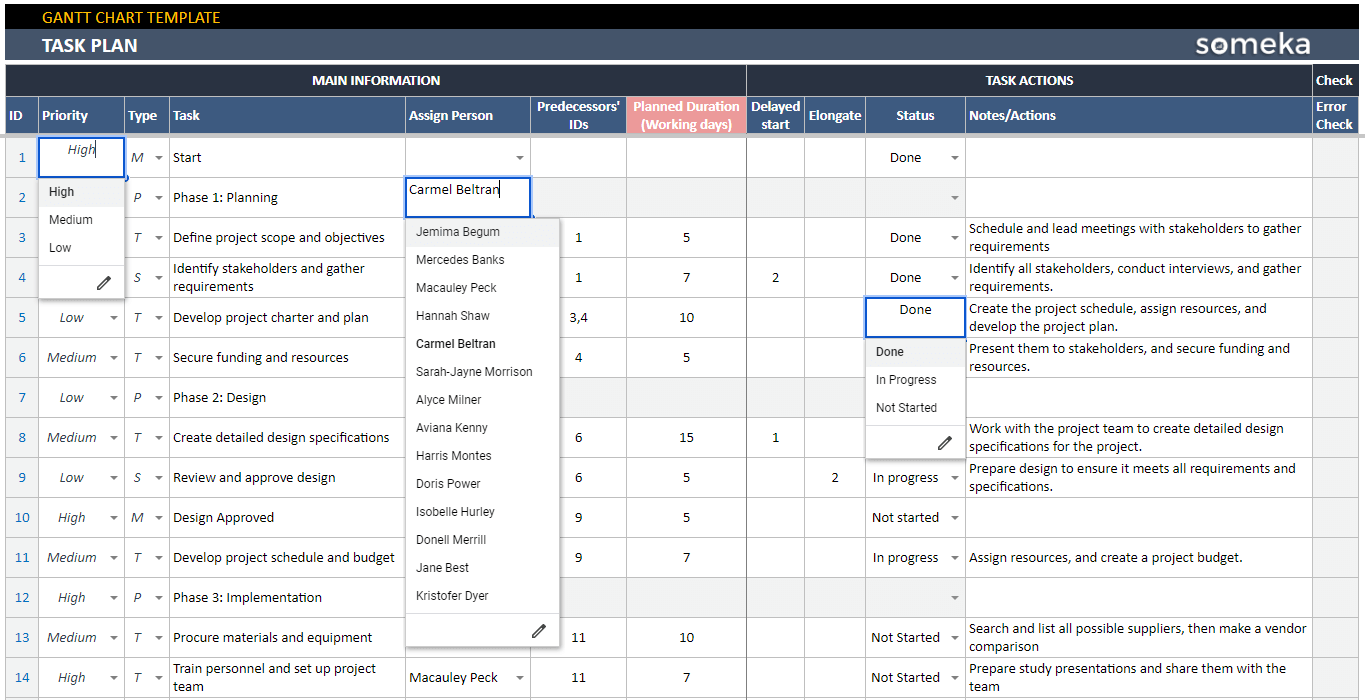
Also, priority and status bars make every task special for its uniqueness.
5) Conclusion
As I have mentioned, Google Sheets is one of the most popular programs available on the internet. It is completely free and has pretty good features. That’s why project management plans like the Gantt schema is getting popular in Google Sheets. Also, you can easily reach these programs from any device.
If you prefer Microsoft Excel files, then you can also download Excel Gantt Chart Maker, which is also fully ready-to-use.
On the other hand, most projects have several steps that project managements need to follow all the time but it is so time-consuming and tiring. Also, follow up with every task is harder than ever. In this manner, project management tools such as the Gantt schemas are getting popular day by day. Currently, the most important thing a project manager does is follow every task through departments so the Online Google Gantt chart (WBS) makes this task much easier than manual following.
6) FAQs on Google Sheets Gantt Chart
1. Do Google Sheets have a Gantt Chart Template built in?
Google has no built-in Gantt Chart. But you can manipulate some built-in charts to look like Gantt view. Or, you can use Someka’s Online Google Gantt Chart Template for a ready-to-use solution.
2. How do I create a calendar in Google Sheets?
Firstly, create a new spreadsheet on your Google Sheets. Then, write the Days, Weeks, and Months. You can create it from scratch or you can use a ready-to-use calendar template.
3. Does Google Have a Gantt Chart?
No, Google has not a tool for the Gantt schema but there is 3rd party tool that will cover your need or you can just prefer to use ready to use template.
Recommended Readings:
How to Make a Gantt Chart in Excel?
Related Posts