How to Create a Profit and Loss Statement in Excel? Step-by-Step Guide
With this step-by-step guide, we will explain how to create a profit and loss statement in Excel from an expert point of view. You’ll find examples, images and explanatory cases in addition to a free template for this important financial statement in the following sections.
Let’s start then!
Table Of Content
1. What’s a P&L Statement?
2. Free Profit and Loss Template in Excel?
3. Is P&L the same as income statement?
4. What is the Formula for a Profit and Loss Statement?
5. How to Create a Profit and Loss Statement in Excel?
6. Conclusion
1. What’s a P&L Statement?
One type of financial report is the Profit and Loss (P&L) statement. It provides an overview of earnings, outlays, and costs for a given time frame.

So, businesses need this tool because it shows their financial health. Alos, determining a company’s profitability facilitates decision-making. Thus, P&L statements are a common tool used by key stakeholders to assess a company’s performance.
2. Free Profit and Loss Template in Excel
If you want to start using a ready-made template now, you can download our Profit and Loss Statement Template in Excel:
- Ready-to-use
- Instant download
- Printable
- Sleek-design
- Analysis dashboard with charts and tables
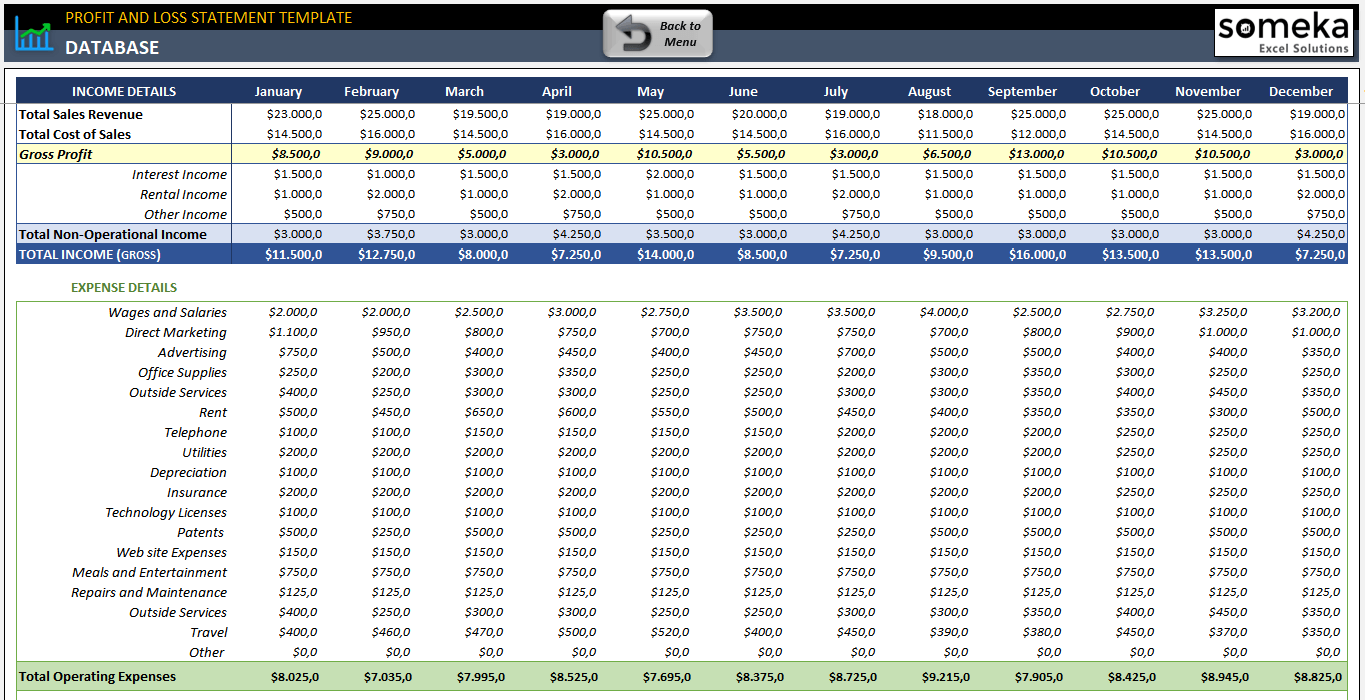
– This is a screenshot from Someka’s Profit and Loss Statetement Excel Template –
In summary, compared to starting from scratch to create a P&L statement, this method saves time and minimizes errors.
3. Is P&L the same as income statement?
Yes, an income statement and a profit and loss (P&L) statement are nearly identical. In the world of business and accounting, both terms are frequently used interchangeably.
The income statement, also known as the P&L statement, gives an overview of a business’s receipts, outlays, and gains or losses for a given time frame.
4. What is the Formula for a Profit and Loss Statement?
The formula for a Profit and Loss (P&L) statement is straightforward yet powerful. It can be summarized as:
- Total Revenue: This is the sum of all income sources. It includes sales, service income, and any other revenue streams.
- Total Expenses: This encompasses all costs associated with running the business. It includes operating expenses, cost of goods sold, salaries, and overheads.
So, the difference between these two figures yields the Net Profit or Net Loss. This straightforward equation is the foundation of financial analysis and decision-making and captures the essence of a P&L statement, giving a clear picture of a company’s financial situation.
5. How to Create a Profit and Loss Statement in Excel?
If you want to create a profit and loss statement from scratch, then let’s start our step-by-step guide:
Step 1: Prepare your worksheet
Firstly, you can start by giving a column for Income and Expense Item Names, and an additional 12 columns for the months. In this tutorial, we’ll explain a yearly income statement. But if you can easily make monthly, quarterly, or even daily P&L Statement with just changing the time intervals.
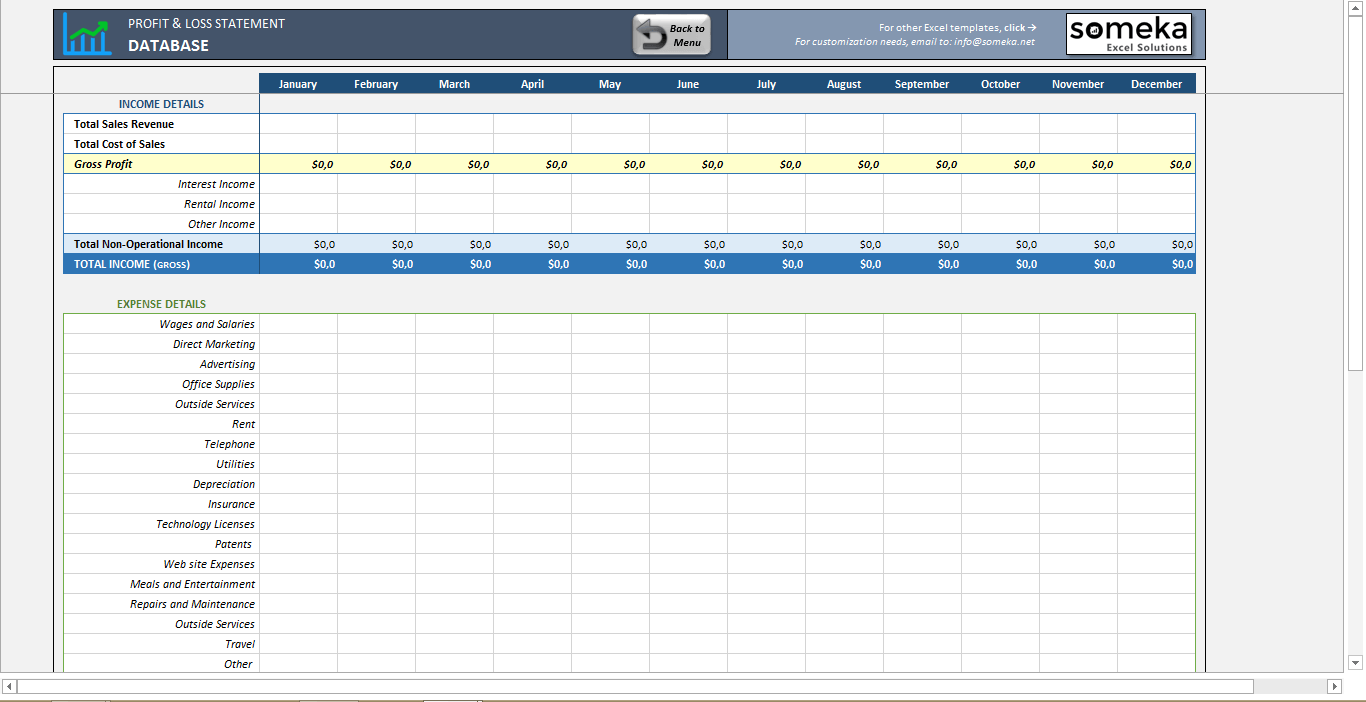
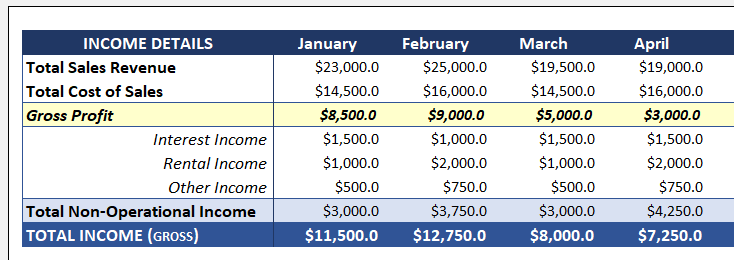
Thus, this image above shows how your income table will look like at the first place.
Step 2: Calculate Gross Profit
First you’ll write down your total Sales Revenue and Total Cost of Sales. You can make a breakdown of your sales if you need to, such as Product Sales Revenue, Service Sales Revenue, and so on.
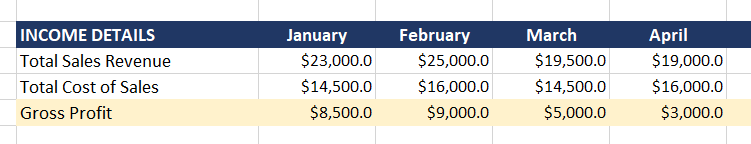
Then the difference between the total revenue and costs from sales will give you the Gross Profit.
Step 3: Gross Income Calculation
Compute the gross income after the gross profit calculation. So, this represents the entire income before any subtraction. Add up all of your revenue sources in Excel.
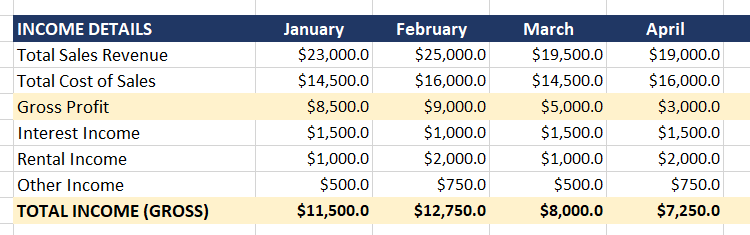
Now you’ll here add Non-Operational Revenues such as Interest Income, Rental Income and other additional income types. Thus, now you have calculated your Total Gross Income.
Step 4: List Down Your Expense Details
Enter all of your business expenses in Excel at this step. Add expenses for things like utilities, supplies, salaries, and rent.
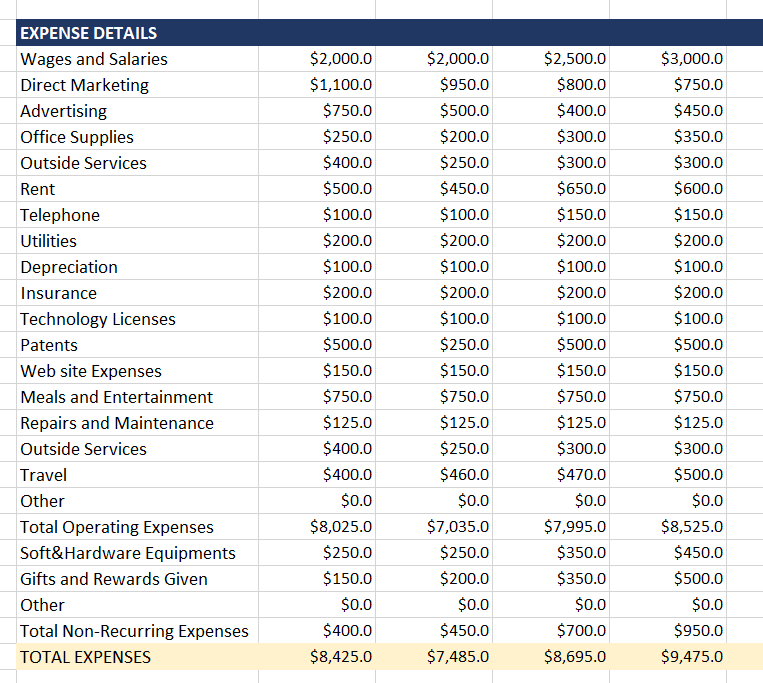
Maintaining accurate expense records is essential to financial security. Understanding where money is spent is aided by this step. It is necessary for financial planning and budgeting.
You’ll add all your expenses at the bottom of your cost table and find your Total Expenses.
Step 5: Tax Calculation
A P&L statement cannot be complete without tax calculations. Calculate taxes in this step using the applicable rates and your income.
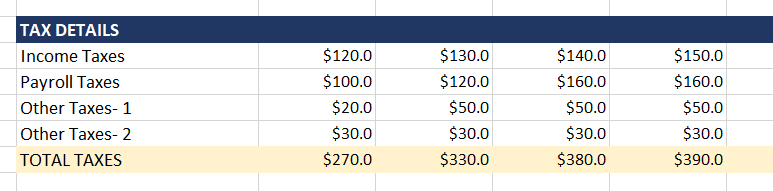
Apply the appropriate percentage to your taxable income in Excel. Legal compliance is ensured by accurate tax computations. They also give a realistic picture of net profits following tax liabilities.
Step 6: Calculate Net Income
After deducting all costs, including taxes, from gross income, net income is determined.
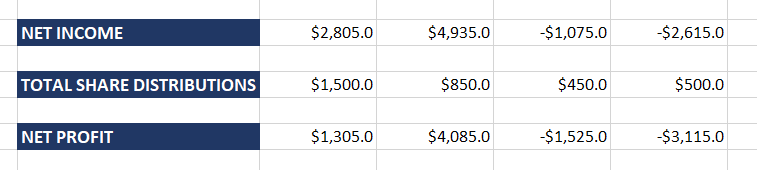
This is an important step in how to create a profit and loss statement in Excel. After deducting expenses, net income shows how profitable the business is. This number is a crucial gauge of performance and financial health.
Step 7: Calculate Net Profit
The last number in the P&L statement is net profit. It is calculated by deducting the gross income from all deductions.
This calculation shows the company’s financial success in Excel. Profitability is essential to stakeholders. It proves how successfully the company can turn a profit.

Step 8: Formatting Your Excel File
Now we have completed the calculation areas, and it’s time to format our Profit and Loss Statement in Excel. With some very basic steps, you can give your income table a more professional look:
>> Background Colors for Calculated Areas:
To draw attention to totals and subtotals, use different colors. This visual differentiation facilitates rapid analysis.
For example, in the above table you can easily understand that the yellow and blue colors are for the calculated areas, and the user will only use the white areas to input data.
>> Negative Value with Cell Formatting:
Open cell formatting dialog box and format negative values, typically in red. This makes it easier to spot losses or performance dips right away, and mostly forgotten on how to create profit and loss statements in Excel.
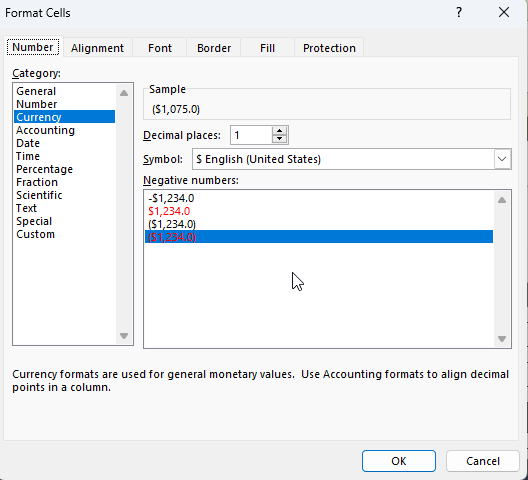
>> Decimals:
You can also configure your decimal settings on the Format Cell dialogue box.
For a neat, polished appearance, make sure the decimal places are consistent. For financial reporting to be accurate, this precision is essential. However, be sure that you’re not using too much decimals, as this will prevent a clean view on your table.
Step 9: Data Input and Analysis
Finally, the last phase entails careful Excel data entry and analysis:
-
Monthly Values:
Firstly, enter financial information every month. You can make this yearly, daily or quarterly if you need.
-
Dynamic P&L Monthly Summary Table:
Then construct a table that updates on its own whenever new information is added.
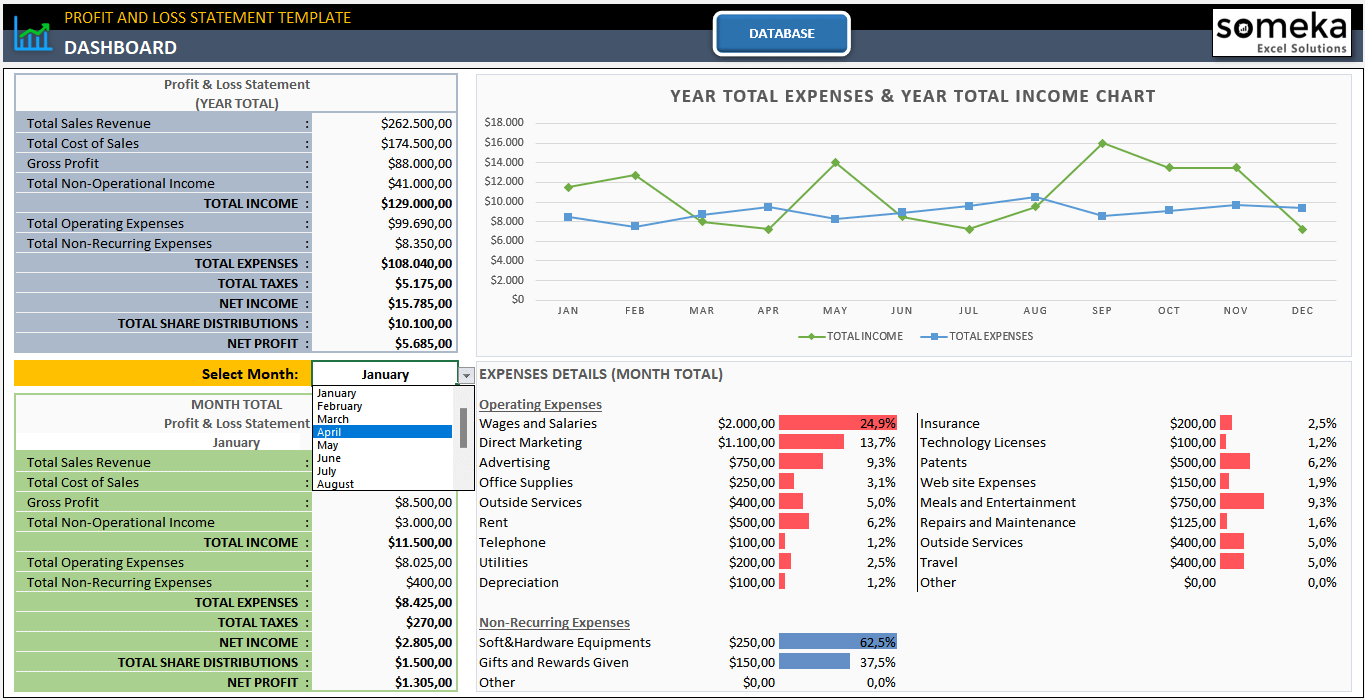
– This is the Dashboard section of Someka P&L Statement Template with Monthly Summary, Income-Expense Chart and Expense Breakdowns –
So, you can add a drop-down menu for months so that the table updates when you change the analysis period. Thus, this dynamic summary gives a brief rundown of the financial results over the years.
-
Income and Expense Chart:
Also, you can add a simple line chart to compare income and expenses in a clear visual picture. This will also give you an insight about how your expenses and income change throughout the year. So it is a trend analysis tool to understand your financial situation.
-
Expense Breakdown:
Lastly, you can use Conditional Formatting to add comparison bars for your expenses. This will help you understand the distribution of funds, which may in return facilitate cost-cutting and budget optimization techniques.
6. Conclusion: How to create a Profit and Loss Statement in Excel?
An essential ability for efficient money management in Excel is the creation of a profit and loss statement. This methodical tutorial on how to create a profit and loss statement in Excel aids in creating a thorough income table in both technical side and the business know-how side.
Excel’s flexible features make financial tracking easier to do and more accessible to everyone. So, Microsoft Excel is a great tool to keep your financial statements. You can find below financial tables in our portfolio with ready-to-use templates:
Making educated business decisions requires that the P&L statement be updated and reviewed on a regular basis. So do not forget to update your income table and other financial statements regularly.
Recommended Readings:
Balance Sheet: Definition, Examples, Templates in Excel!
20 Most Asked Excel Job Interview Questions for Financial Analysts
Related Posts


