How to Make a 9 Box Grid in Excel? A Step-by-Step Guide
Have you heard about 9 Box Grid Model? If you’re in human resources, your answer is probably “Yes, of course”. This nine box format is one of the most common talent management tools. But do you know how to make a 9 box grid in Excel?
This guide will explain you how to create 9 box quadrants with step-by-step instructions. And good news, you do not have to be an expert to create charming diagrams.
2. How to Make a 9 Box Grid in Excel?
- #Step 1: Open Excel and Create a Blank Worksheet
- #Step 2: Prepare Your Data
- #Step 3: Rate your employees
- #Step 4: Prepare Your Score Table
- #Step 5: Calculate 9 Box Scores
- #Step 6: Define the categories for each employee
- #Step 7: Create 9 Box Table
- #Step 8: Create a Scatter Plot
- #Step 9: Customize the chart
5. Ready-to-use 9 Box Solutions
Let’s start!
1. What’s 9 Box Grid?
The 9 Box Grid is a flexible talent management tool. It basically categorizes your employees into nine different groups according to their performance and potential levels. So you’ll have a clear view about the overall potential-performance levels of your team. And this will, in return, help you to organize your talent management, training and succession planning activities.
2. How to Make a 9 Box Grid in Excel?
Here’s a step-by-step guide to create 9 box quadrants in Microsoft Excel.
#Step 1: Open Excel and Create a Blank Worksheet
Launch Microsoft Excel and open a new, blank worksheet. You’ll use this worksheet to build your 9 Box Grid.
#Step 2: Prepare Your Data
Before you can create a 9 Box Grid, you need to gather the necessary data.
This typically includes two key metrics: employee performance and employee potential. You can add additional info like Department, Position or Age of the employee to track your full team. This is optional, though.
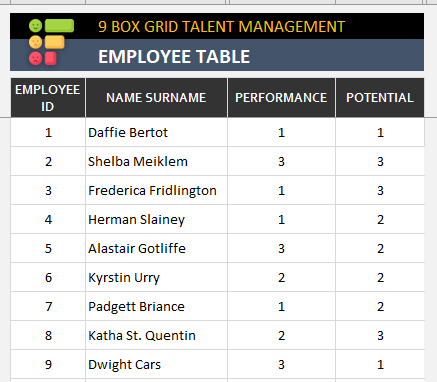
#Step 3: Rate your employees
You’ll give ratings to each of your employees according to their performance and potential levels. Here, you can use 1-3 scale for an easy understanding of the grid.
Here’s an example of how your data might look:
#Step 4: Prepare Your Score Table
According to the scale you use, you can create a score table. This will be used to categorize your employees.
Below is an example of a 9 Box Grid score table:
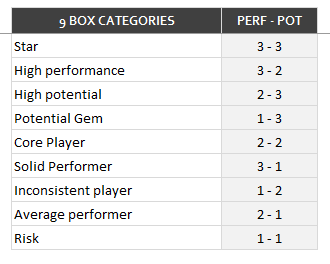
How to read this table? For example the employees getting 3 points for performance and potential will be labeled as “Stars”, while employees having rating 1 for Performance and 3 for Potential will be labeled as Potential Gems.
This is a standard naming for each quadrant of the 9 box formats. But, you may feel free to use other namings according to the needs of your business.
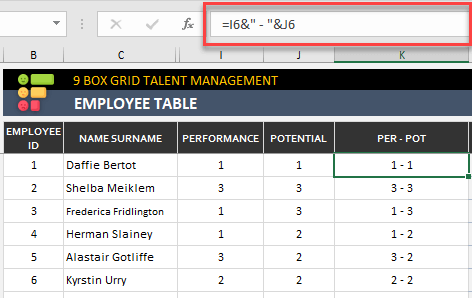
#Step 5: Calculate 9 Box Scores
You will calculate the overall scores of your employees. Here we recommend you to combine Performance and Potential levels of your employees with a simple formula:
#Step 6: Define the categories for each employee
Now you should define the labels for your employees. A simple INDEX-MATCH formula will be helpful here. You’ll use your 9 Box Score Table and match the employee scores to the category names:
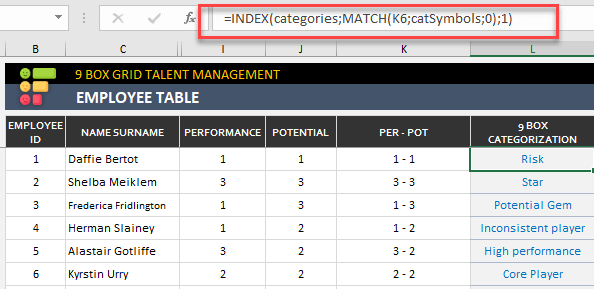
Now your database is ready!
You can both create 9 Box Grid tables and Scatter Plots to analyze your team.
#Step 7: Create 9 Box Table
Below is an example of a how a 9 Box Table will look like:

– This nine-box format is from 9 Box Grid Excel Template by Someka-
You can use different color palettes or fonts here to design your table according to your needs.
Then place all your employees on the table. You can make this manually, or use INDEX-MATCH formula to extract all your employees from your database list.
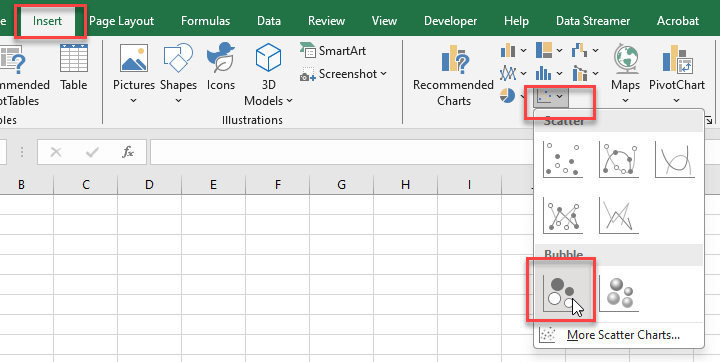
#Step 8: Create a Scatter Plot
This plot will show you the general overview of your team. Here you should first calculate how many employees there are in each group.
Now you have a list for categories and the number of people in each category. You can also add color coding, for example, green for high performers, yellow for medium, and red for low.
Select the data in this table. Then, go to the “Insert” tab and choose “Scatter” from the chart options. Select the scatter plot type.
#Step 9: Customize the chart
Once you’ve created the scatter plot, you’ll need to customize it to turn it into a 9 Box Grid.

– This is the Dashboard of 9 Box Grid Excel Template created by Someka –
Here’s what you can do:
- Add Data Labels: Click on the data points to add labels (employee names) to each point on the chart.
- Adjust Axes: Customize the X and Y axes to match your rating scales (e.g., from 1 to 5).
- Add Gridlines: Insert gridlines to create a 3×3 grid, dividing both the X and Y axes into three sections each.
- Label the Quadrants: Add labels to each quadrant of the grid: High Potential, High Performance; High Potential, Low Performance; Low Potential, High Performance; Low Potential, Low Performance.
Adding a Grid.
Now your 9 Box Grid is ready!
3. Reporting and Sharing
After creating your 9 Box Grid table and plot in Excel, you can easily prepare reports on them.
You can use Copy-Paste methods to convert them other applications like Microsoft Word or Google Docs.,
 10. What Are 9 Box Alternatives?
Or you can easily extract your Excel file to PDF. On the top menu go to File > Save As Adobe PDF to turn your excel file into PDF report. Now your reporting is ready for sharing via email, intranet systems, or other sharing platforms.
4. Tips and Best Practices: How to Make 9 Box Grid in Excel?
In order to prepare clear, nice-looking and easy-to-analyze 9 Box grids in Excel, here are some tips from our experts:
- Keep the grid simple and user-friendly
- Regularly update the grid to reflect current assessments
- Use the grid as a starting point for discussions with employees about their career development
- Use a color palette suitable for your corporate identity
- Turn off your gridlines to get a clearer view
5. Ready-to-use 9 Box Grid Solutions
9 Box Grids are very important part of talent management activities for HR professionals. In this guide, our developers have prepared a step-by-step guide for you.
But if you do not want to go all through this, we have also ready-to-use solutions for that. Below is a tutorial to show how our tool works:
In order to create hassle-free reports, download our 9 Box Grid Excel Template and create your own plots in minutes. Or if you need an online solution, you can also try our 9 Box Talent Management Template in Google Sheets.
Hope you find this article useful!
Recommended Readings:
Related Posts


