How to Calculate Total Revenue in Excel? With Examples and Template
A key part of business analysis is figuring out an organization’s total income. Definitely, Excel is the best tool to calculate total revenue for any business. In this article, we’ll walk through revenue calculation and explain formula for total revenue in excel.
Table Of Content
2. Types of Revenue and Their Formulas
3. How to calculate total sales revenue in Excel?
4. How do you decide on which Excel formula to use to find total revenue?
5. Ready-made Sales Report Template
1. What’s Total Revenue?
Total revenue is the total amount of money that a business makes from its main activities. It’s found before any expenses are taken out, and it’s a key part of evaluating performance and talent in financial jobs.

Businesses can figure out how well they’re doing in the market and how efficient their sales are by looking at their total income. The formula for total income in Excel is very important for turning raw data into useful information that shows how well the business is doing financially. Calculating the total revenue will be also your first step for break-even analysis.

2. Types of Revenue and Their Formulas
There isn’t a single way to figure out income in Excel; it depends on the type of revenue being looked at. For correct performance calibration in financial analysis, you need to know about these types.
2.1. Incremental Revenue Formula
When a business does something or makes a choice that brings in more money, that’s called incremental revenue. Most of the time, the method involves finding the difference between the total amount of money made with and without the action.
Example:
Let’s say a company decides to launch a new marketing campaign. Before the campaign, their monthly revenue was $20,000. After launching the campaign, the monthly revenue increased to $25,000.
Incremental Revenue = $25,000 − $20,000 = $5,000
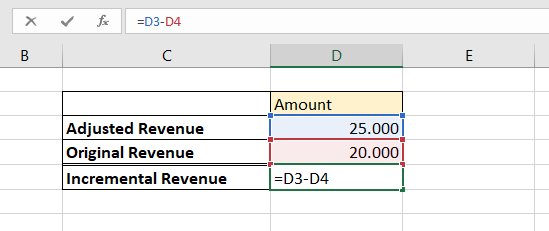
So, the incremental revenue attributed to the new marketing campaign is $5,000. This calculation helps in understanding the direct impact of specific business decisions or actions on the revenue generation of a company.
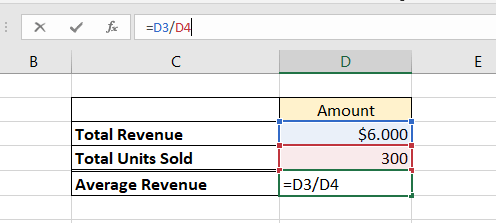
2.2. Average Revenue Formula
Average revenue is calculated by dividing the total revenue by the total number of units sold. The formula is expressed as:
2.3. Gross Revenue Formula
Gross revenue is the total revenue generated from all sources before any deductions like discounts, returns, or allowances. The formula is straightforward:
This formula sums up the product of the unit price and the quantity sold for all items.
Example:
Imagine a clothing store sells the following in a month:
- 100 T-shirts at $20 each
- 50 Jeans at $40 each
- 30 Jackets at $60 each
To calculate the gross revenue:
- Revenue from T-shirts = $20 × 100 = $2,000
- Revenue from Jeans = $40 × 50 = $2,000
- Revenue from Jackets = $60 × 30 = $1,800
Adding these up:
Gross Revenue=$2,000 + $2,000 + $1,800= $5,800
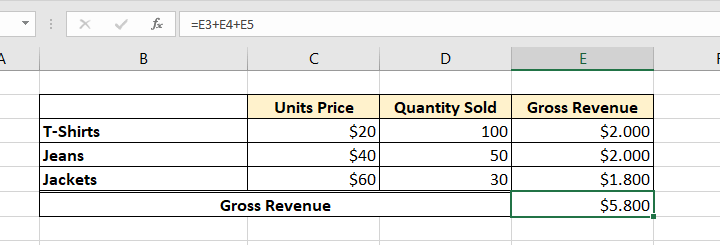
Therefore, the gross revenue for the month is $5,800. This calculation provides a clear view of the total sales generated, serving as a fundamental indicator of the business’s income generation capacity before accounting for any expenses or deductions.
2.4. Quarterly Revenue Formula
Quarterly revenue is the total revenue a business earns in a specific three-month period (a quarter) of the fiscal year. The formula to calculate it is:
This involves adding up the total revenue generated in each of the three months that make up a financial quarter.
Example:
Let’s say a tech company’s monthly revenues for the first quarter (January to March) are as follows:
- January Revenue: $50,000
- February Revenue: $55,000
- March Revenue: $60,000
To calculate the quarterly revenue, use sum formula:
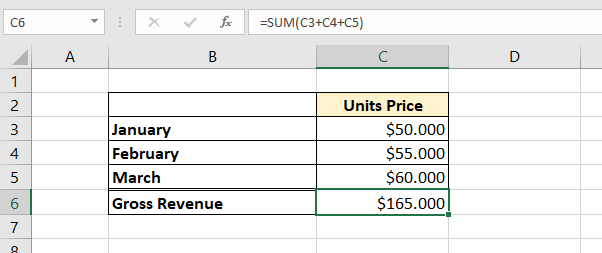
Therefore, the company’s revenue for the first quarter is $165,000.
This calculation is essential for businesses to assess their financial performance over specific intervals and to compare it with other quarters to identify trends, growth patterns, or seasonal effects on revenue.
3. How to calculate total sales revenue in Excel?
Here’s a step-by-step guidance to calculate total sales revenue in Excel.
#Step1: Organize your data
Start by putting your Excel sales data in order. For a full analysis, make sure that all relevant income streams are taken into account.
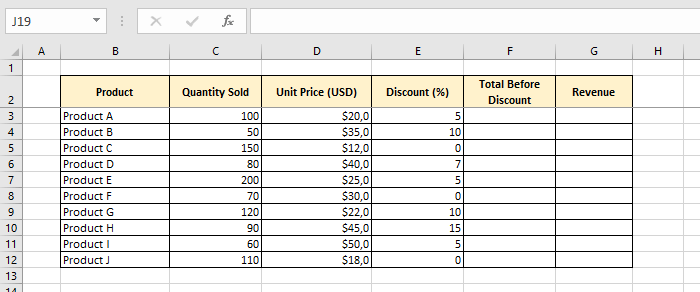
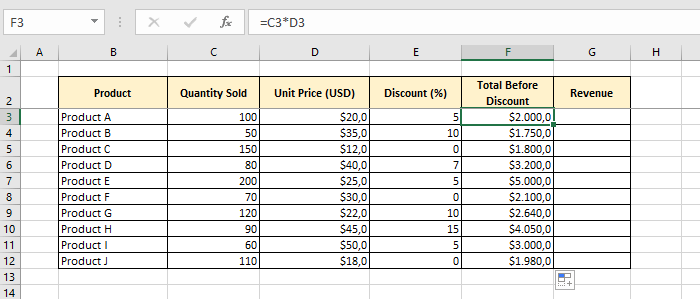
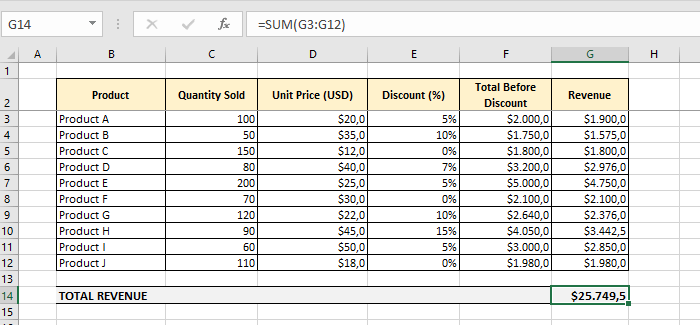
#Step 2: Calculate Revenue Before Discount
Figure out how much money each type of goods or service brings in by using the right formula.
The Revenue before discount will be calculated by multiplying the unit sold with unit price.
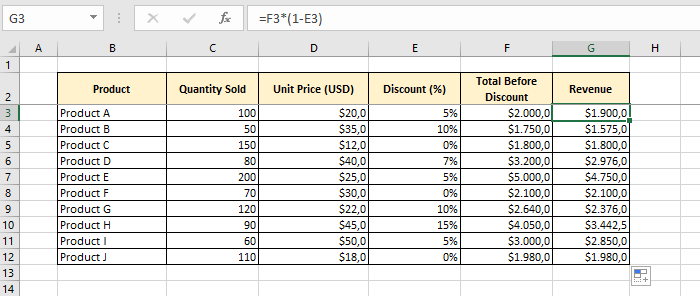
#Step 3: Calculate Individual Revenues for Each Product
Now, we’ll deduct the discounts from the revenue amounts.
#Step4: Make a copy of the formula
To use the method on all data points, copy it across all rows or columns.
#Step5: Formula for Total Revenue in Excel
Add up all the separate incomes to get the total income.
4. How do you decide on which Excel formula to use to find total revenue?
In this way question becomes interesting. Yes, there are lots of ways to calculate something in Excel. And deciding which path to follow needs two things.
- A complete tool set of knowledge: This is the first thing you need. The more ways you know, the easier you can find the suitable path for a given situation. Sometimes answer is pivot tables, sometimes simply SUM function, sometimes INDEX-MATCH and conditional SUMIFs.
- Experience with all tools you have: Knowing the functions is not enough. You have to use them many times so that you can decide which tool to use automatically.
Look at this for example:
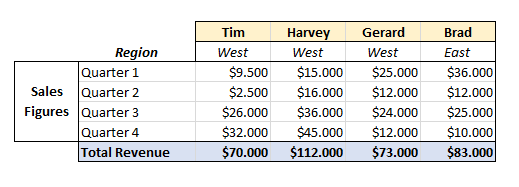
A simple SUM is enough. Because we already have revenues written per quarter and we sum them up.
Let’s make the things a bit more complicated:
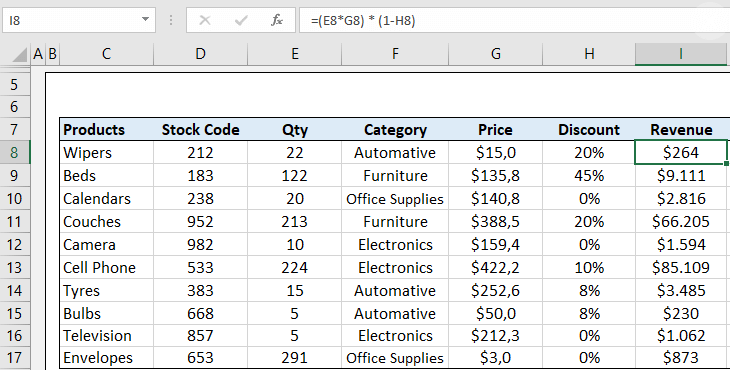
Now in order to be able to find the revenue, we have multiplied the price and quantity. We’ve also applied the discount.
Now let’s get the pivot tables involved.
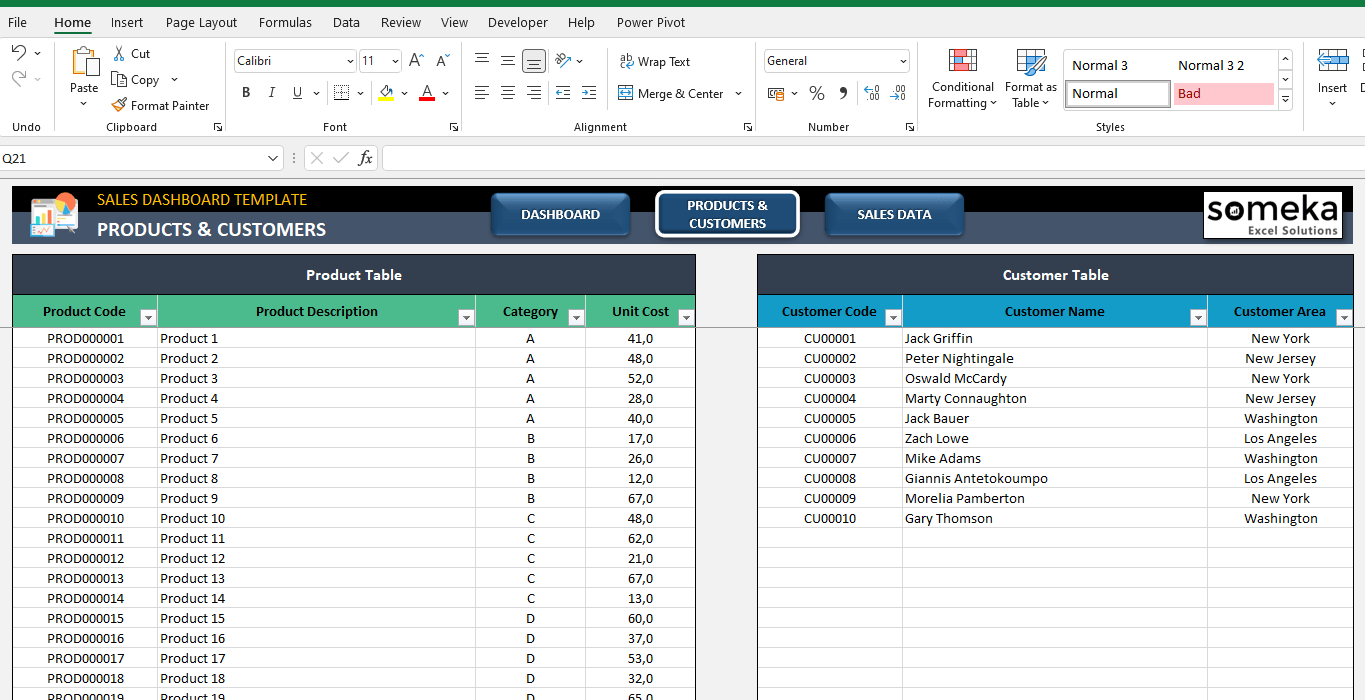
Here in this example, we have our invoice records and product prices in separate tables. First we consolidate these into one table then make analysis with pivot tables:
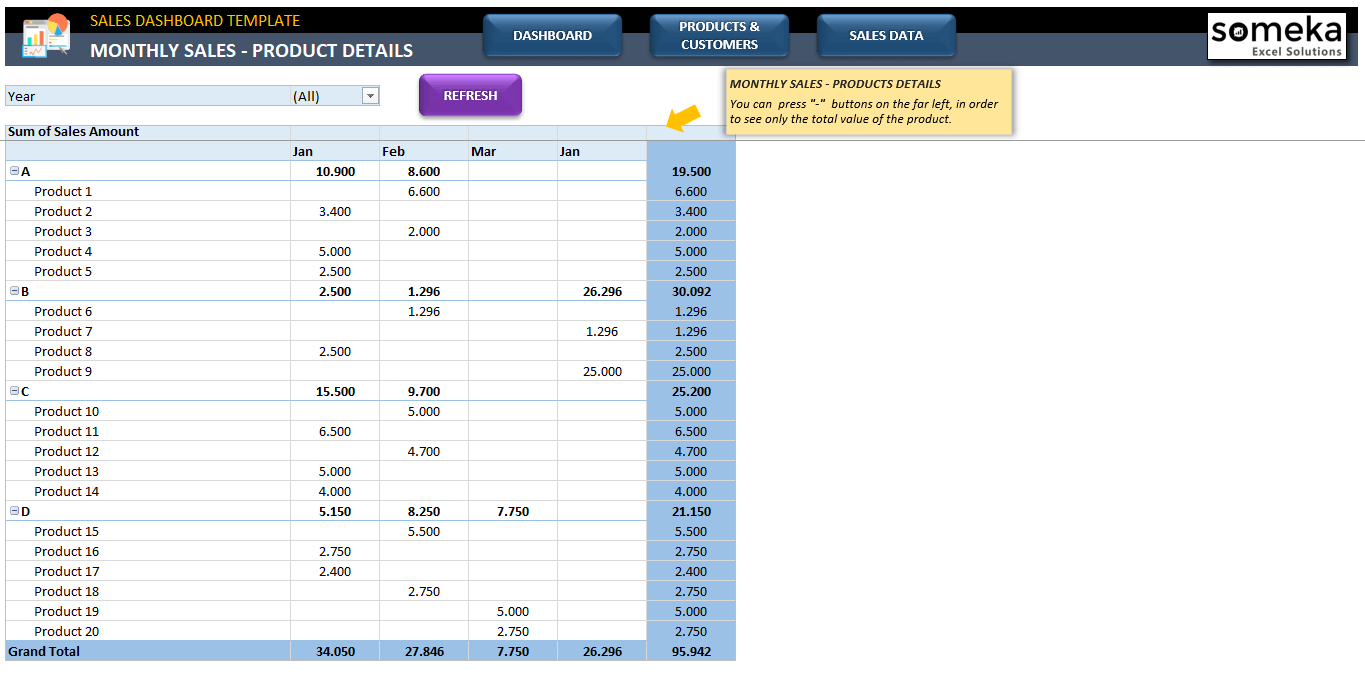
– This is one of the analysis pages of Someka Sales Dashboard Excel Template –
So you can make a dynamic analysis with pivot tables.
5. Ready-made Sales Report Template
If you want to make a detailed analysis for your sales report, then you’ll need a structured file. Someka provides you with a ready-to-use solution to prepare sales reports.
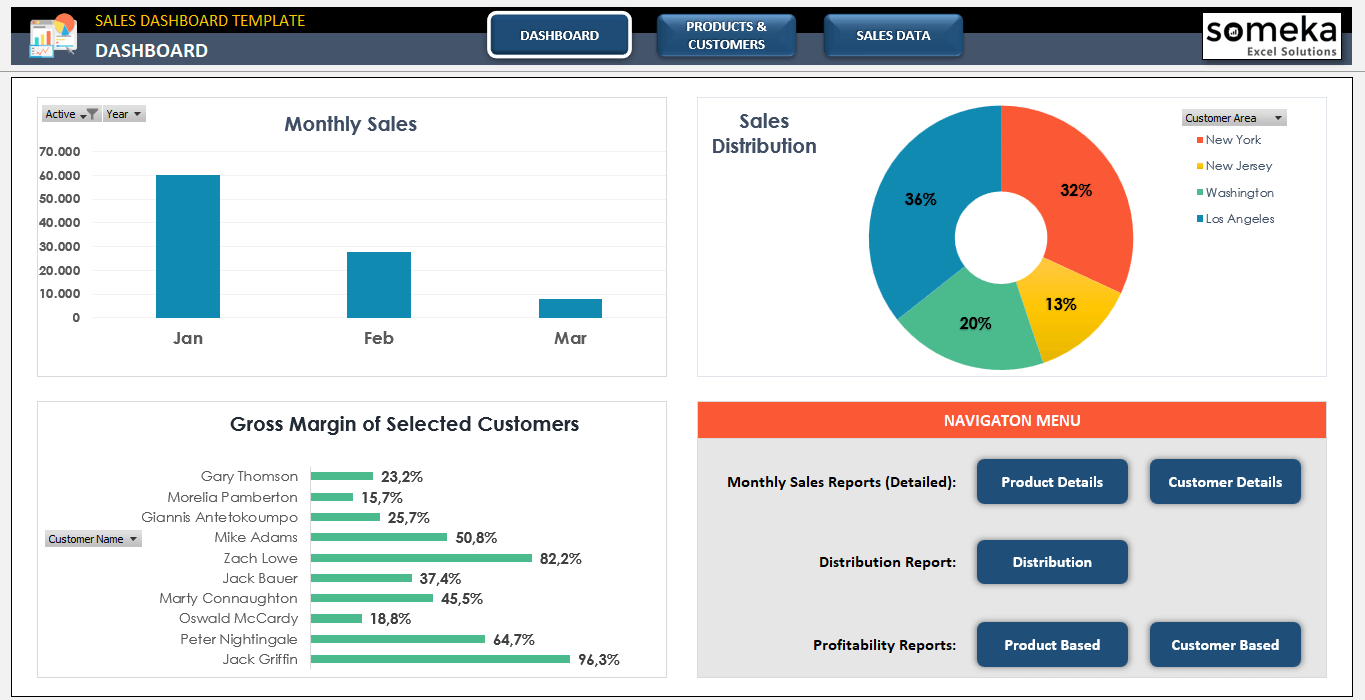
– This is from Sales Dashboard Excel Template created by Someka –
The main benefits of using this template
- Time and energy saving
- Sleek-design dashboard
- Detailed revenue analysis
- Product and customer based profitability reports
- Monthly sales reports
- Instant download
- Works both on Mac and Windows
- Available in Excel and Google Sheets
6. FAQ’s
What is the Formulae of Revenue?
The formula for calculating revenue generally is:
Revenue = Unit Price × Quantity Sold
This formula represents the total income generated from the sale of goods or services. The unit price is the amount charged for each unit of a product or service, and the quantity sold is the number of units sold. For businesses with multiple products or services, total revenue is calculated by summing the revenues from each product or service.
How do I Record Revenue in Excel?
Recording revenue in Excel involves a few simple steps:
- Set Up a Spreadsheet: Open a new Excel workbook and create a table with columns for different revenue-related data such as ‘Product Name’, ‘Unit Price’, ‘Quantity Sold’, and ‘Total Revenue’.
- Input Data: Enter the details for each product or service, including the unit price and quantity sold.
- Calculate Total Revenue: In the ‘Total Revenue’ column, use the formula =Unit Price * Quantity Sold for each row. You can auto-fill this formula for all rows if you have multiple entries.
- Summarize Total Revenue: If you have multiple products or services, use the SUM function (=SUM) at the bottom of the ‘Total Revenue’ column to get the total revenue across all products or services.
- Format the Spreadsheet: Adjust column widths, apply number formatting for currency, and use borders or cell shading to make your data clear and easily readable.
This process allows you to systematically record and calculate revenue in Excel, providing a clear view of financial performance over time.
Recommended Readings:
Related Posts


