Google Sheets Histogram Maker
Simple histogram generator in Google Sheets. Input your data and create a histogram chart instantly. Use it in your presentations. Ready to print.

TEMPLATE DESCRIPTION
Histogram charts are great tools for normal distribution analysis and data visualization. So, it is no wonder that they are amongst the most used distribution charts in Google Sheets. Still, it can be tiresome to build and edit your data into a histogram graph. For this reason, we present you our Google Sheets Histogram Maker.

Someka Histogram Template is a simple online histogram maker that will immediately generate a histogram diagram with your data.
Let us explain our template’s features so that you can how simple it is to make a histogram.
Google Sheets Histogram Maker Features
Someka Histogram Creator Template contains two different sheets in total.
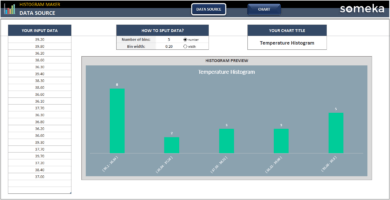
Data Source Sheet
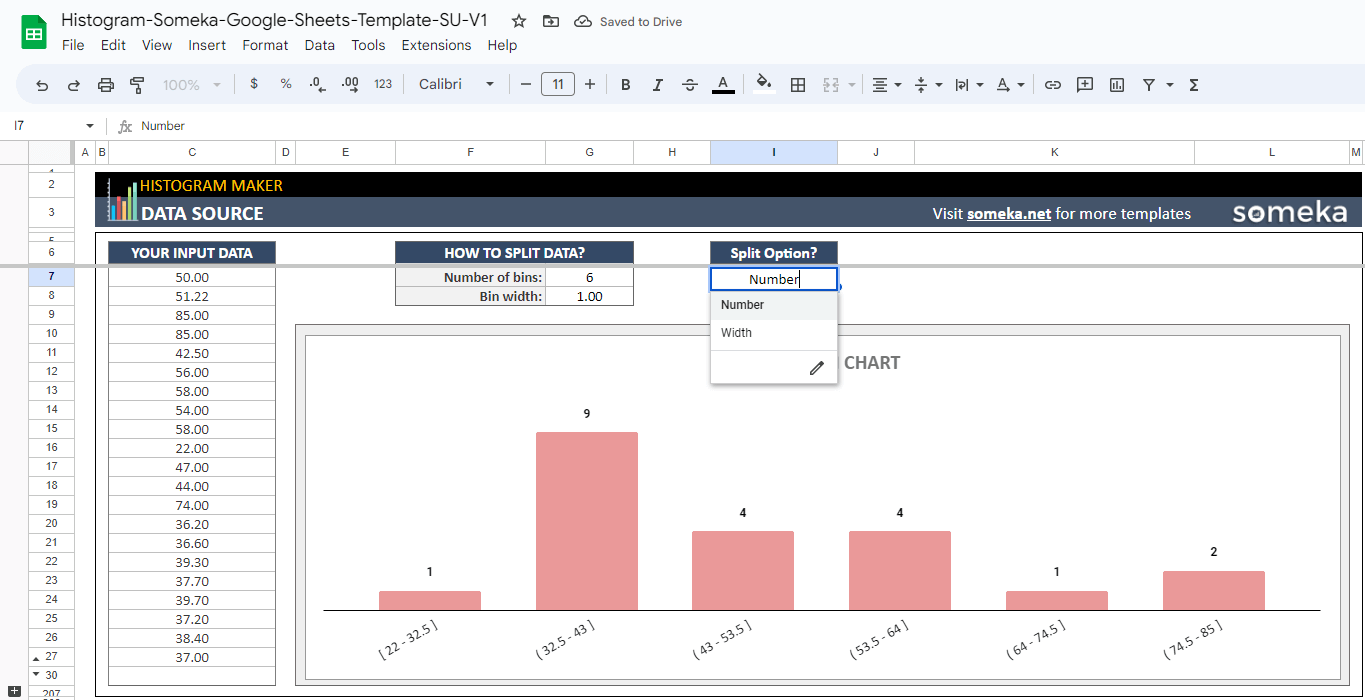
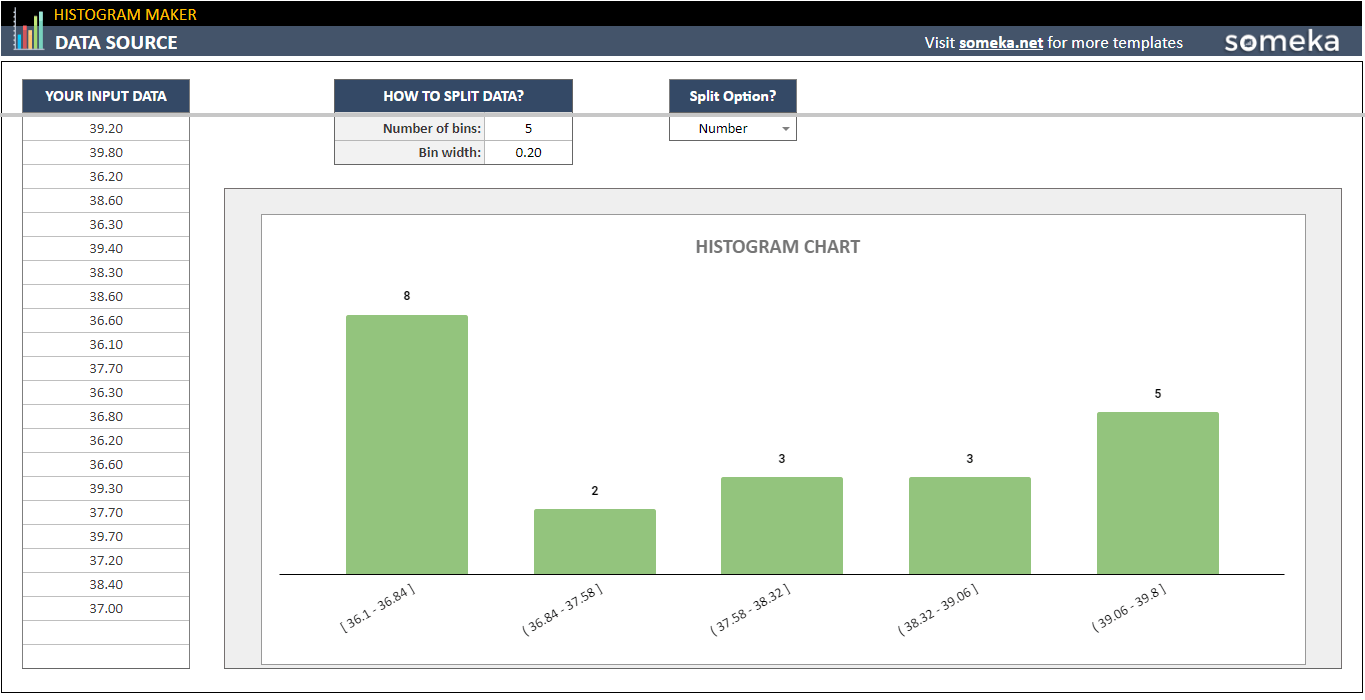
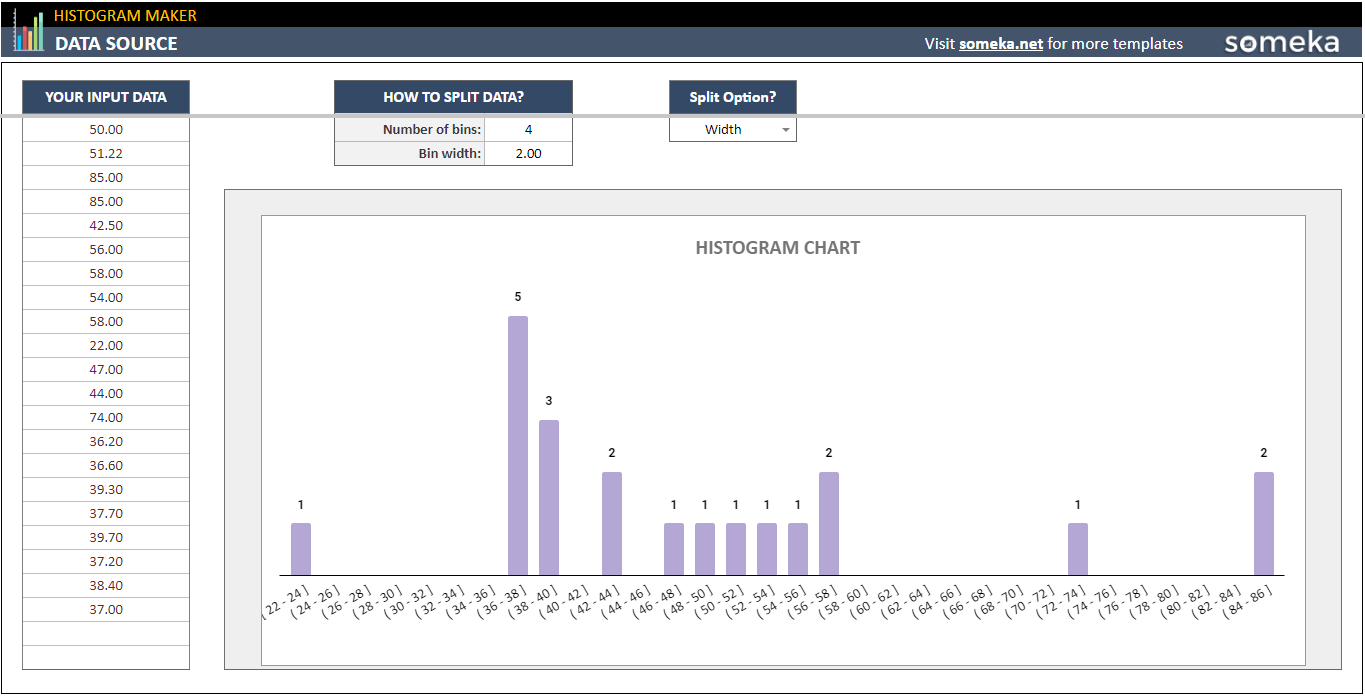
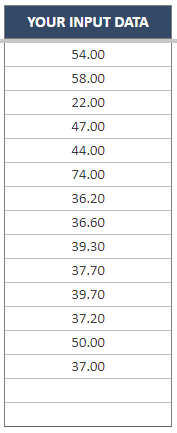
Firstly, there is the Data Source sheet in the template. In this sheet, you can simply put your values into the Your Input Data column. After that, the histogram chart will be generated automatically in Google Sheets.
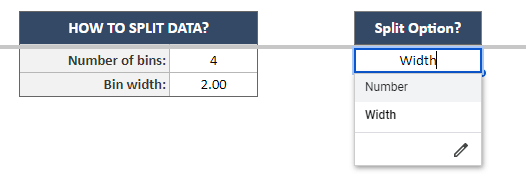
You can also change the Number of Bins and Bin Width of the histogram graph in this sheet. Moreover, you can select width split or number split options to visualize your data.
You don’t need to click or do anything else to apply the changes. Once you make a change, the changes will appear on the chart immediately.
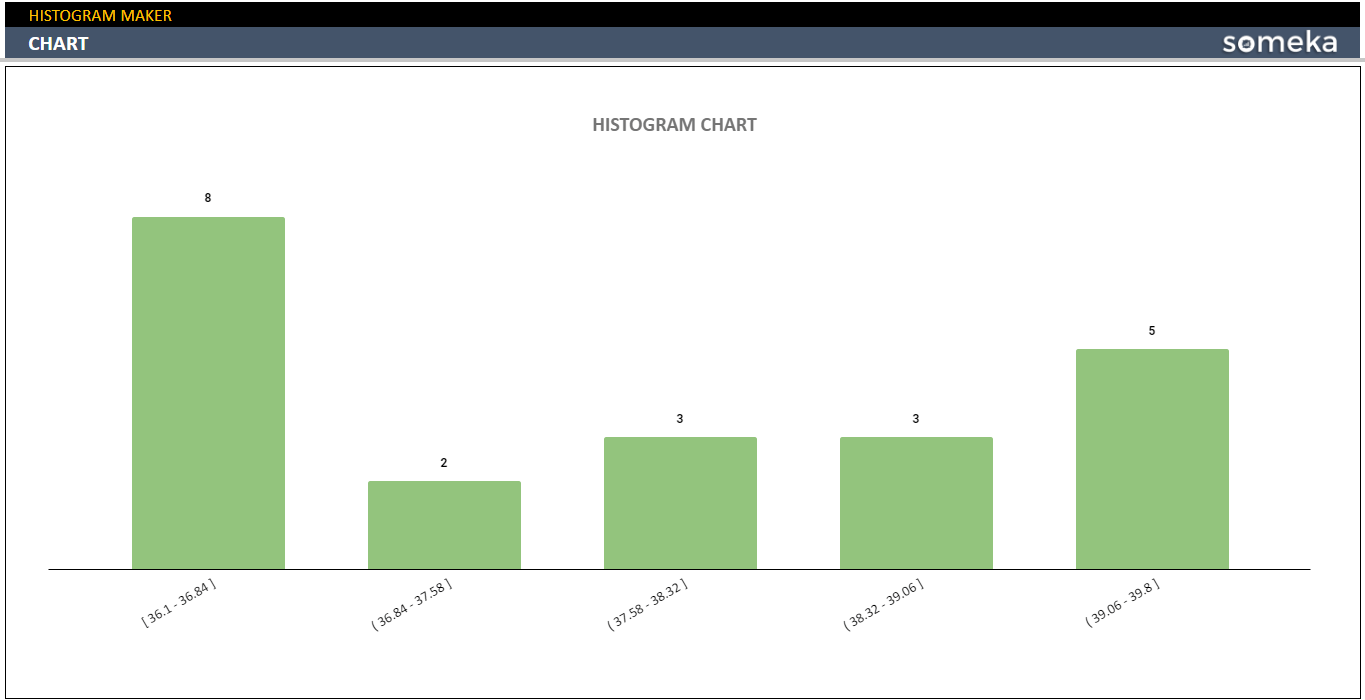
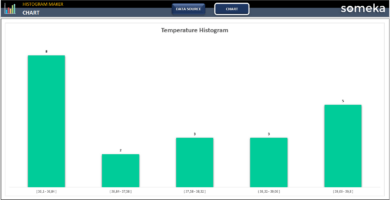
Chart Sheet
The second sheet of the histogram graph maker is the Chart Sheet. On this page, you can see the Google Sheets histogram chart clearly without any distractions. Also, you can make stylistic changes on this page. You can rename the chart, too.
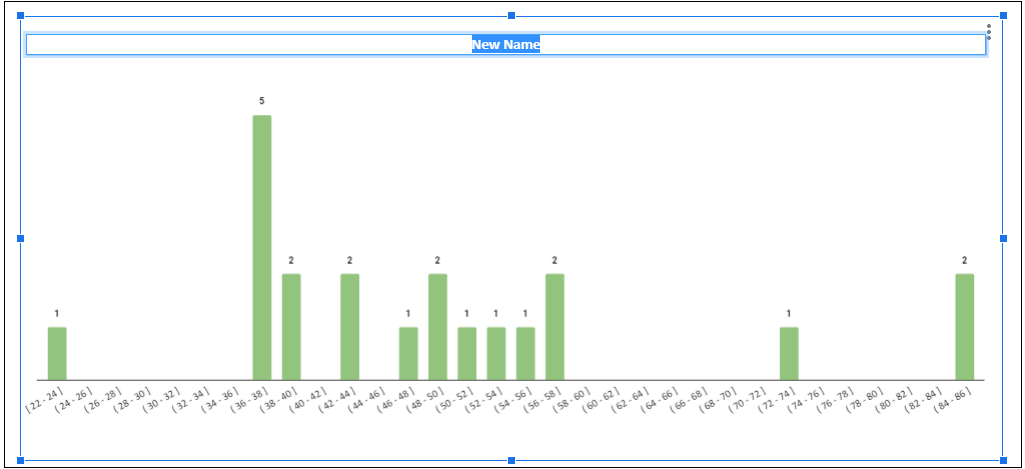
Basically, this sheet provides you with a ready-to-print plot histogram chart. You can also copy-paste the histogram diagram and use it on your presentations.
Google Sheets Histogram Maker Summary:
- Statistical bar graphs in Google Spreadsheet
- Different data split options
- No installation is needed
- Ready-to-print
- Informational notes included
- Compatible with any device (mobile, desktop, tablet)
USER REVIEWS & COMMENTS
3 reviews for Google Sheets Histogram Maker
You must be logged in to post a review.
RELATED TEMPLATES
-
 This product has multiple variants. The options may be chosen on the product page
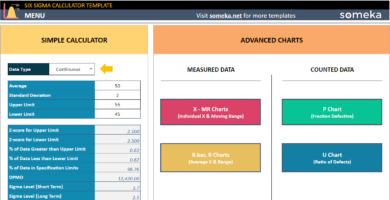
Six Sigma Calculator Google Sheets Template
$0.00 – $69.95Define your processes problems with Six Sigma Level Calculator in Google Sheets. Simple and advanced analysis with dynamic charts. Access from any device.
-
This product has multiple variants. The options may be chosen on the product page
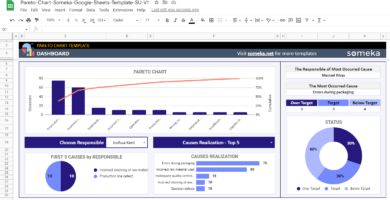
Pareto Chart Google Sheets Template
$0.00 – $59.95Frequency analysis tool in Google Sheets. Input your data and visualize it on Pareto Chart. Easy to use template with access from any device.
-
This product has multiple variants. The options may be chosen on the product page
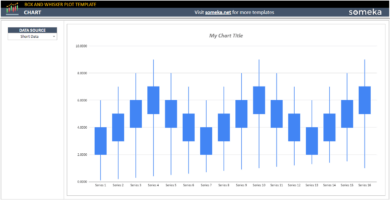
Box and Whisker Plot Google Sheets Template
$0.00 – $49.95Create box and whisker plot charts and visualize your data distribution in Google Sheets. Fully printable. Available on all devices.
-
This product has multiple variants. The options may be chosen on the product page
Histogram Maker Excel Template
$0.00 – $49.95Excel spreadsheet for histogram diagrams. Create bar graphs in seconds. Printable dynamic charts with data split options. No installation needed.


Marina –
Easy to copy paste
Toby –
How did you change the colors?
Someka –
Hi Toby,
Thanks for your question! You can edit the colors of your chart via the Chart Editor in Google Sheets. Just double click on your chart. The chart editor will be open and you will see the color of your bars.

Sarah P –
Simple and lovely