Mobile App Financial Model Excel Template
Easy-to-use Mobile App Financial Model tool. Feasibility study and budget for tech startups. Financial projections & cost breakdown. All in Excel!
TEMPLATE DESCRIPTION
Do you have a startup and planning to launch a new mobile application but you’re not sure whether your business model is feasible or not? Also, you want to perform some simulations in order to find out the necessary investments. So, this Mobile App Financial Model Excel Template will help you to prepare a financial feasibility study for your business!
To emphasize, we have built this Excel Template according to the latest industry practices such as different revenue streams, expense types, commissions, retention rate calculations, breakeven analysis, and much more.
Furthermore, no new software, no installation. Everything in Excel. Just open this Mobile App Financial Model template and start building your feasibility study!
MOBILE APP FINANCIAL MODEL EXCEL TEMPLATE FEATURES
Basically, this financial plan consists of 3 main sections:
- Revenue Model Inputs
- Cost Inputs
- Report Outputs
In summary, the flow is: Make inputs for your download projections and different revenue streams > Input your variable and fixed expenses > Analyze results at report outputs. This is a three-step cycle and according to the results, you can go back to the input sections and play with your projections until you find a reasonable point for your project.
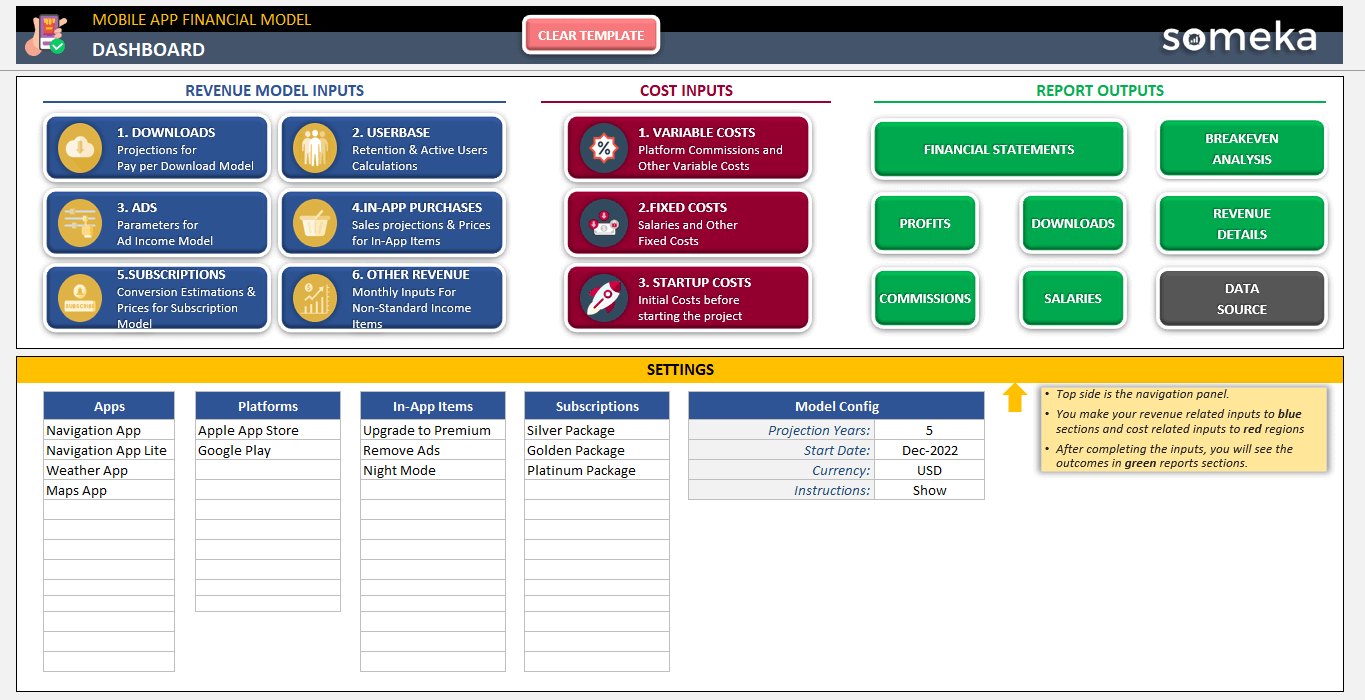
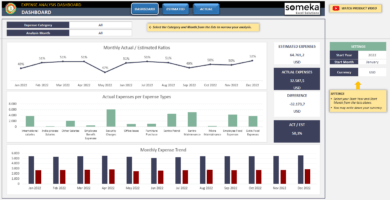
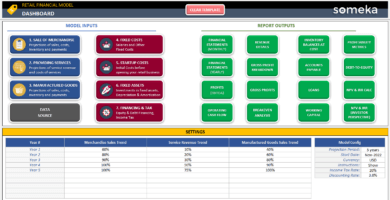
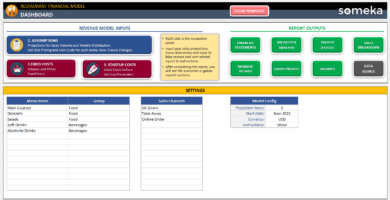
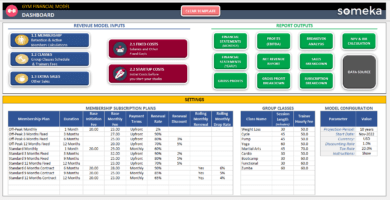
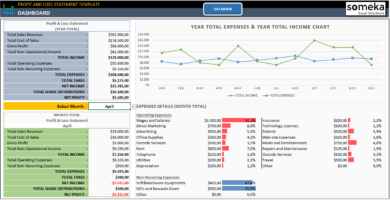
DASHBOARD
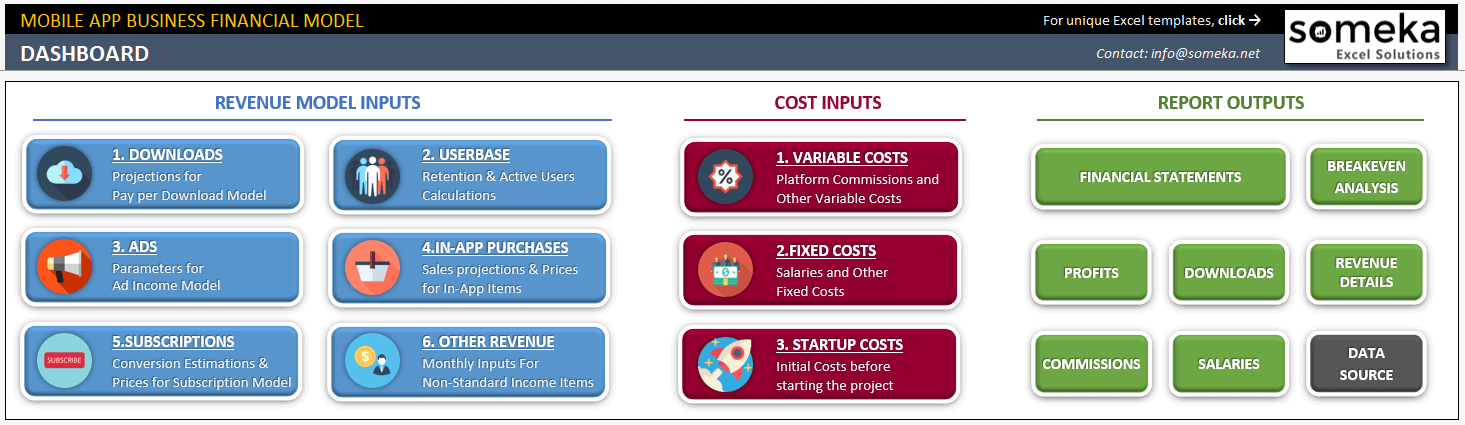
This is the Navigation Panel of the mobile app financial model template. Moreover, you make your revenue-related inputs to blue sections and cost-related inputs to red regions.
After completing the inputs, you will see the outcomes in the green report’s sections.
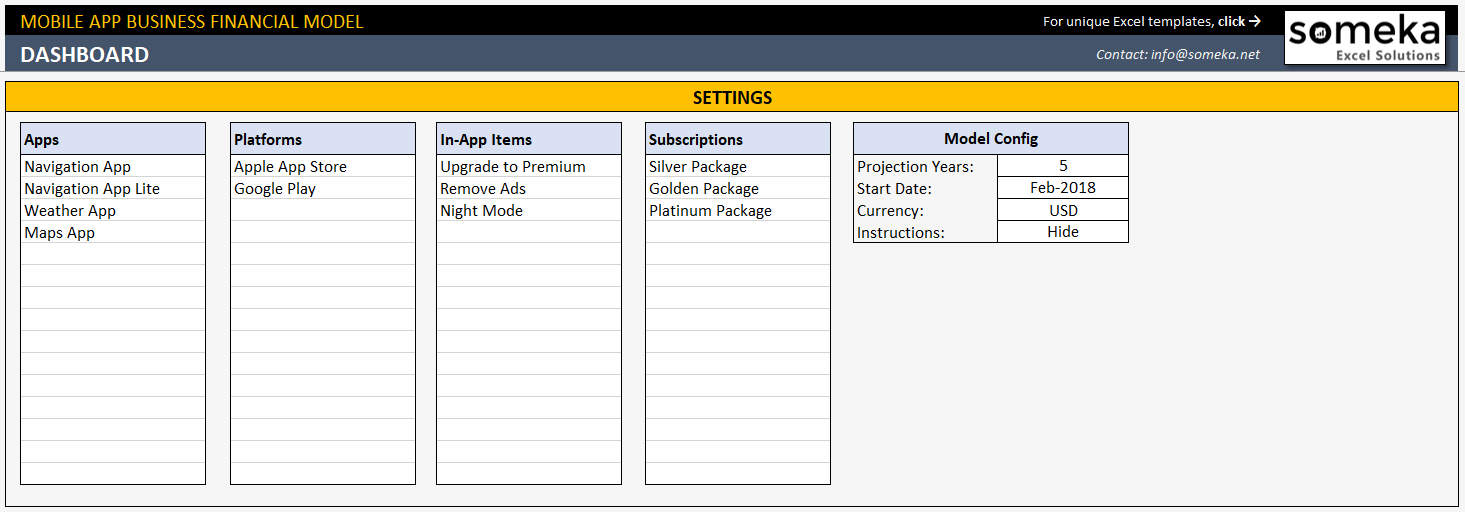
Genarally, this is the main Settings section under Dashboard.
From the Model Config box (on the right side) you can configure your model:
- Projection Years: You can choose to make your projections from 1 to 5 years. This financial model will update all reports according to your selection.
- Start Date: Input the month-year for operations to start. After that, the tool will update all reports and input tables accordingly.
- Currency: This setting does not affect the formatting of values but several notes will be updated according to this selection.
- Instructions: Here you can show/hide all instructions boxes in the model.
Left side is the Model Variables section of the financial model excel template for mobile app business. Here you input the values you will use all through the model:
- There are 4 different variable tables: Apps, Platforms, In-App Items, and Subscriptions. So, you input your names here and they will appear in the dropdown selections at Input Sections.
- This is important to ensure the same texts are used everywhere in the model to prevent data discrepancies
- Attention: If you decide to change values here, later on, make sure you update your existing selections.
1. MOBILE APP REVENUE MODEL INPUTS
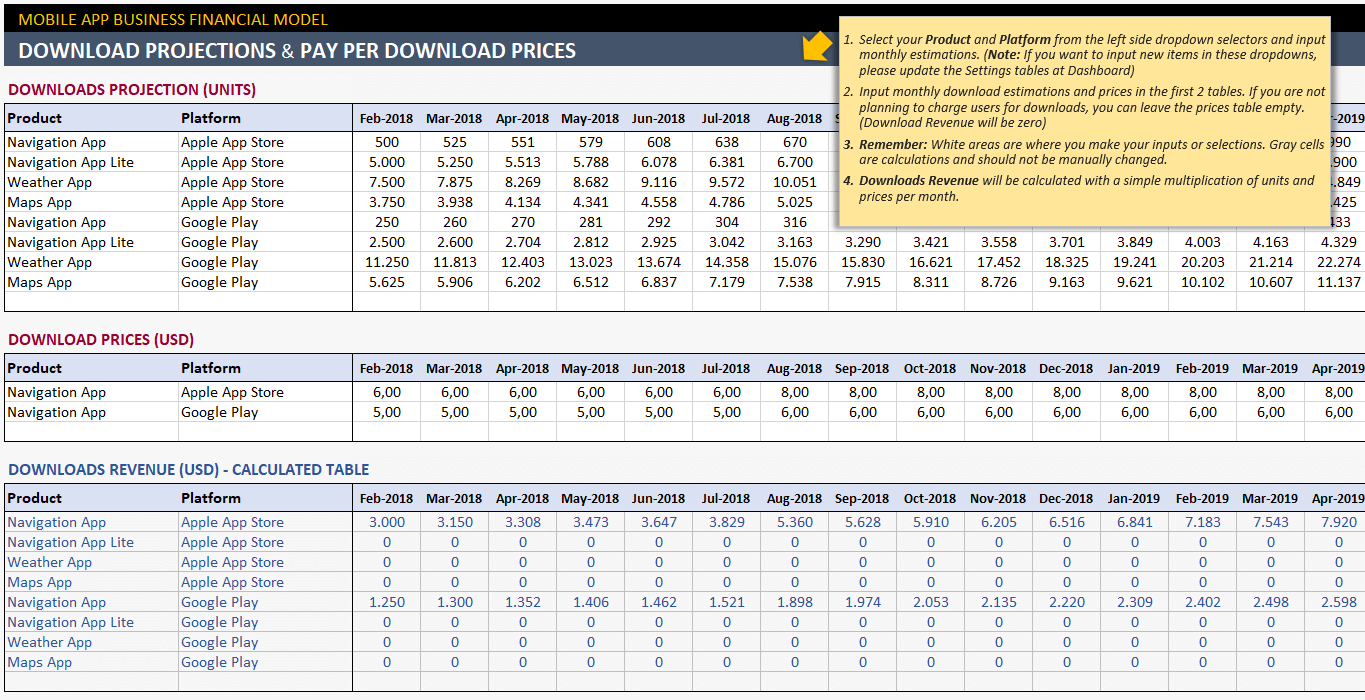
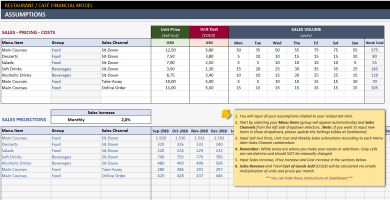
DOWNLOAD PROJECTIONS & PAY PER DOWNLOAD PRICES
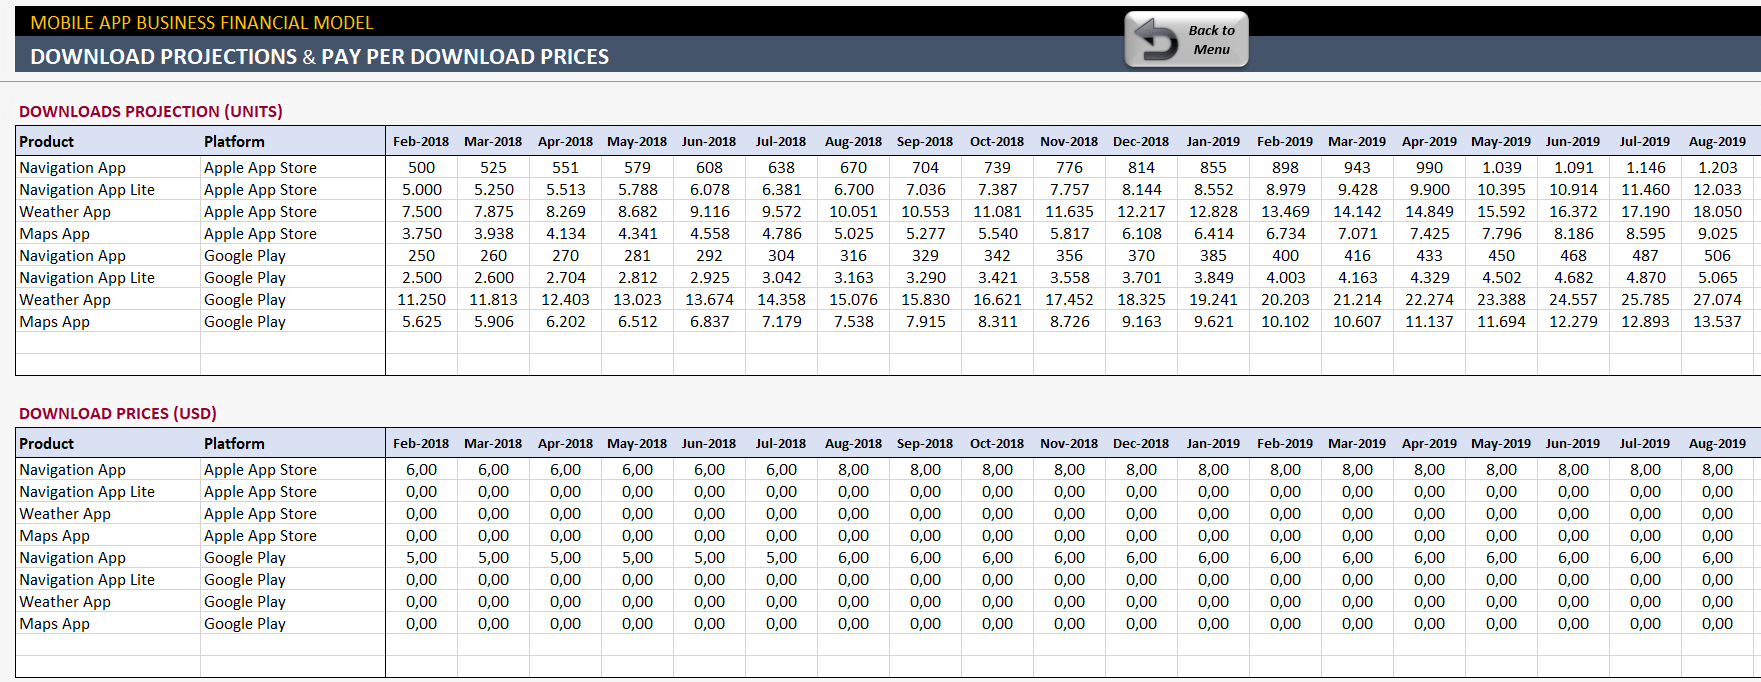
Under this section you will input the estimated download units for your apps per platform based:
- You select your Product and Platform from the left side dropdown selectors and input monthly estimations. (If you want to add new items in these dropdowns, you can update the Settings tables at Dashboard)
- Then you input monthly download estimations and prices in the first 2 tables. If you are not planning to charge users for downloads, you can leave the prices table empty. (Pay-Per-Download Revenue will be zero)
- Attention: In this mobile app financial model, white areas are where you make your inputs or selections. Gray cells are calculations and you should not change it manually.
- Downloads Revenue is a result of the simple multiplication of units and prices per month.
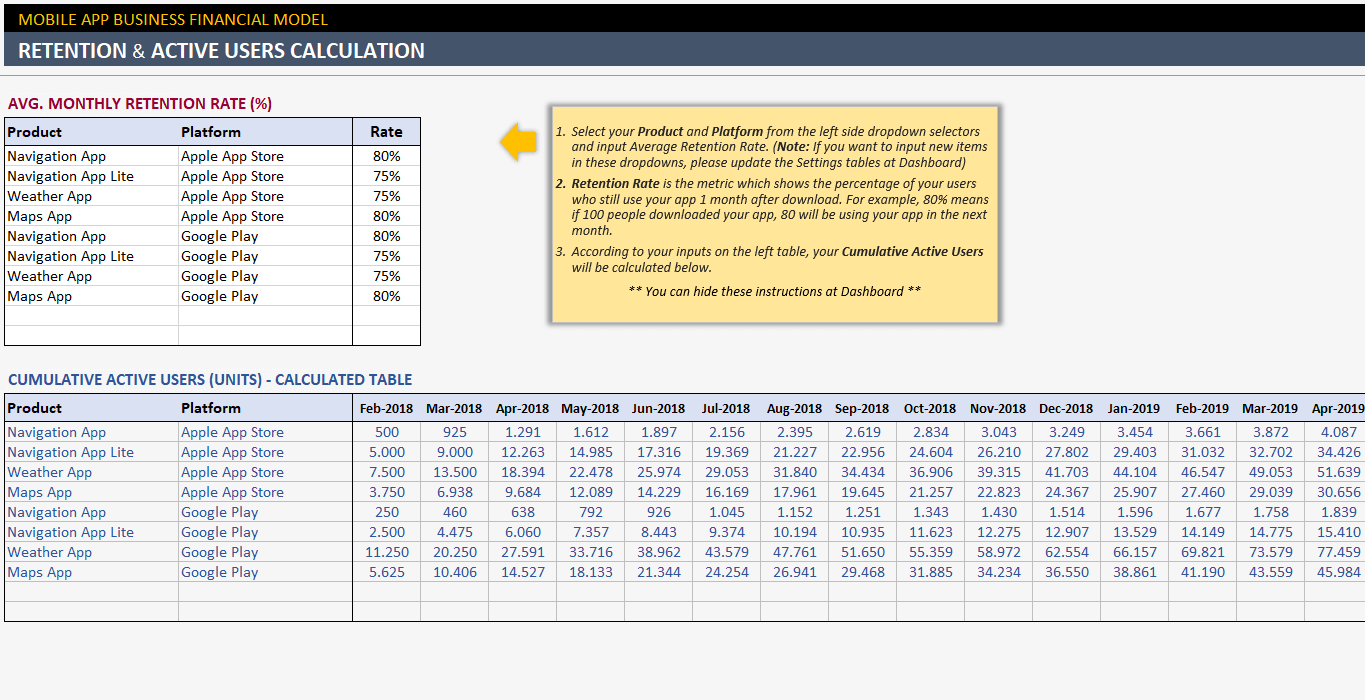
RETENTION & ACTIVE USERS CALCULATION
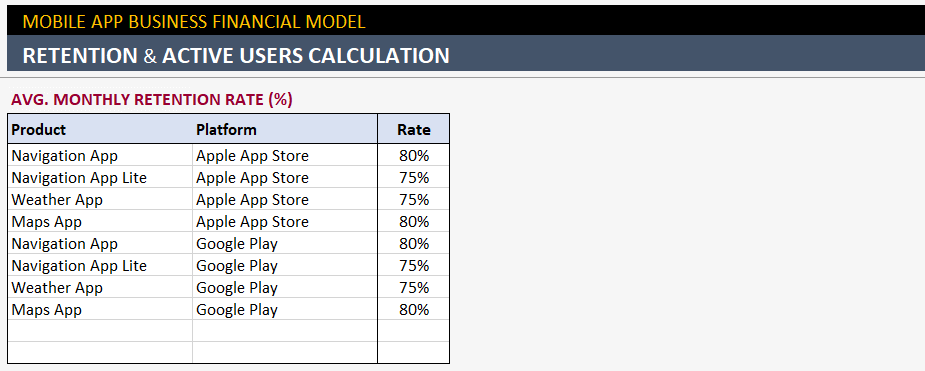
This is where we calculate the active users according to the download units we inputted in the previous section of this mobile app financial model excel spreadsheet:
- Retention Rate is the metric that shows the percentage of your users who still use your app 1 month after download. For example, a retention rate of 80% means that if 100 people downloaded your app, 80 people are using your app the next month.
- According to your inputs on the left table, your Cumulative Active Users will be calculated below.
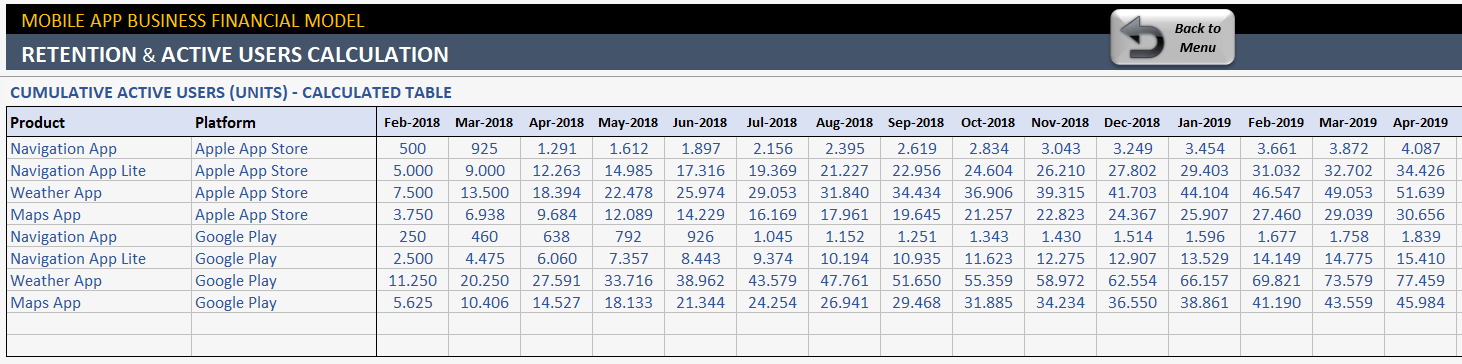
Therefore, in the financial model, if you want to micro-manage this Retention Rate and Active Users section, you can also change the calculated monthly Engaging User percentages. (You will need to overwrite the formulas)
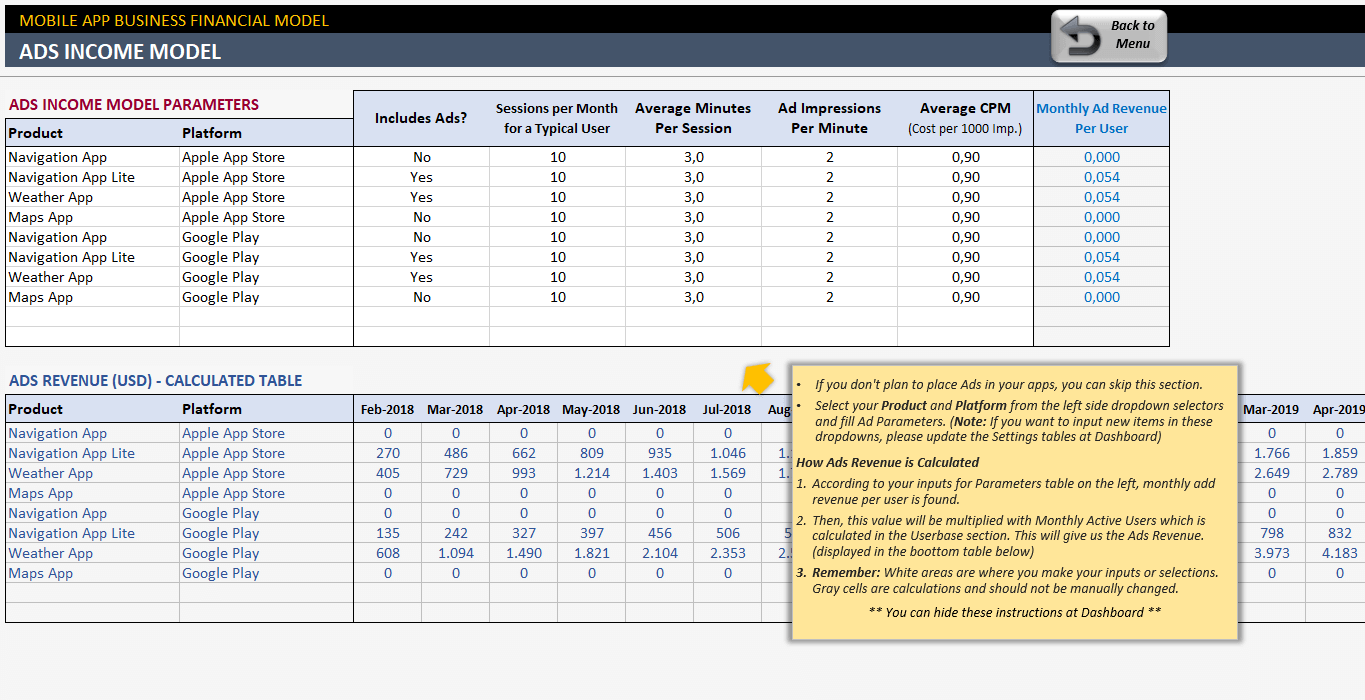
ADS REVENUE
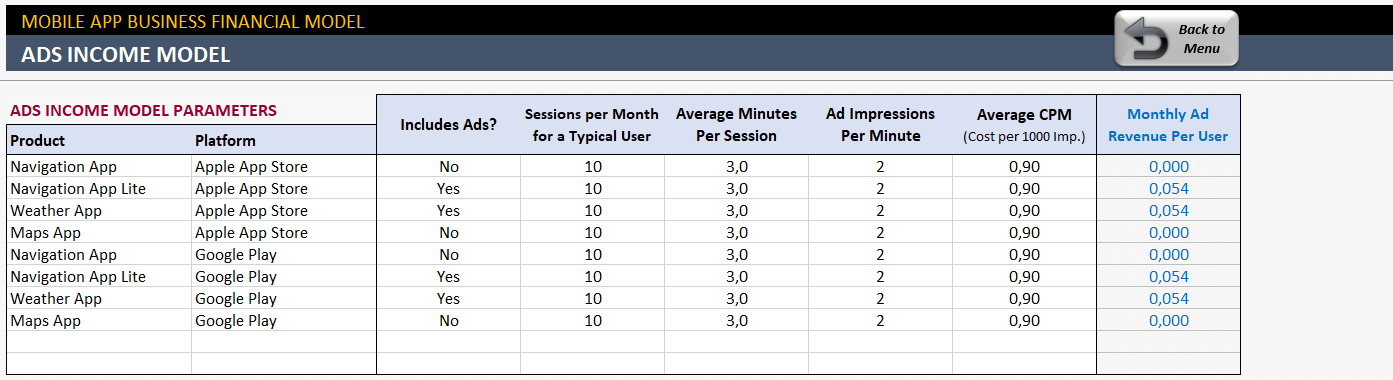
This is where we calculate our Ads Revenue. Similarly, if you don’t plan to place ads in your apps, you can skip this section. Like the previous sections, you select your Product and Platform from the left side dropdown selectors and fill Ad Parameters.
How is Ads Revenue Calculated?
- According to your inputs in the Parameters table on the left, monthly add revenue per user is found.
- Sessions per Month for a Typical User: How many times is an active user opening your mobile app?
- Average Minutes per Session: When a user opens your app, for how long do they use it?
- Ad Impressions Per Minute: How often do you plan to show ads in your app?
- Average CPM (Cost per 1000 Impressions): This is how much you are going to earn per thousand impressions. You can use data from platform statistics or from your past info.
- Then, monthly Ad Revenue per User will be multiplied by Monthly Active Users which is calculated in the Userbase section.
- Lastly, this will give us the Ads Revenue in the currency you input in the Dashboard.
IN-APP PURCHASES
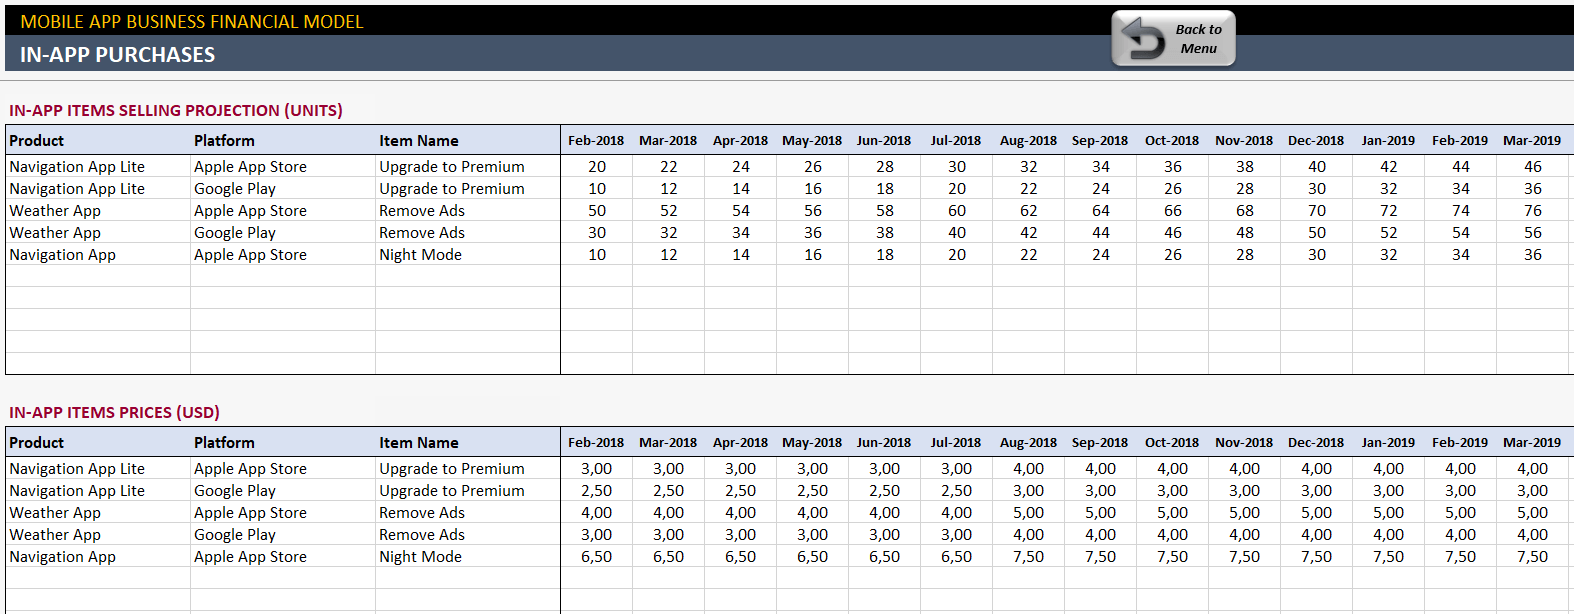
Similar to the Pay-Per-Download inputs, here we sell in-app items. However, if you are not planning to offer any in-app purchases, you can skip this section ıf this mobile app financial model template:
- You input monthly selling estimations and prices in the first 2 tables.
- In-App Items the template calculates the Revenue via simple multiplication of units and prices per month.
SUBSCRIPTIONS
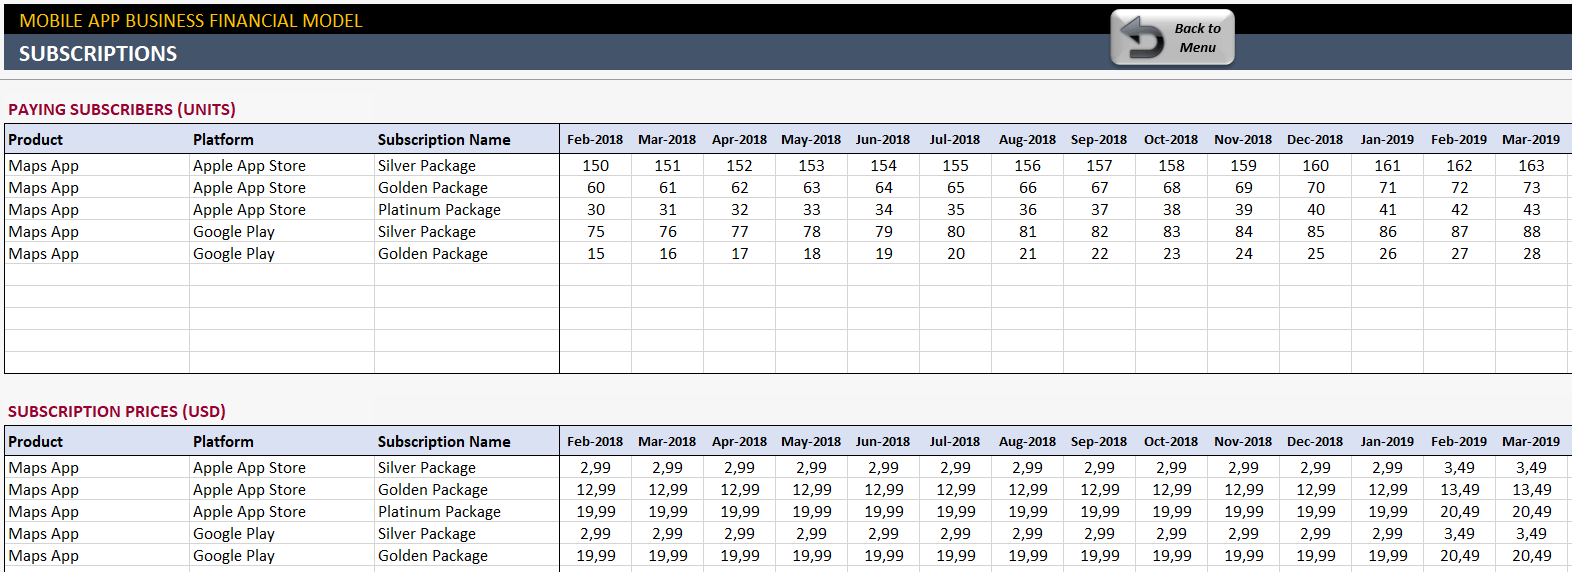
Firstly, if you plan to offer subscriptions, here you can input projected paying subscribers and related revenue streams. But if you are not planning to have subscription revenue, you can skip this section.
- You select your Product, Platform, and Subscription Name and input monthly paying subscribers and subscription prices in the first 2 tables.
- Subscription Revenue is a result of the simple multiplication of subscribers and prices per month.
2. FINANCIAL MODEL COST INPUTS
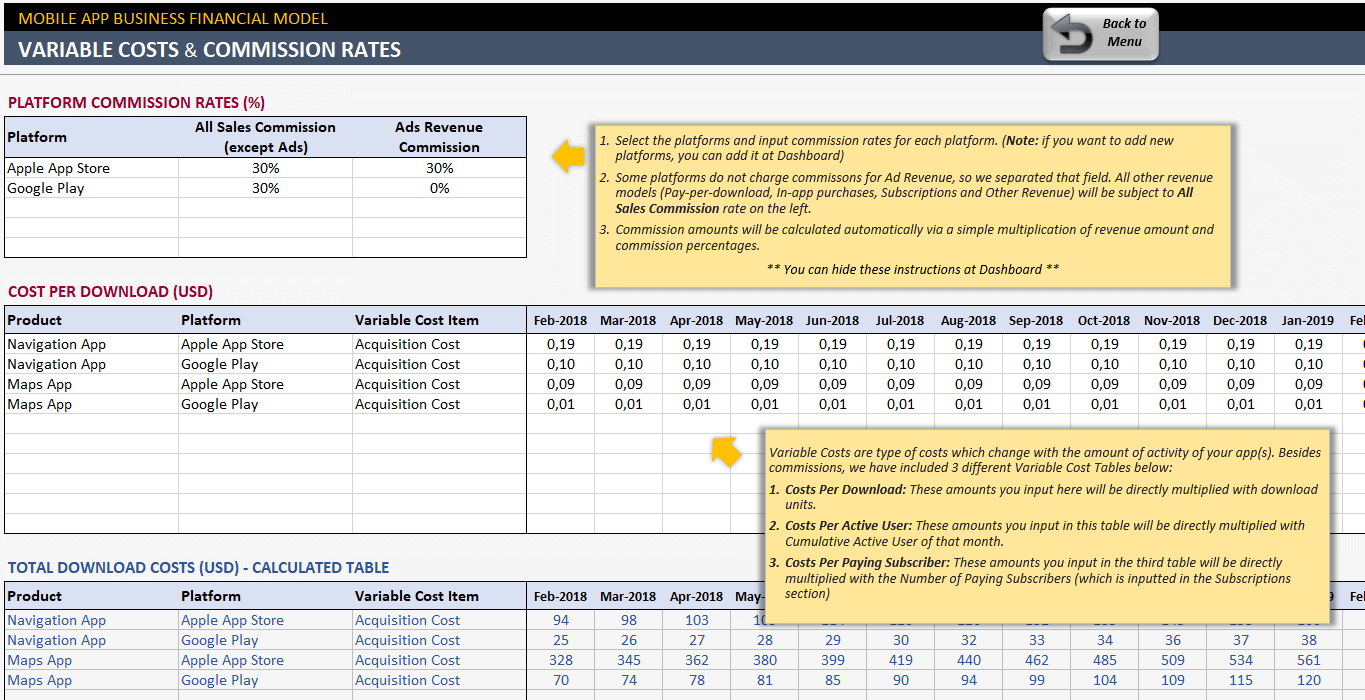
COMMISSION RATES & VARIABLE COSTS
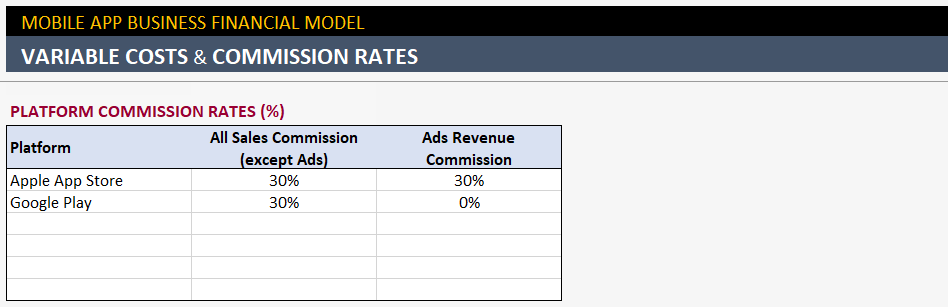
Here you define the commission rates for each platform for the mobile app financial model template in Excel. In short, this is where you lose a certain ratio of all your sales:
- Some platforms do not charge commissions for Ad Revenue, so we separated that field. All other revenue models (Pay-per-download, In-app purchases, Subscriptions, and Other Revenue) will be subject to the All Sales Commission rate on the left.
- Commission amounts will be calculated automatically via a simple multiplication of revenue amount and commission percentages.
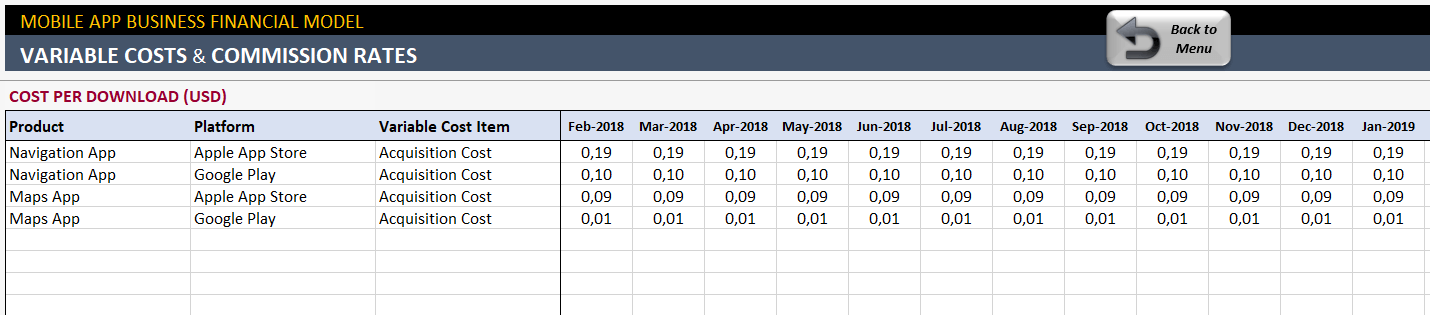
Generallary, the variable Costs are a type of cost that changes with the amount of activity of your app(s). Besides commissions, we have included 3 different Variable Cost Tables:
- Costs Per Download: These amounts will be directly multiplied by download units of your mobile app.
- Per Active User: These amounts will be directly multiplied by Cumulative Active Users of that month.
- Per Paying Subscriber: These amounts will be directly multiplied by the Number of Paying Subscribers (which is inputted in the Subscriptions section)
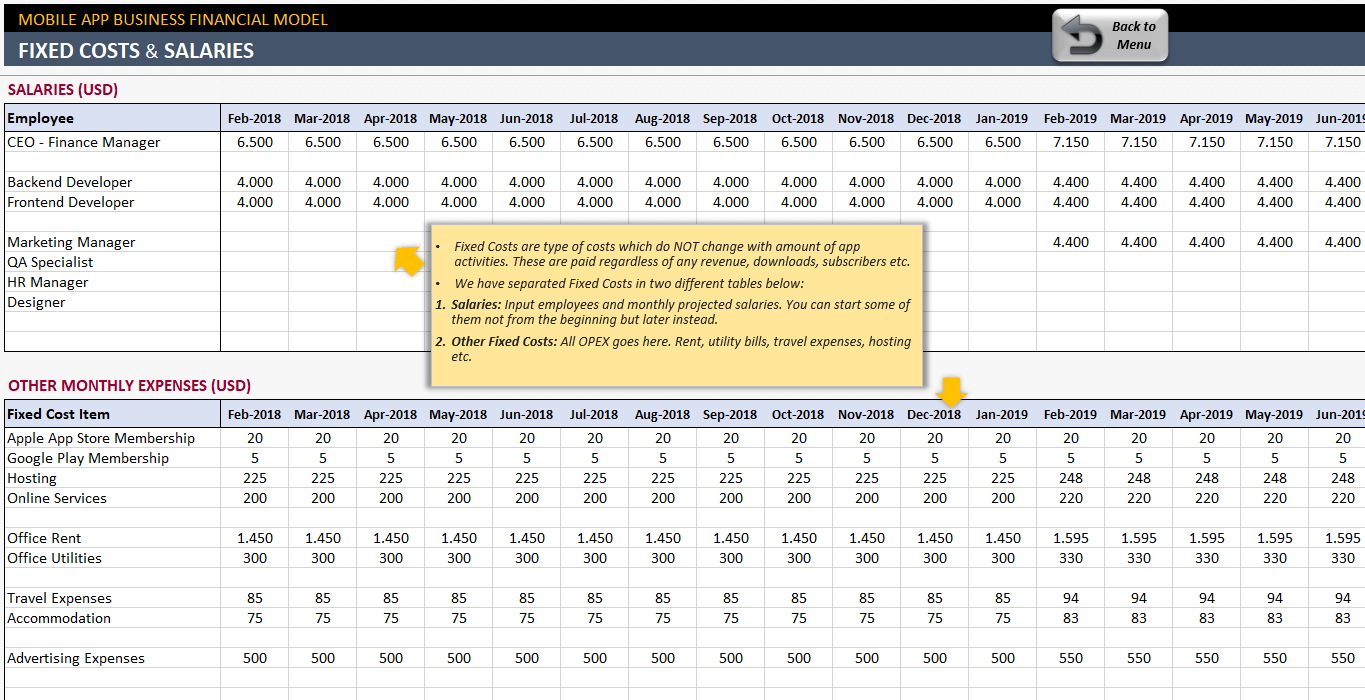
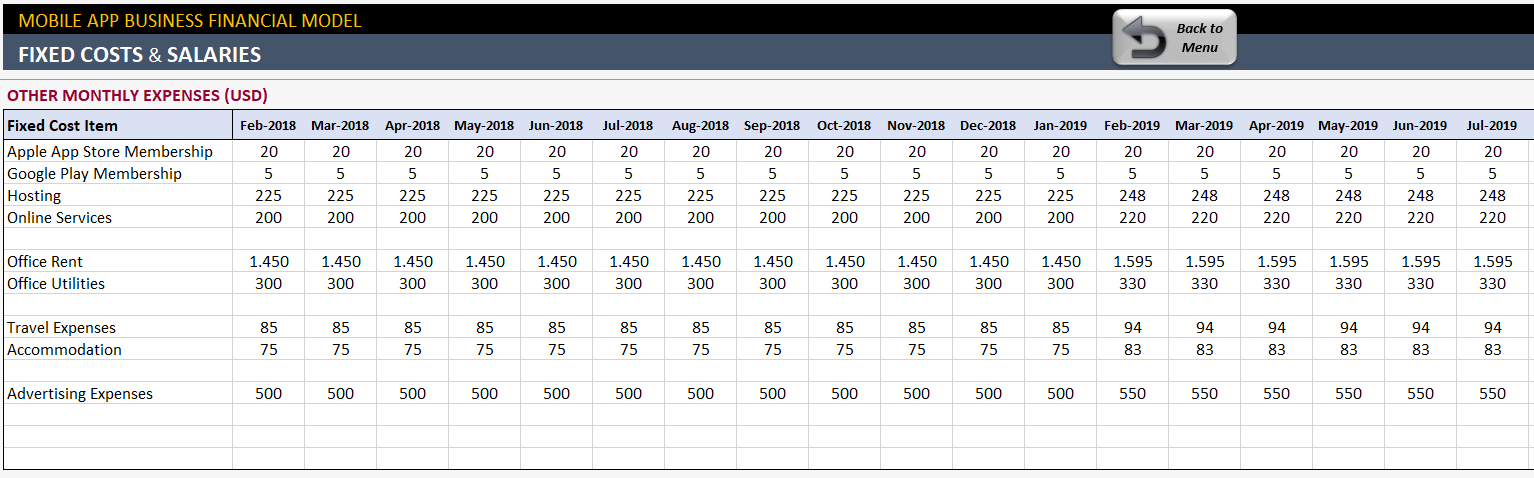
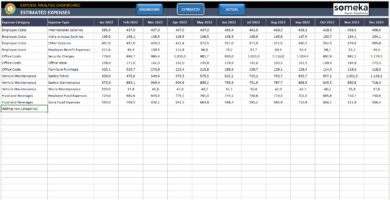
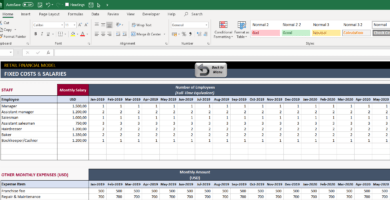
SALARIES & FIXED COSTS
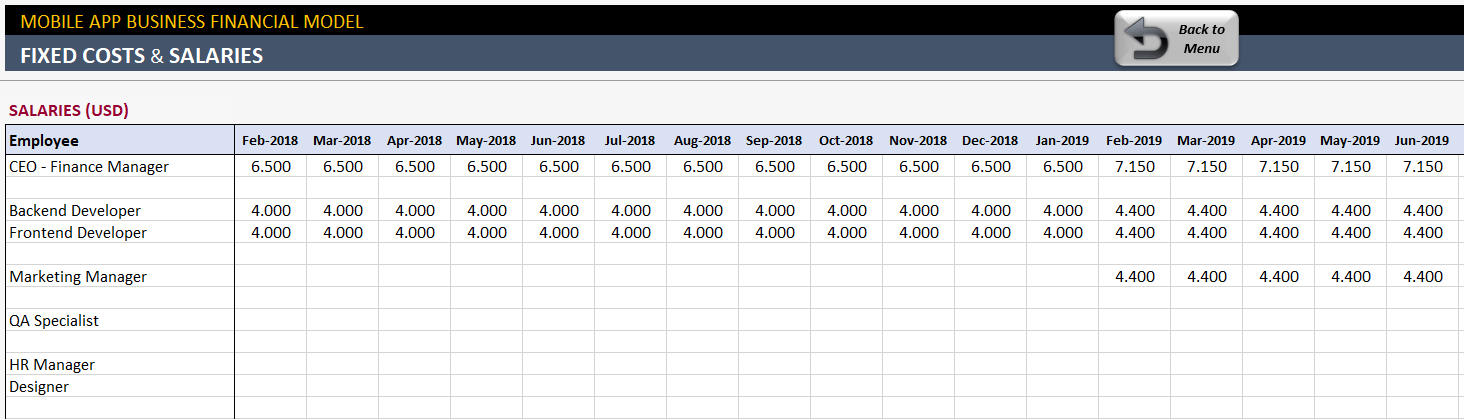
Fixed Costs are a type of cost that does NOT change with the number of app activities. These are paid regardless of any revenue, downloads, subscribers, etc.
We have separated Fixed Costs into two different tables in this mobile app financials template:
- Salaries: Input employees and monthly projected salaries. You can start some of them not from the beginning but later instead.
- Other Fixed Costs: All OPEX goes here. Rent, utility bills, travel expenses, hosting, etc.
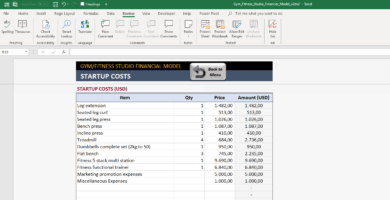
STARTUP COSTS
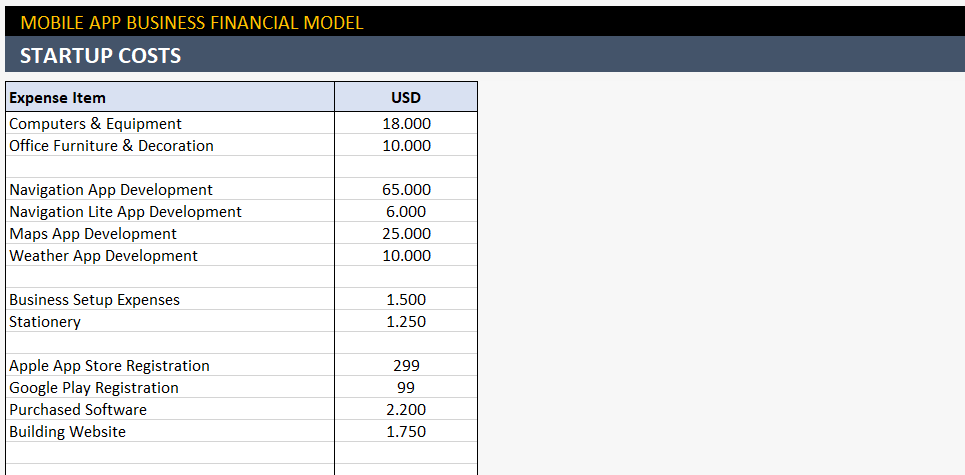
Startup Costs are the expenses that are prior to the going live date of your startup budget:
- These costs will be recorded 1 month prior to the Start Date in the Output Report.
- Startup Costs are especially important for Breakeven Analysis in order to find out when will you be able to pay out the initial expenses and start making real profits.
- For the sake of simplicity, we ignored amortization and depreciation in the Breakeven Analysis. So, if you have a significant amount of fixed assets and want to include depreciation, just put them as revenue in the Other Revenue section (or you can deduct them from monthly expenses)
3. REPORT OUTPUTS
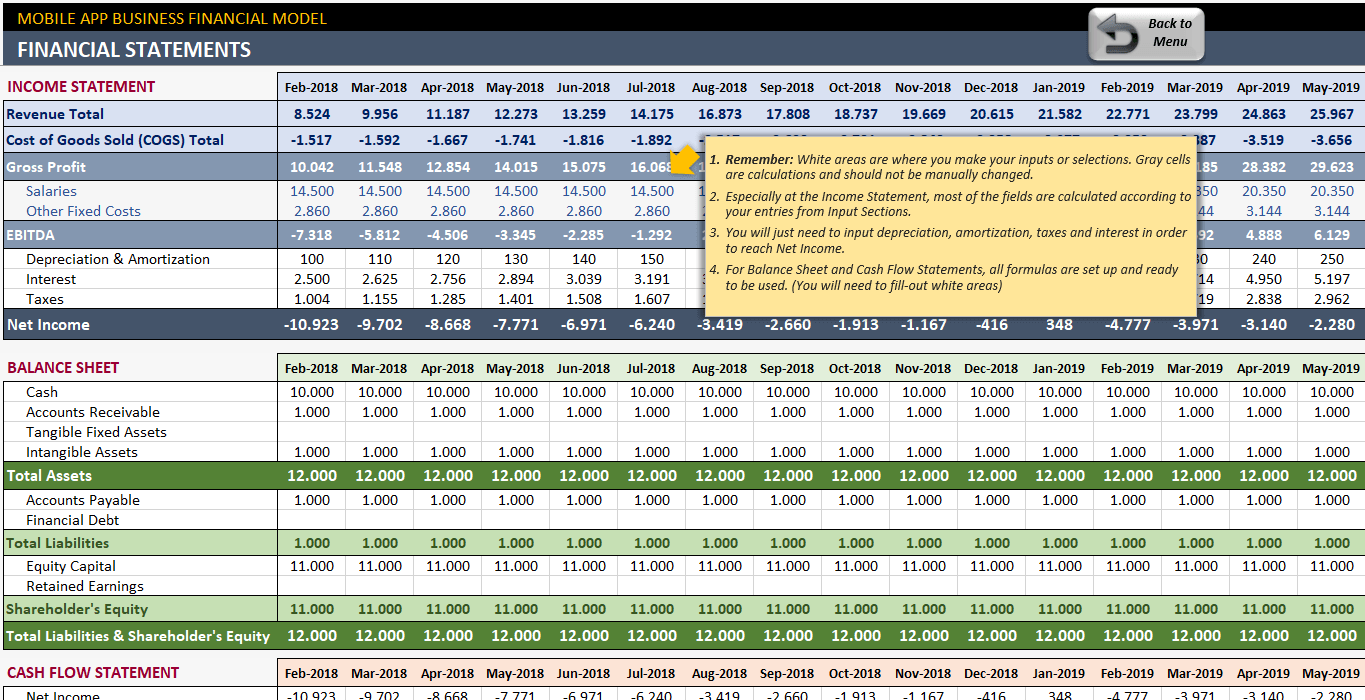
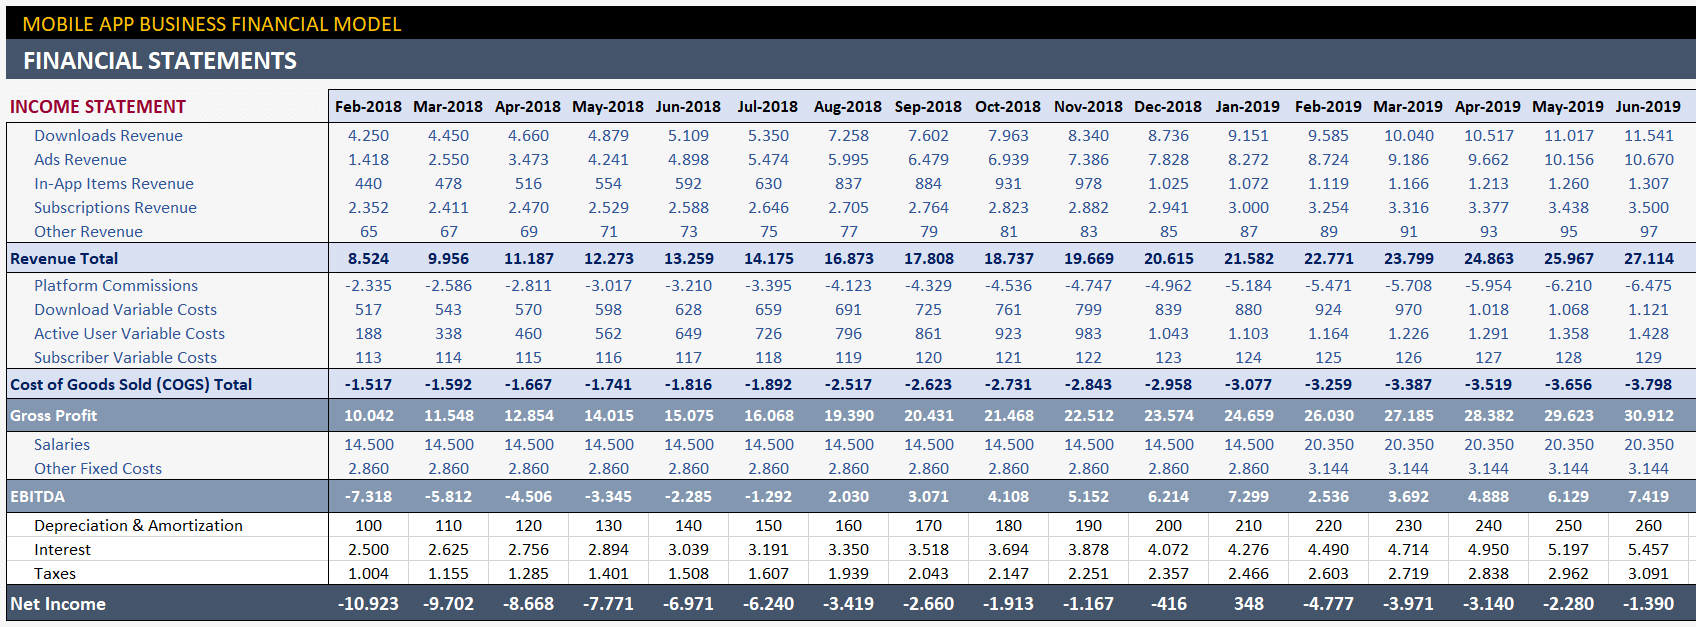
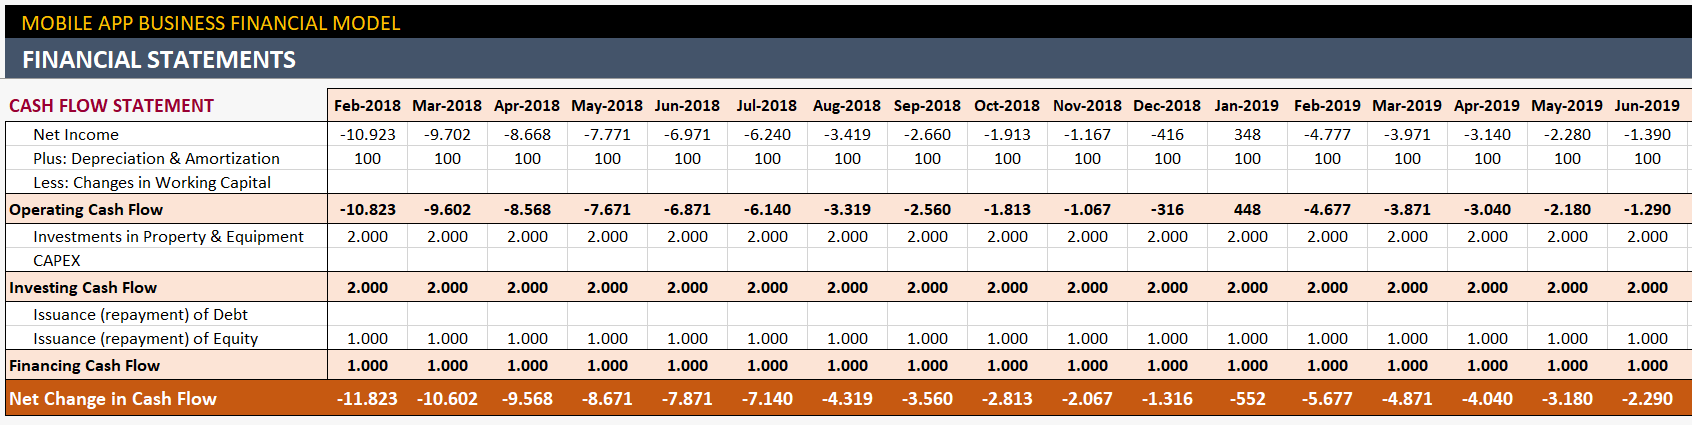
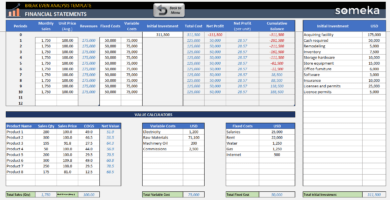
FINANCIAL STATEMENTS
In this section, you will set up three financial statements:
- Income Statement (P&L)
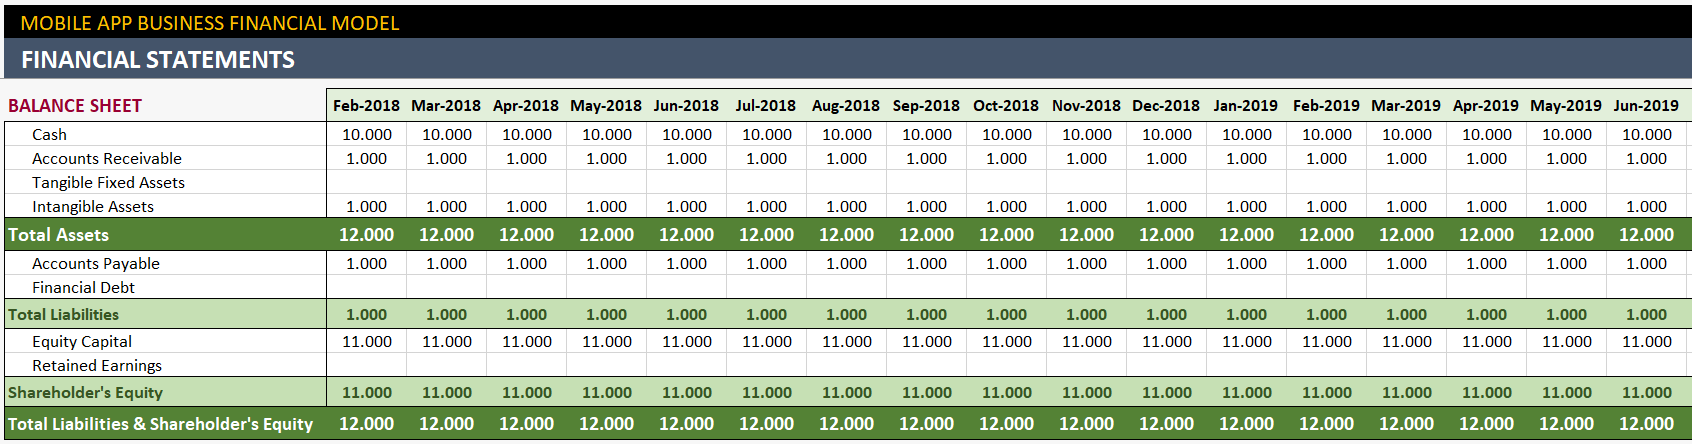
- Balance Sheet
- Cash Flow Statement
In the Income Statement, most of the fields consist of automatic calculations according to your entries from Input Sections. You will just need to input depreciation, amortization, taxes, and interest in order to reach Net Income.
For Balance Sheet and Cash Flow Statements, all formulas are set up and ready to be used. (You will need to fill out white areas)
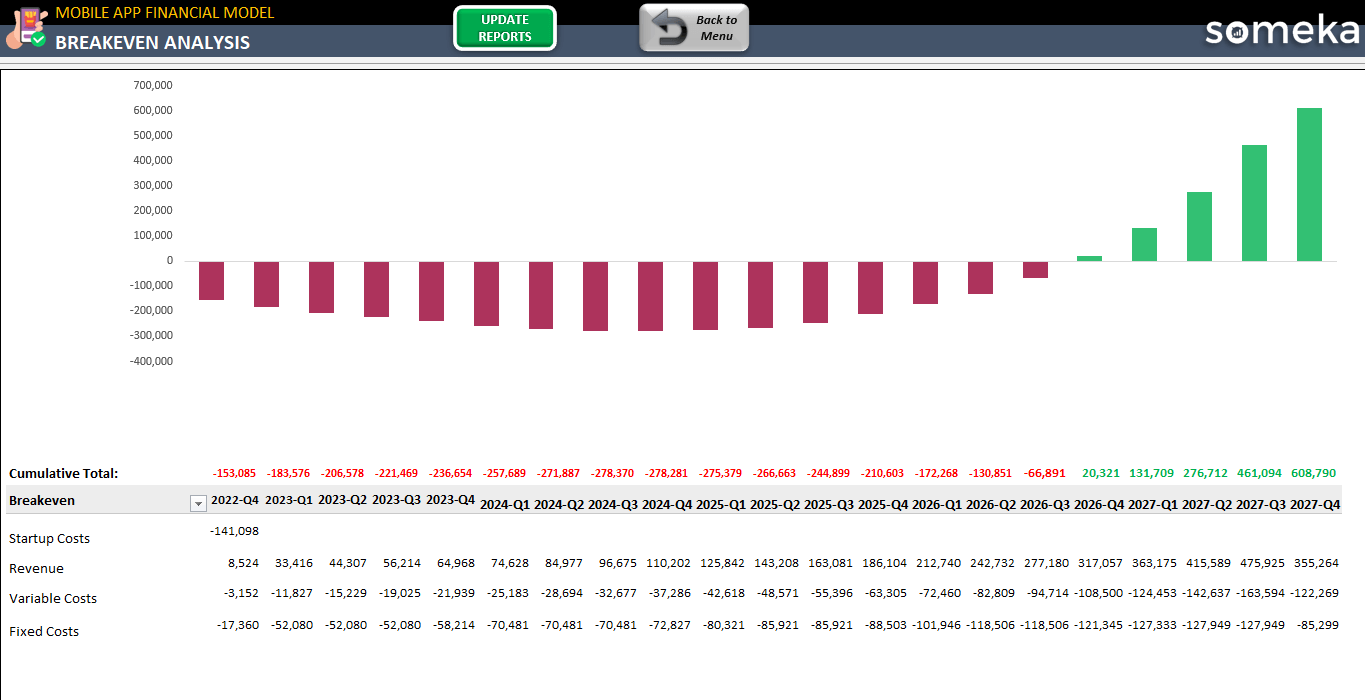
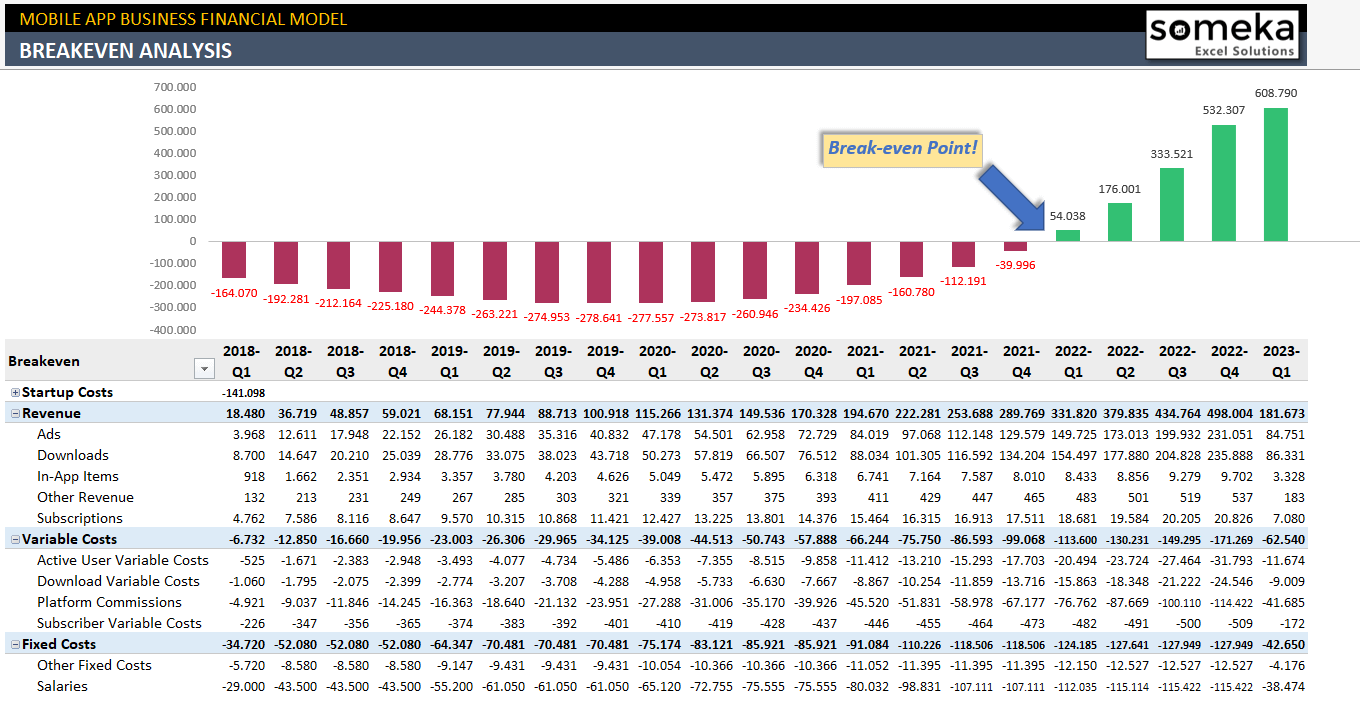
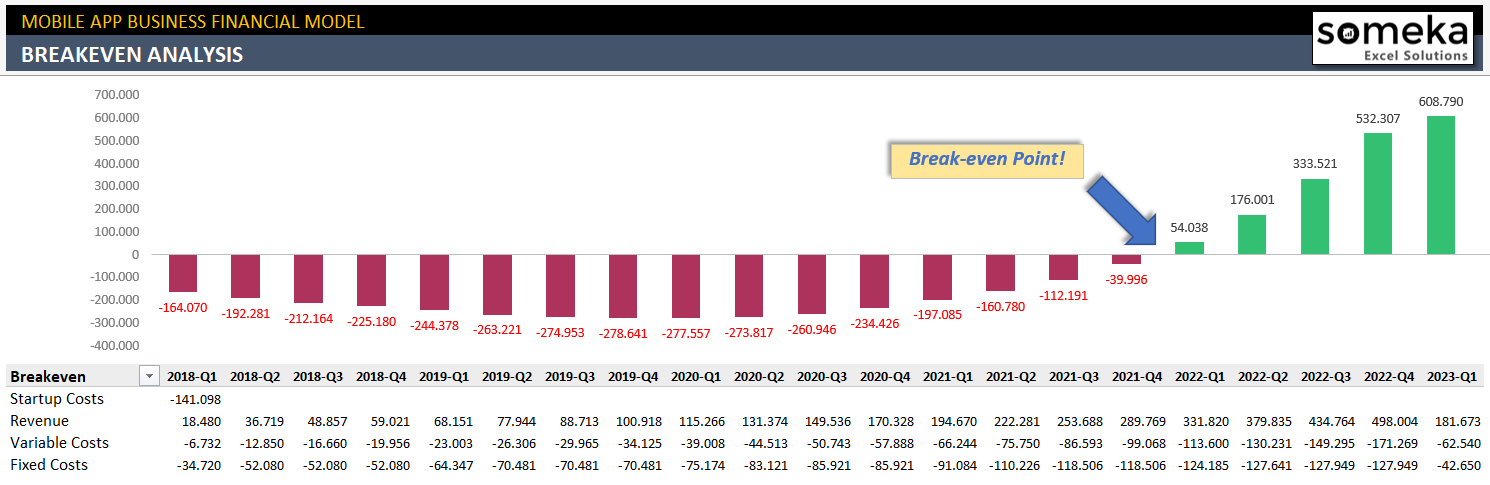
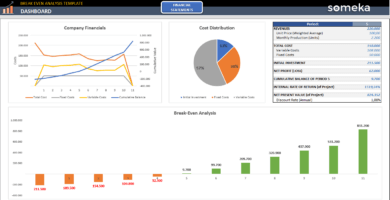
BREAK-EVEN ANALYSIS
Basically, the break-even analysis is one of the most critical reports in our financial model:
- This analysis shows us when we pay back (cover) all startup costs and start making profits.
- Most startups, start with a negative balance. What matters is how quickly you pay this back.
- If the break-even point is too far from what you expected, then you should increase revenues or decrease variable costs (like salaries for example).
- This is a pivot report so that you can change between Monthly / Quarterly / Yearly analysis by changing pivot fields.
OTHER REPORTS
Above all, there are several output reports in this mobile app financi model template which make it clear to see the situation from different aspects:
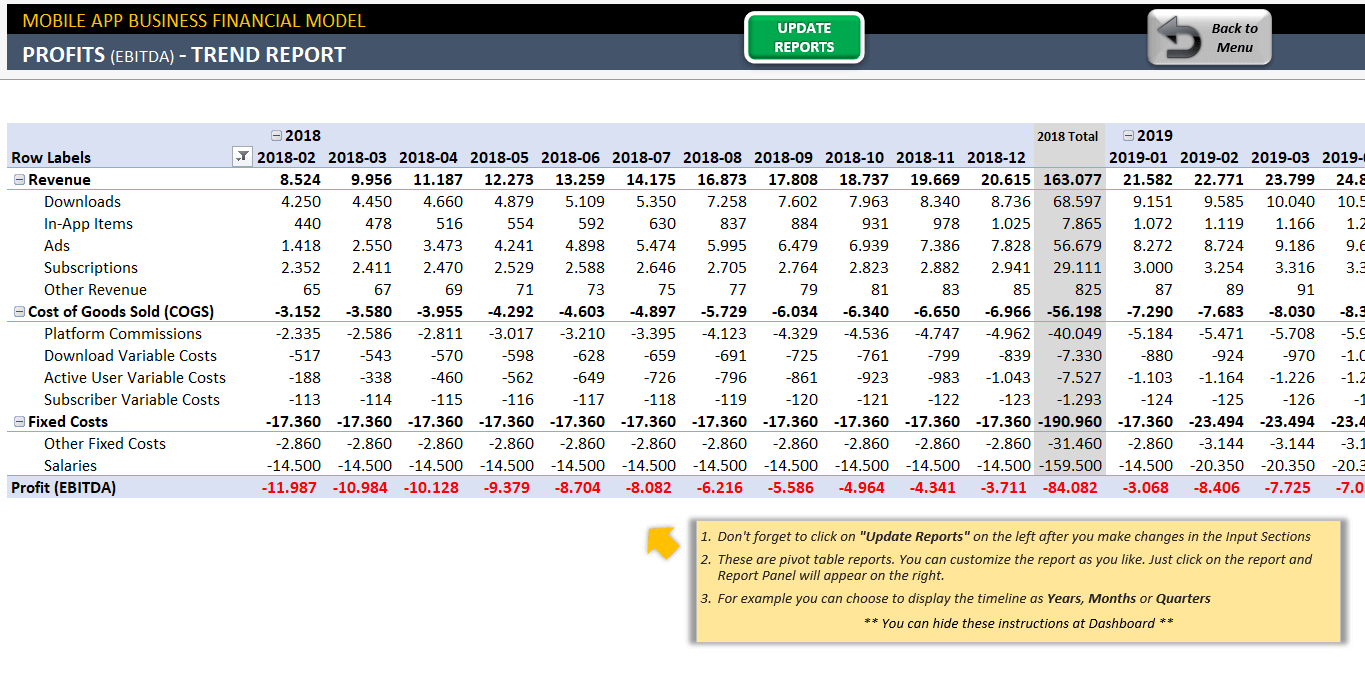
- PROFITS (EBITDA) – TREND REPORT
- MOBILE APP DOWNLOADS BREAKDOWN
- REVENUE DETAILS REPORT
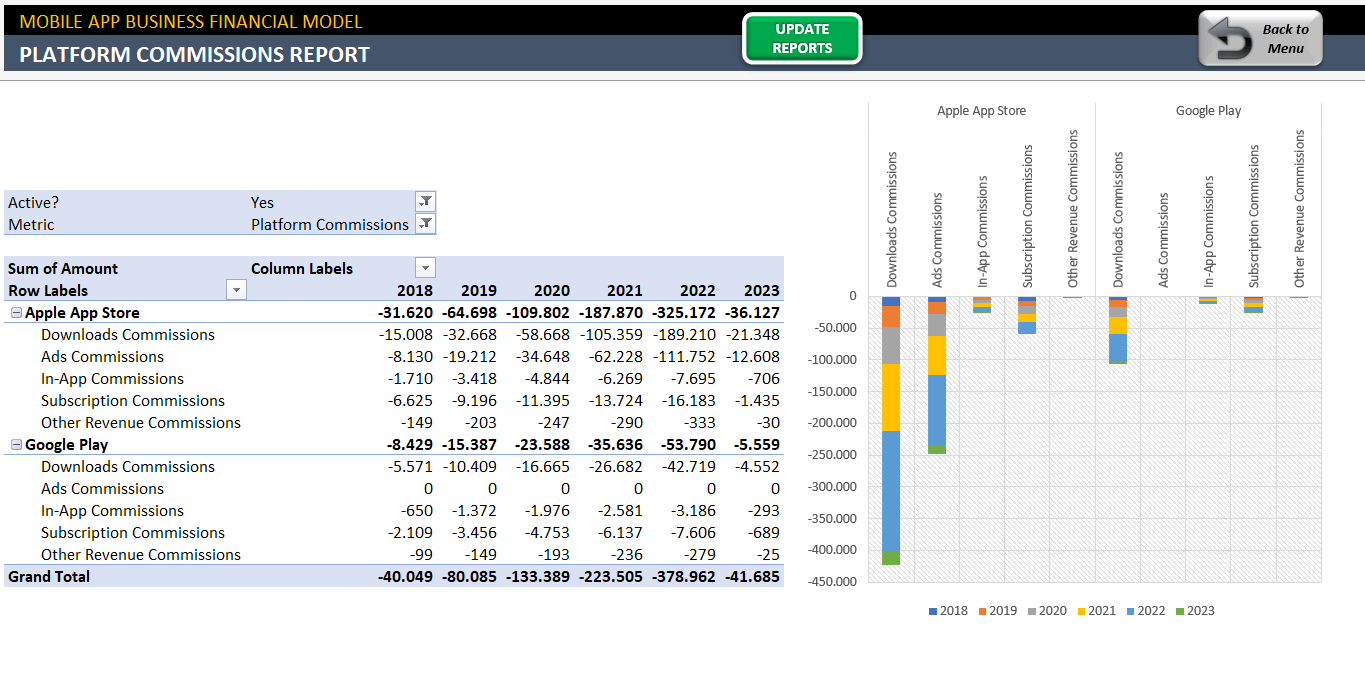
- PLATFORM COMMISSIONS REPORT
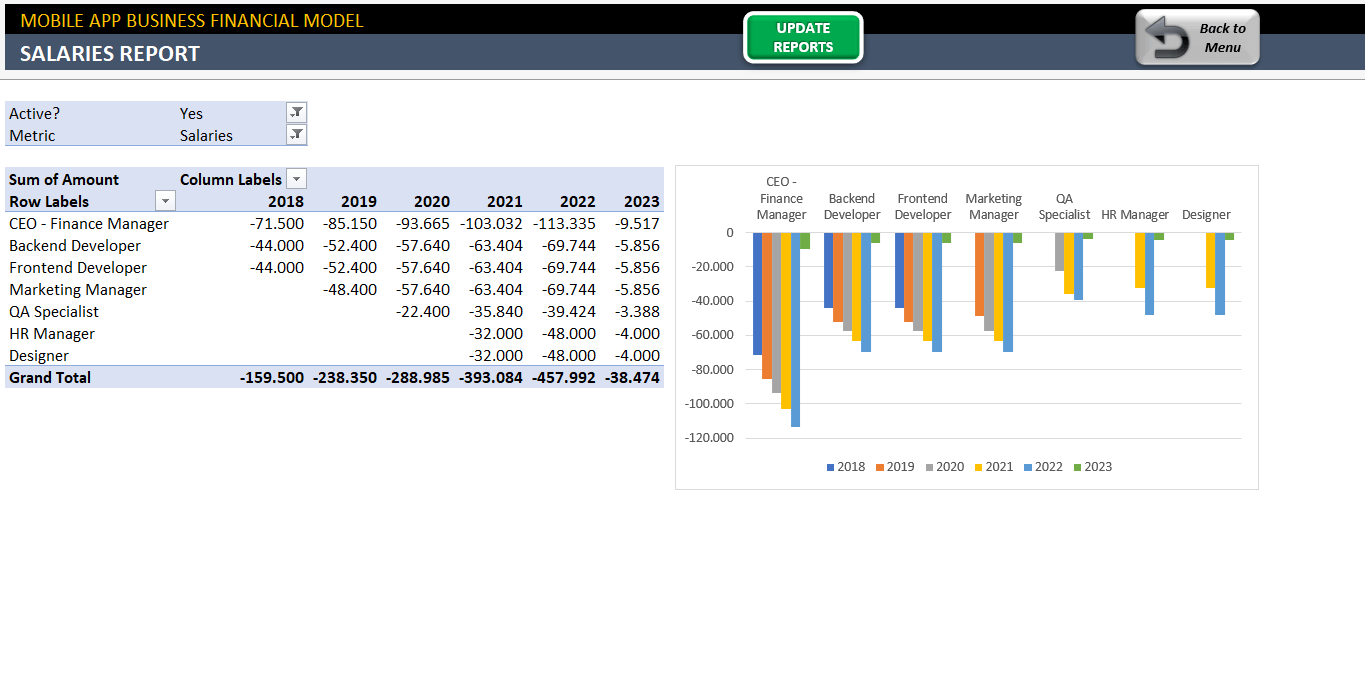
- SALARIES REPORT
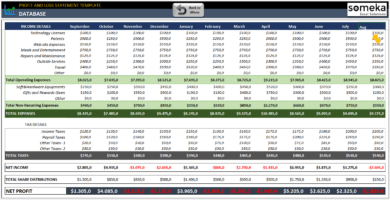
DATA SOURCE SECTION
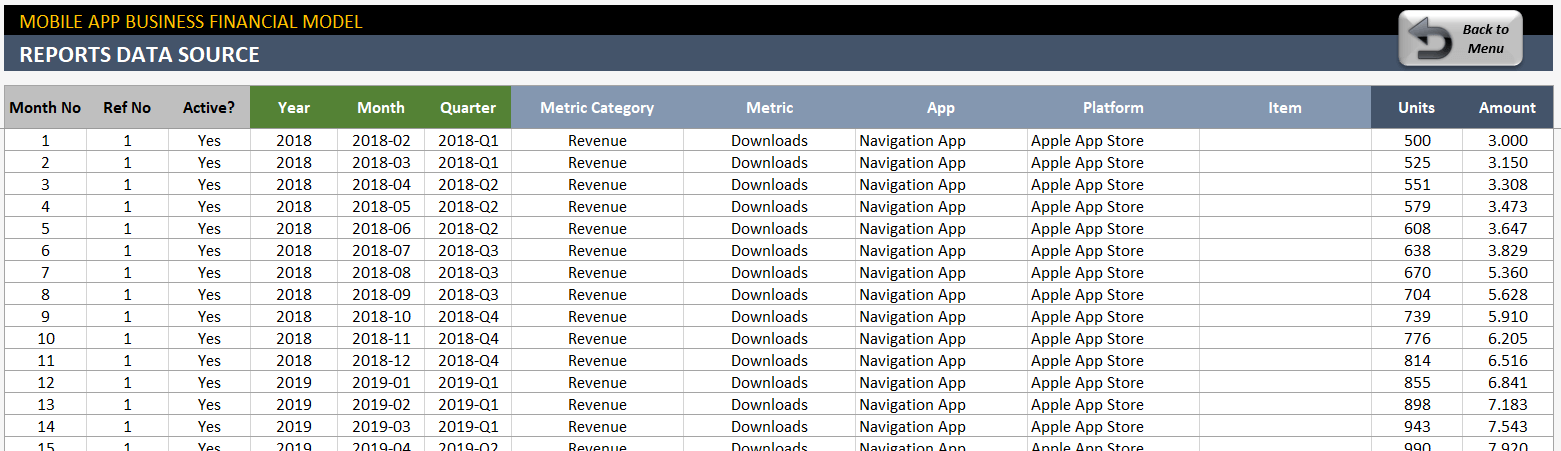
Actually, we have tried so hard to develop this template with an innovative approach. Thus, we thought managing all data and outputs from one place would be perfect so we created a Data Source section:
- In this section, we consolidate all tables from the input sections of the model.
- Then, the tool uses for output reporting.
- Even though we do not recommend manual modification to this table, you can make changes if you want.
All the reports are fed from this data source and you can change the parameters of the pivot reports easily.
MOBILE APP FINANCIAL MODEL EXCEL TEMPLATE FEATURES SUMMARY:
- Unique Excel Template to perform financial projections for mobile app
- Works both on Mac and Windows
- No installation needed, ready to use.
- Both user-friendly and sleek design.
- Different revenue models match the latest industry standards
- Innovative reporting system
- Financial Statements
- On Sheet Instructions
- Compatible with Excel 2010 and later versions
SOMEKA FINANCIAL MODELS COLLECTION
PRODUCT VIDEO
Watch the video below to see the template in action! Presentation also includes usage notes, explanations and tips & tricks about the template.

USER REVIEWS & COMMENTS
21 reviews for Mobile App Financial Model Excel Template
You must be logged in to post a review.
RELATED TEMPLATES
-
 This product has multiple variants. The options may be chosen on the product page
Expense Analysis Excel Template
$0.00 – $59.95Spend analysis spreadsheet. Monthly reporting for actual and estimated costs. Printable and dynamic dashboard with easy-to-fill tables. All in Excel.
-
This product has multiple variants. The options may be chosen on the product page
Break Even Analysis Excel Template
$0.00 – $59.95Break Even Analysis Template. Calculate profitability point. Automated charts and dashboard. Instant download file in Excel. Works on Mac & Windows.
-
This product has multiple variants. The options may be chosen on the product page
Retail Financial Model Excel Template
$0.00 – $199.95Easy-to-use Retail Financial Model in Excel. Feasibility study & budget for retail stores. Financial projections & cost breakdown. Fully printable.
-
This product has multiple variants. The options may be chosen on the product page
Restaurant Financial Model Excel Template
$0.00 – $199.95Excel spreadsheet template to make financial plans for your restaurant business. Helps you to prepare budget and run scenarios before/after investment.
-
This product has multiple variants. The options may be chosen on the product page
Gym Financial Model Excel Template
$0.00 – $199.95All-in-one financial planning tool in Excel. Feasibility study for gym business. Printable and dynamic charts. Ready for presentations. Easy to use.
-
This product has multiple variants. The options may be chosen on the product page
Profit and Loss Statement Excel Template
$0.00 – $59.95Profit and Loss Statement Template built in Excel. Includes dashboard and separate database with a clean interface. Fully printable and easy-to-use.
Sidney Mary –
Very well detailed. Good tool for a forecast issue.
Marshall R. –
Great, so usefull definately. Happy to have it!
Ryan Pears –
Simply, Amazing! This template includes amazing detailed information and features. Excellent work.
Camille Burkel –
awesome tables! Thx so much
Vincentero –
a reliable source of information!!!
for creating a financial model’s uptake curves for mobile apps.
A97Benjamin –
Becoming a former economist, I have to create financial models because operating a business needs some change, but this one makes all of the work clear.
Josh Harrison –
A lil complicate to customize, takes too long.
Marvin Alvarado –
Super duper!
Bentley Ford –
Great! But can I get the breakeven as a repport?! Table?
Someka –
Hello, Bentley.
Thanks for contacting us!
A detailed explanation may be found in the product description. You can see it again in the connected image below. To get your Breakeven Analysis results, you simply need to press one button.
Hope that helps!
Sophie –
How many cost types can I see on it? I couldn’t check my advertising cost properly!
Someka –
Dear Sophie,

You can see and check “Variable”, “Fixed”, and “Startup’’ costs on the dashboard. However, you can also check the parameter of the advertising income model by clicking only one button. Check out the image below.
If you still need some extra help, please reach out to us: at contact@someka.net
Hope it helps!
Luca –
I gave 4 because for ‘subscriptions” instead of allowing me to add a % of the retention rate from the downloads, I have to go back to both the downloads figures and the retention figures that I previously inputted on every single month for every line of revenue to do the calculation on the side and to make sure I don’t input a number that is higher than the retention rate…all this could be done as a % like you set up for retention…that wahy we input a %-only of “how many people that are still in the APP after one month will decide to subscribe and pay”, that way it would save me a lot of time. Is there already a way to do it faster like that?
Someka –
Dear Luca,
If you have made sure you’re using the unzipped file in a licensed Microsoft Excel version aligning with the product requirements (Excel 2010 and later versions), then we can only advise you to generate a fresh file from the download link and paste your data there (paste special as values, in order not to corrupt the format). Please make sure to save your current file in order not to lose data.
If this does not work too please send your file to us so we can use your data on our versions to showcase the proper functionality of the product.
Also, in case you haven’t come across it yet, here is the product tutorial video showcasing the product use and features: Mobile App Financial Model – Product Video
As per including a % for retention rate, in our product you may input the “Monthly Average Retention Rate” per product and platform from the “Userbase” sheet:
According to your input here the “Cumulative Active Users” tables will be automatically updated. (Grey cells are always for calculations, there should be no manual entry in these section)
Kindest regards
Dawas –
Dears, can I kindly ask what is the meaning of this average minutes per session column?
Someka –
Hi Dawas,
Thanks for your interest!
We have explained it in the product description above. But, we attached a picture below again to show in case you couldn’t find it.
Hope that helps!
Johann Mushi –
superb
Josh Harrison –
Too complicate to customize, takes too long.
a.barrie –
I am engineer alum and need to develop financial model because retention model needs some re-working but this one clarify every piece of work.
A Saher –
It is amazing. wish it had “10 years forecast”
Someka –
Thanks for your comment! You can only choose from 1 to 5. Industry standard for financial forecasting is 2 years and max 5 for long term plans. 10 years is too long and nearly impossible to guess slightest parameter.
sakkuralma –
Good source of data for mobile app uptake curves building out a financial model.
Denise juma –
flipping awesome what i have been looking for. tha k u so much
Ryan Clines –
Simply WOW! marvellous detailed info and wonderful features are given in this template. Very well done.
Giu R. –
Well, usefull definately. ( I would have found it more esay and logical to give the expected total downloads goals per year, and the template would calcluate the increase inbetween, instead of me giving evey month manually in a projection of 3 or 4 years) But I am super happy I found it
Someka –
Thanks a lot for your comments Giu!
As we also discussed with you, both methodology has pros and cons. We have chosen this for being a more generic approach for most people.
Thanks again and glat that was useful for you.
Nick Anderson –
Very powerful. Good option for a forecasting.