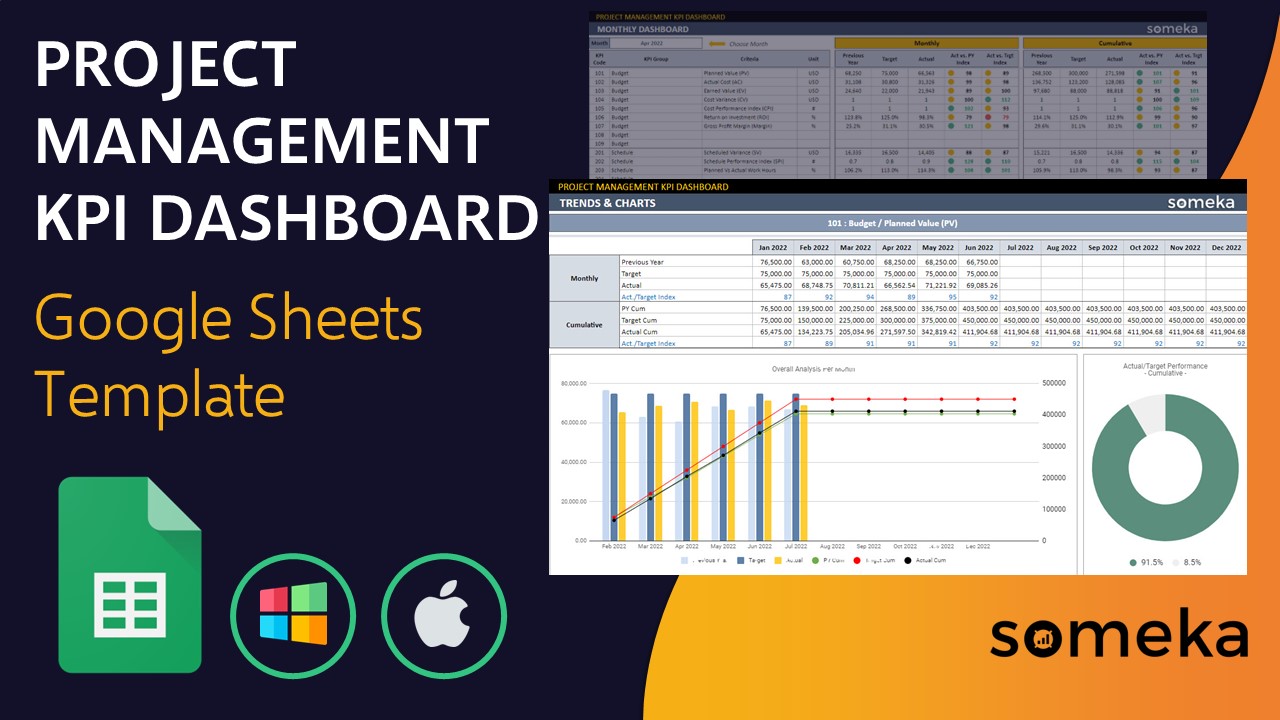
Project Management KPI Dashboard Google Sheets Template
KPI dashboard in Google Sheets for project managers. Monthly comparisons with trend charts. Ready-to-use template with access from all devices.


TEMPLATE DESCRIPTION
Running a business is not easy. You need to constantly monitor the progress of your projects and your competitors. But, how do you know if you’re doing well? That’s where Project Management KPI Dashboard Google Sheets Template comes in.
To clarify, this tool will help you identify your best projects and some key metrics to track your progress and OKR (Objectives and Key Results) metrics. All-in-one tool for project managers and PMOs.

8 benefits of using Project Management KPI Dashboard Google Sheets Template:
1) It is a time-saving tool
2) You can easily track your project’s progress altogether
3) The trend charts make it easy to identify any changes in performance over time
4) It helps you set realistic goals for your projects and measure their success accordingly
5) You can quickly spot potential problems and address them before they become bigger issues.
6) It keeps everyone on the same page by providing a common view of key metrics
7) You can use this Project Management KPI Dashboard Google Sheets Template, as a learning tool to help improve your project management skills
8) The templates are customizable, so you can tailor them to fit your specific needs (After you purchase the Premium Version)

Key Project Management Metrics
Besides, with all this information at your fingertips, there’s no way you won’t be able to track the 6 most important KPIs in this Project Management KPI Dashboard Google Sheets Temple:
1. Cost Performance Index (CPI): Measures the cost efficiency of a project. A CPI below 1 indicates that the actual costs are greater than the budgeted costs, while a CPI above 1 means that the project is under budget.
2. Schedule Variance (SV): Tracks how much work has been completed compared to what was initially planned. An SV value above 0% suggests that the schedule is ahead of plan, while a negative SV value means that work is behind schedule.
3. Budget at Completion (BAC)/Estimated Cost at completion (ECC): Estimates how much money will be spent on a project in total and can help track whether or not projects are staying within their budgets.
4. Earned Value Management (EVM): Combines three key metrics- BCWS, ACWP, and PV- to provide an accurate assessment of where your project currently stands financially.
5. Project Duration: Tracks how long it took for a particular project to be completed from start to finish.
6. % Complete: Finally, this metric shows how far along in terms of percentage completed each task or phase is within your overall project.
Sections of Project Management KPI Dashboard Google Sheets Template
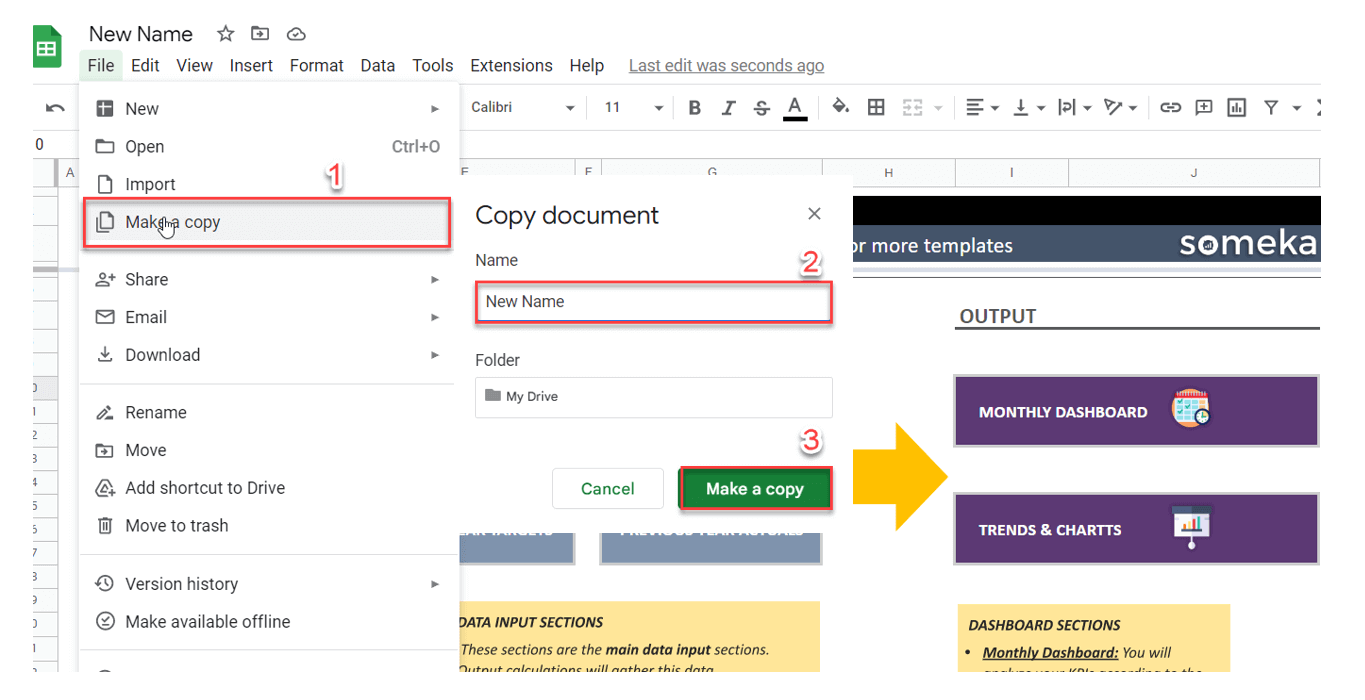
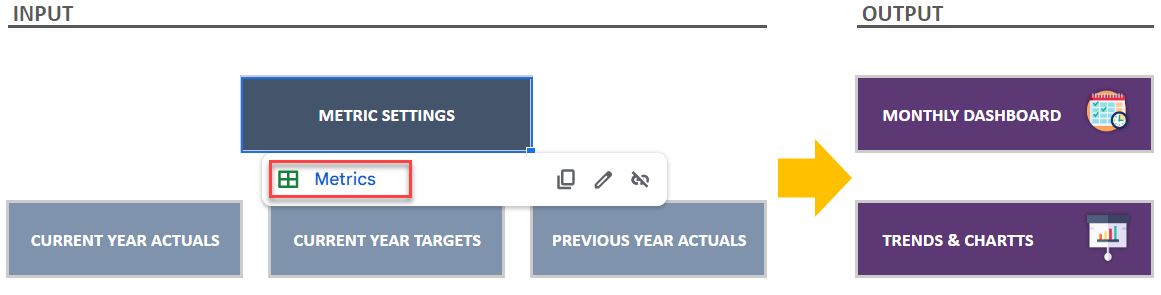
Basically, this template is split into two parts, input, and output. In the first sheet, you can see the Navigation Menu, which is useful for transferring between sheets and getting an overall view of the template’s foundation. Let’s check the other sheets in detail:
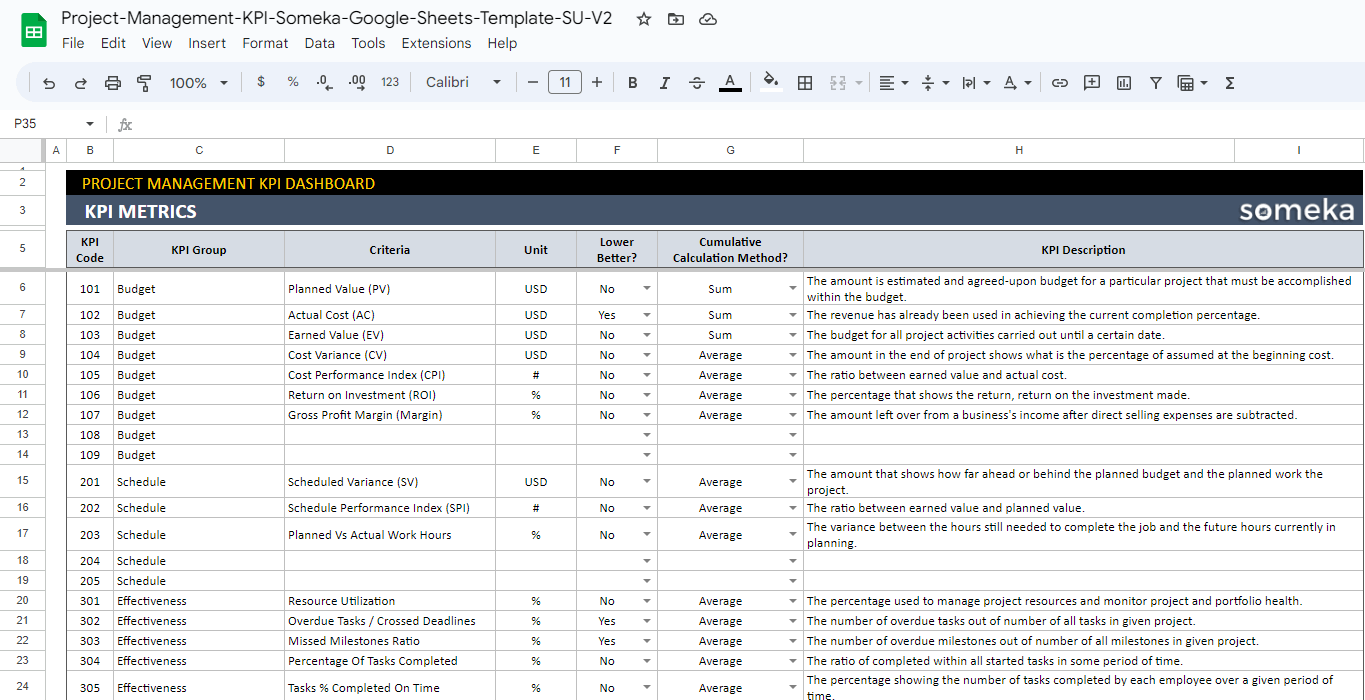
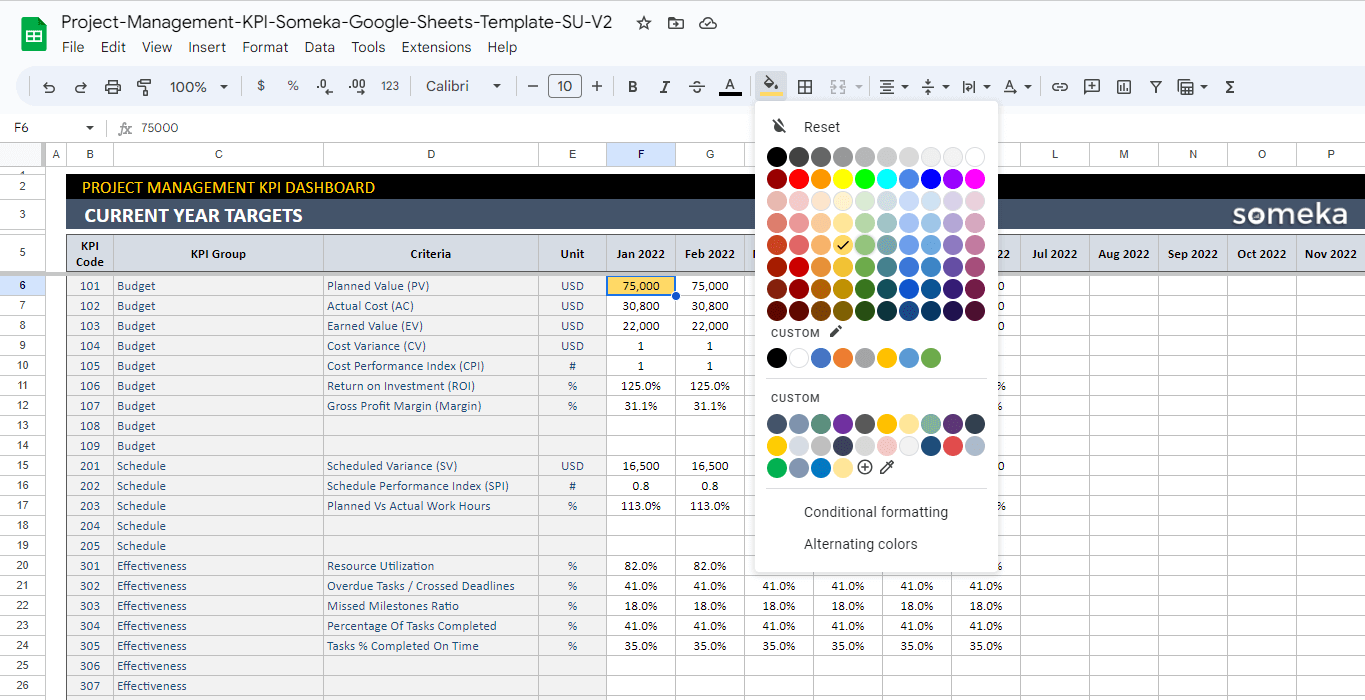
Defining Metrics:
Firstly, you can add your metrics here along with their category, unit, and even a brief description of each metric. This serves as the template’s basis. As a result, to more clearly define your objectives, always consult with your team, find out their opinions, and strive for extreme detail in this section.
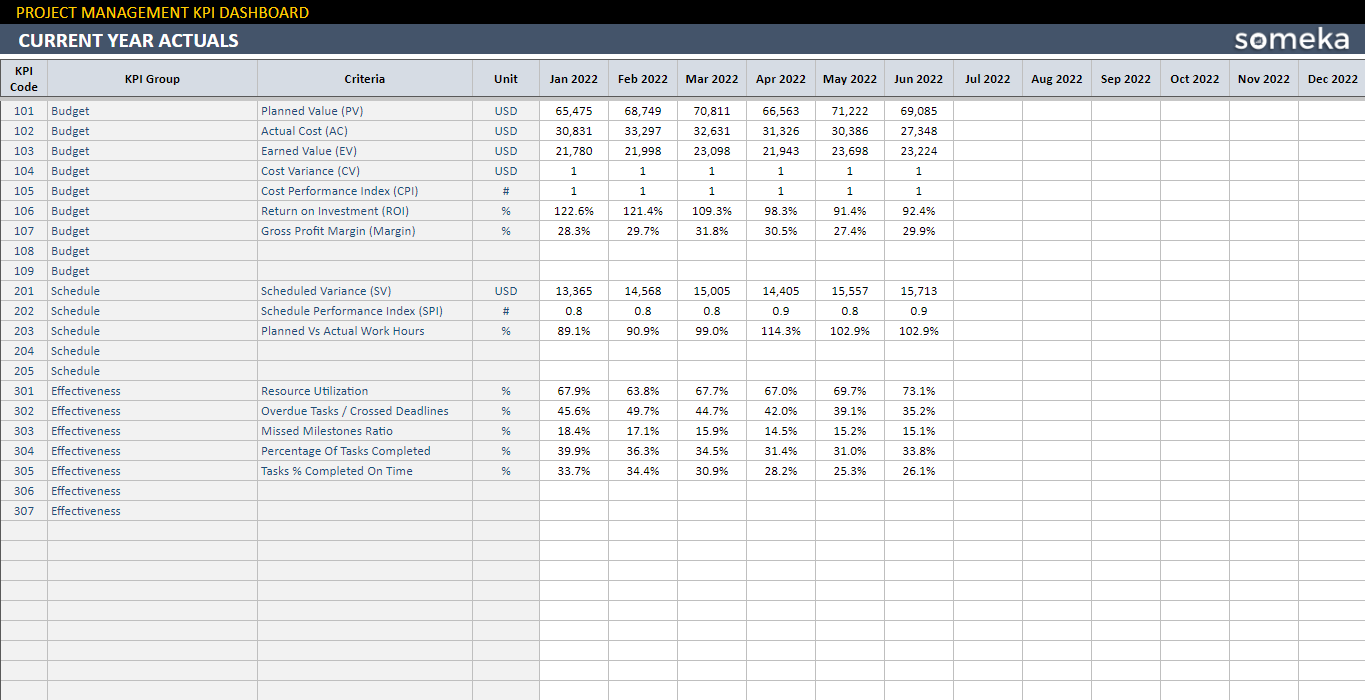
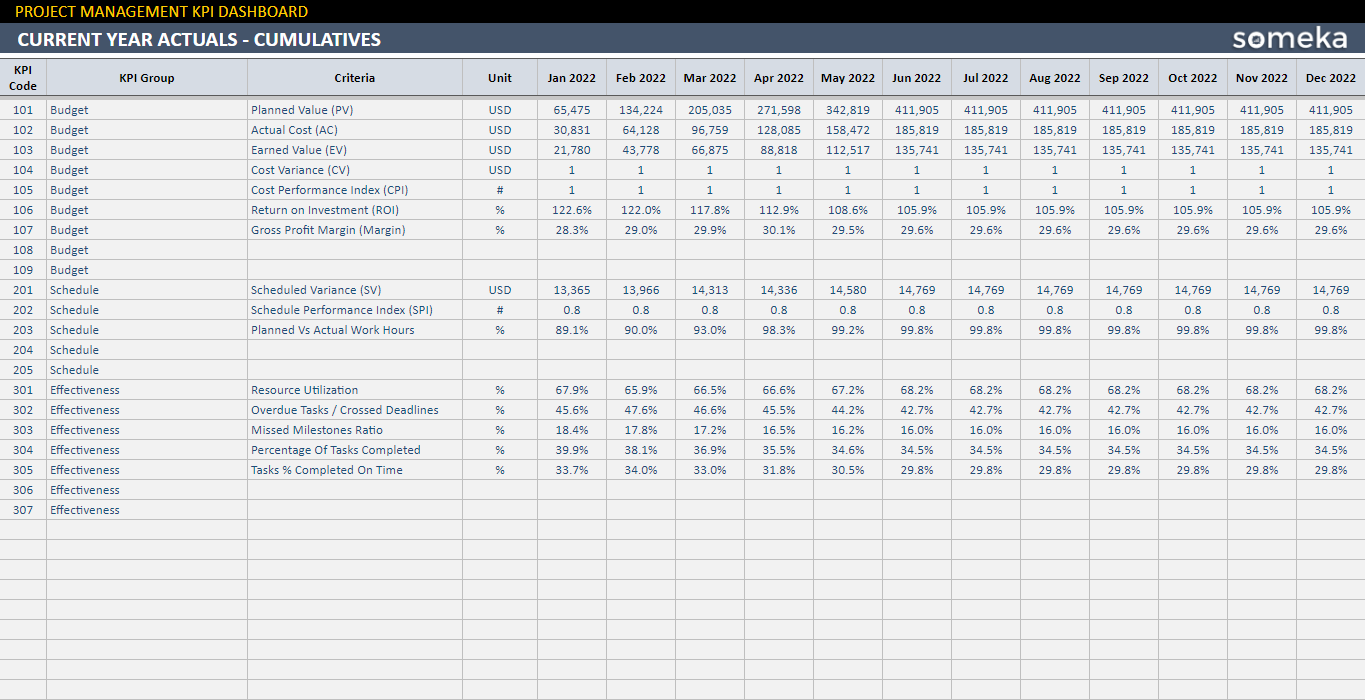
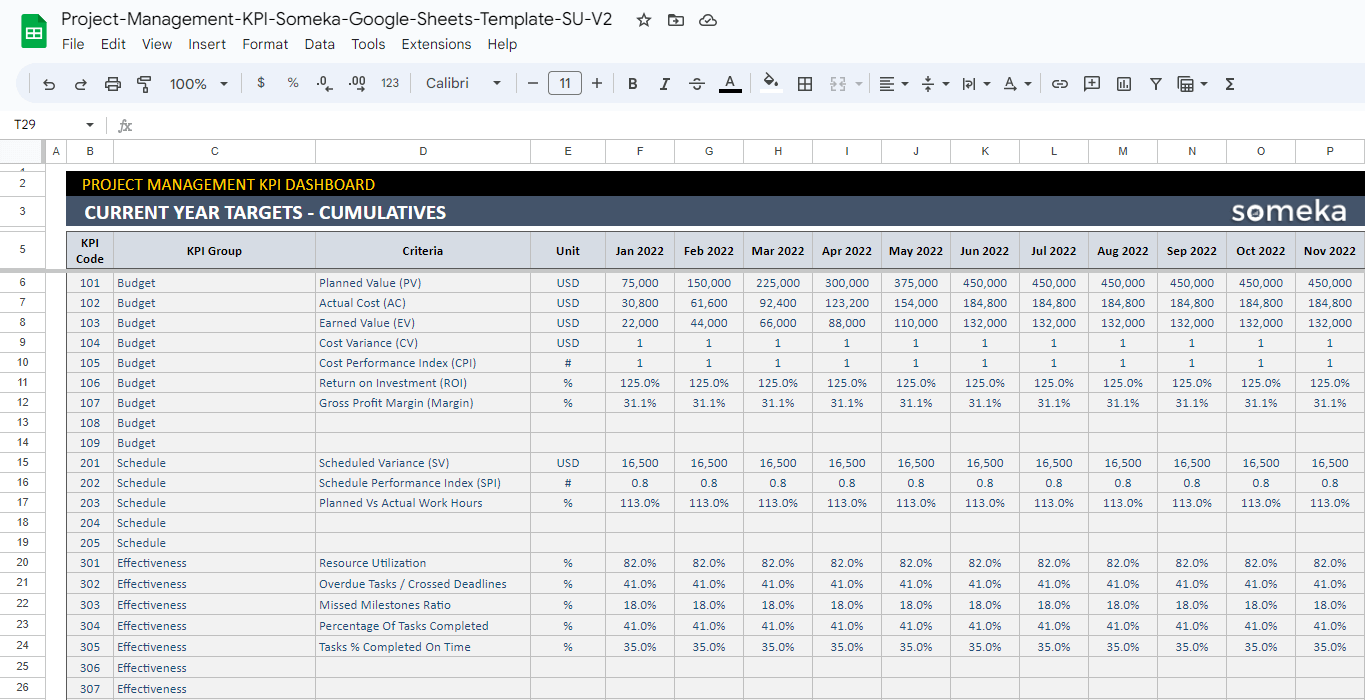
Actual and Target Values from the Current and Previous Years Actual:
Secondly, the KPI Dashboard Google Sheets Template calculates the current year actual cumulative, current year target cumulative, and previous year actual cumulative after you add the results for each month to the sheet.
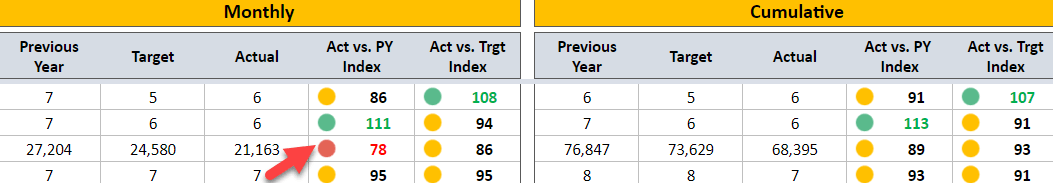
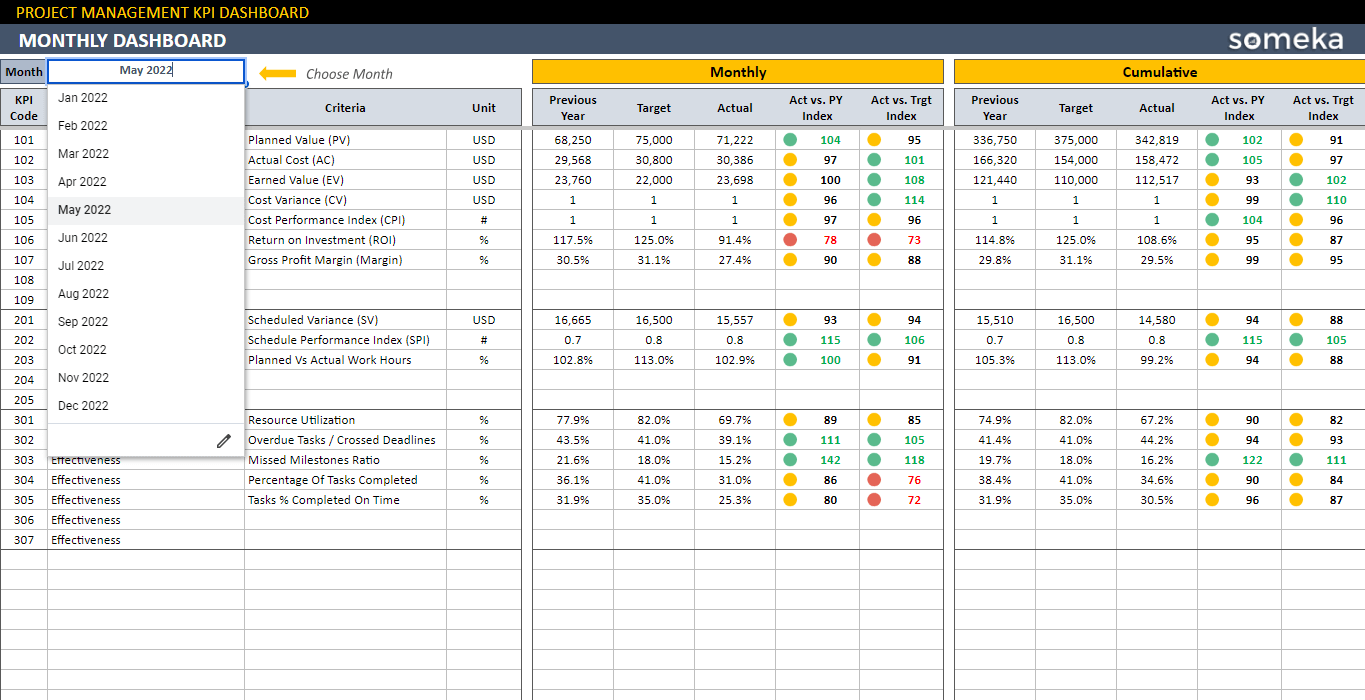
Monthly Analysis of Project Management KPI Dashboard Google Sheets Template:
Select Month in this section to compare monthly and cumulative results.
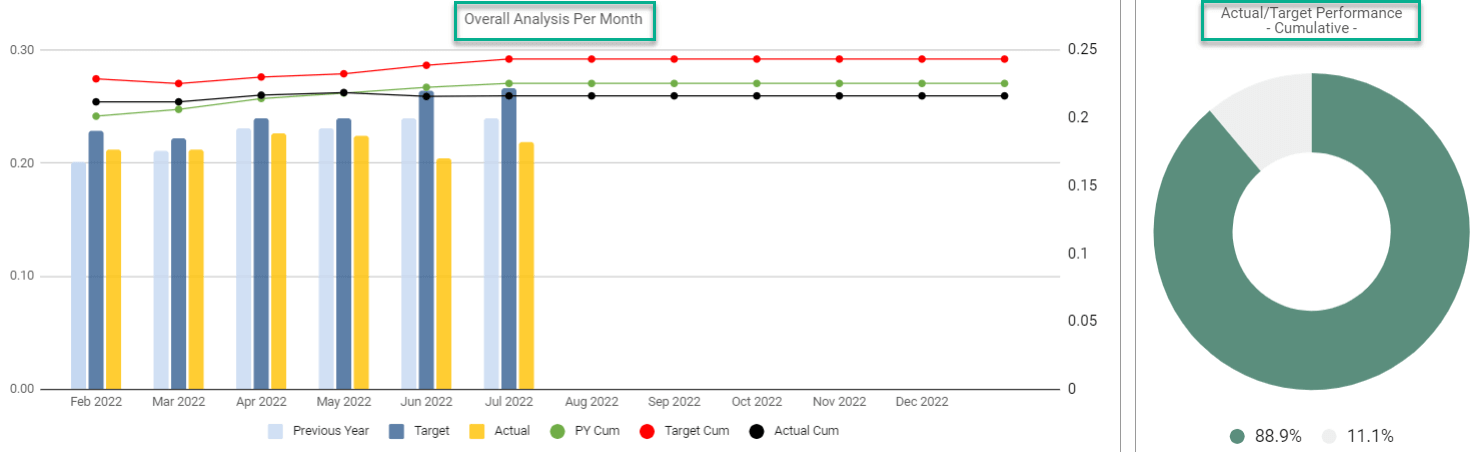
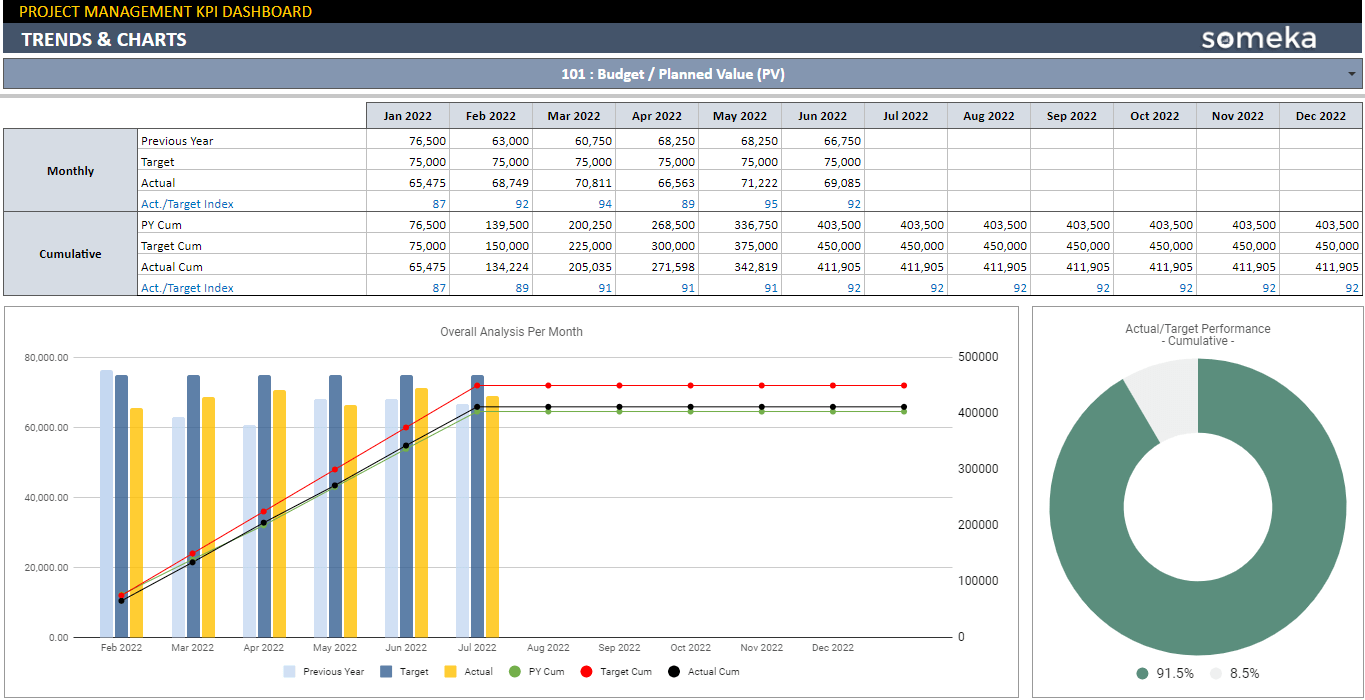
Trends and Charts:
Finally, here is an all-inclusive tool for managers who wish to display KPI and metrics results over time. So, simply choose your KPI to gain access to 3 different types of charts.
Meanwhile, all you need is an internet connection and a Google account to get started. And everything will be in sync!
Project Management KPI Dashboard Google Sheets Template Features Summary:
- Productivity tool for project managers in Google Sheets
- Historical data with using Trends Charts
- Monitor each measure every month to be more goal-oriented
- Define a specific Unit for each metric
- Ready to Print template
- Informational notes included
- Ready to use template
- Works on any operating system
- Suitable for any device including mobile, tablet, desktop
GOOGLE SHEETS KPI DASHBOARDS COLLECTION
PRODUCT VIDEO
Watch the video below to see the template in action! Presentation also includes usage notes, explanations and tips & tricks about the template.
USER REVIEWS & COMMENTS
9 reviews for Project Management KPI Dashboard Google Sheets Template
You must be logged in to post a review.
RELATED TEMPLATES
-
 This product has multiple variants. The options may be chosen on the product page
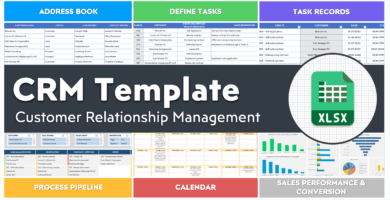
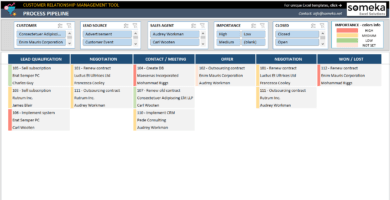
Excel CRM Template
$0.00 – $79.95Easy-to-use yet powerful CRM Template in Excel. Track your tasks, customers, meetings with a kanban dashboard and calendar. Works in Mac & Windows.
-
This product has multiple variants. The options may be chosen on the product page
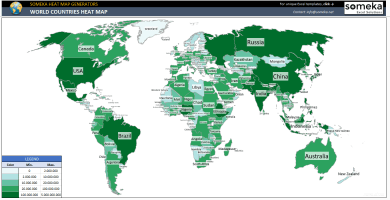
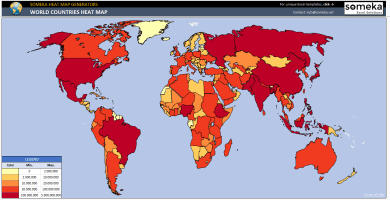
World Countries Heat Map Generator Excel Template
$0.00 – $69.95World Heat Map Excel Template will visualize your data on the global map. Put your data and heat map will be created and painted automatically.
-
This product has multiple variants. The options may be chosen on the product page
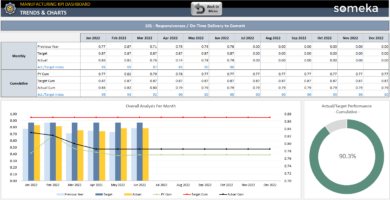
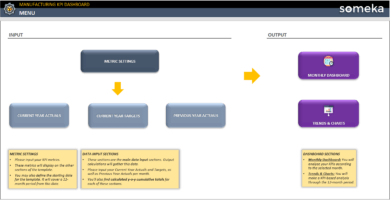
Manufacturing KPI Dashboard Excel Template
$0.00 – $79.95Manufacturing KPI Dashboard Template in Excel. Includes most used key metrics for production with trending charts, contrast analysis and much more.
-
This product has multiple variants. The options may be chosen on the product page
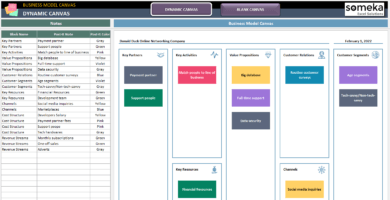
Business Model Canvas Excel Template
$0.00 – $59.95Excel spreadsheet to create visual business plans. Summarize your key business factors on a lean canvas within minutes! Detailed guidance included.
-
This product has multiple variants. The options may be chosen on the product page
Recruitment Tracker Excel Template
$0.00 – $79.95Recruitment Tracker Template in Excel. Ready-to-use applicant tracking system to help hiring process. Includes HR reports and dashboard. Works in Mac & Windows.
-
This product has multiple variants. The options may be chosen on the product page
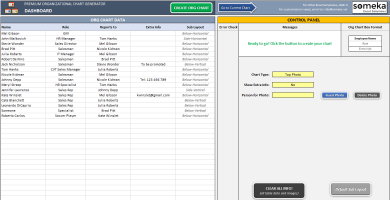
Excel Automatic Org Chart Generator
$0.00 – $79.95Turn your Excel employee list into an org chart with photos automatically! This easy-to-use spreadsheet is a huge time saver for business people.
Adam Kowack –
Before this work, I was thinking to use some Saas tool for my projects but Your googlesheet has a pretty look and easy to use for non-tech employee like me. For assistance
Customer service is also fast and efficient. I advise whose looking for low-cost options
Pierre V. –
This template has a solid structure, but it does not automatically update formatting. When you change absolute values to percentages%, the dashboard does not update.
Someka –
Thanks for the feedback, Pierre! In fact, values are reflected automatically but if you replace the default units you also have to change the number formatting on the dashboard automatically.
94leon.K –
The performance of the tool on our project can be compred to the projec methodologes using. Thx so much!
Someka –
Salut, Fabien

Thanks for the comments! You can modify the current KPIs or add new ones on your own. Please check the image, below. If you need help at all: contact@someka.net
Thomas Munch –
This item’s creators appear to be project management professionals because, from the perspective of methodology, it is considerably more in-depth without making you feel like you need a manual to operate it. Finding this in products of this category is difficult. They are quite knowledgeable in project management methodologies.
Brian –
It allows me to create sophisticated report for my business, giving me the ability to add new metrics to dashboard, develop meaningful cumulative results and analyze it offline anytime and anywhere.
Molly –
This tool, which turns data into a visual dashboard, has helped us keep track of what’s important to us. I appreciate being able to see individual results for each metric in one place through a visual graph. Besides that, the ability to work so extensively on Googlesheet is GREAT!!
Chadson Ch. –
measuring and comparing our performance is very easy with your product we liked your style. it is easy to understand. and includes our needs.
Harry Klinston –
I bought two templates from their KPI collection, and this is my new favorite. It’s extremely resilient and simple to use. I’m excited to get more of their tools.
Someka –
Hello Jeff
We would almost certainly upgrade your license from single-user to multi-user. Simply send us an email at contact@someka.net and our team will get back to you with a link to upgrade your license.
Jennifer –
nice google sheets work but one need: unlock the sheet
Someka –
Hi Jennifer,
You just need to unlock both worksheets as it showed in this link.
If you still need assistance please contact us: at contact@someka.net
Hope this helps!