Box and Whisker Plot Google Sheets Template
Create box and whisker plot charts and visualize your data distribution in Google Sheets. Fully printable. Available on all devices.


TEMPLATE DESCRIPTION
Do you have a big data set that you want to know if it is right skewed or left skewed? If you are interested in data analysis, you are also aware that a box plot is a helpful tool for this kind of job. However, big data sets might be complicated to generate a box and whisker plot. That’s why we developed the Box and Whisker Plot Google Sheets Template.

Using our box and whisker plot maker is very easy. You just need to fill in the full data or short data in the template and your boxplot. To explain further, let’s dive into the features of this template.
Box and Whisker Plot Google Sheets Template Features
There are 3 different sheets, which you will use, in our whiskers template.
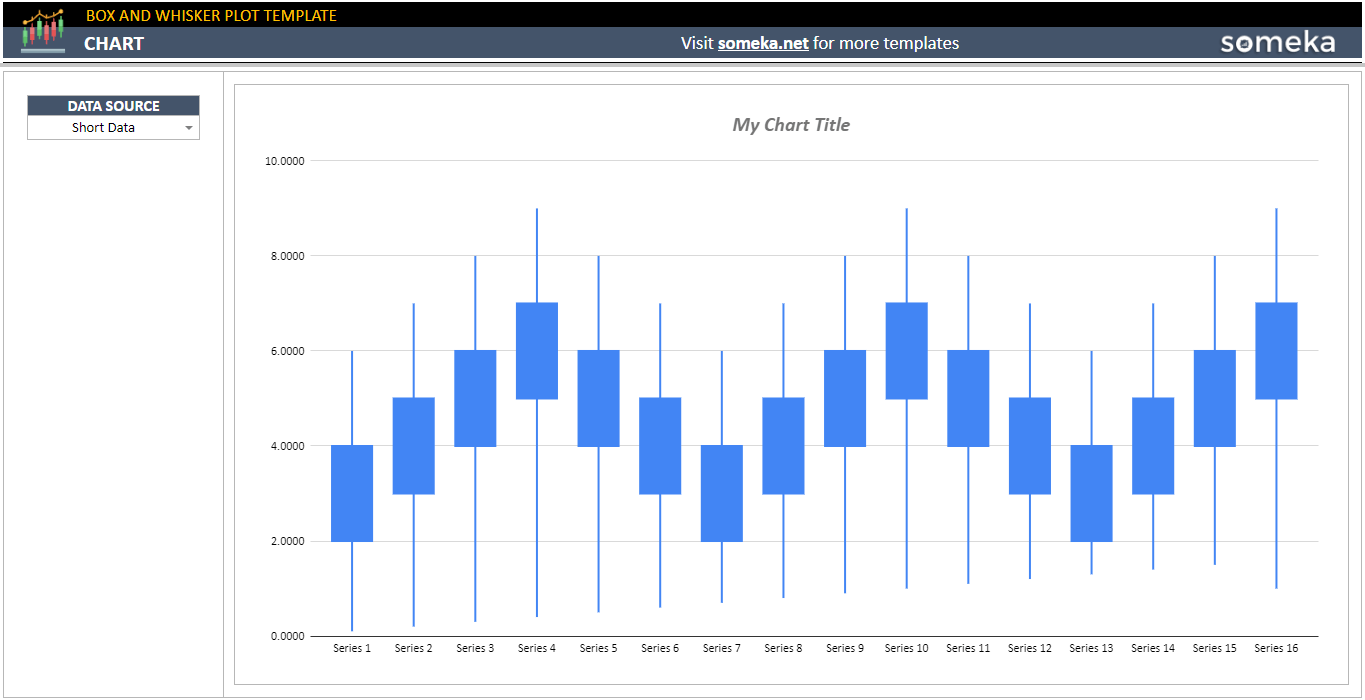
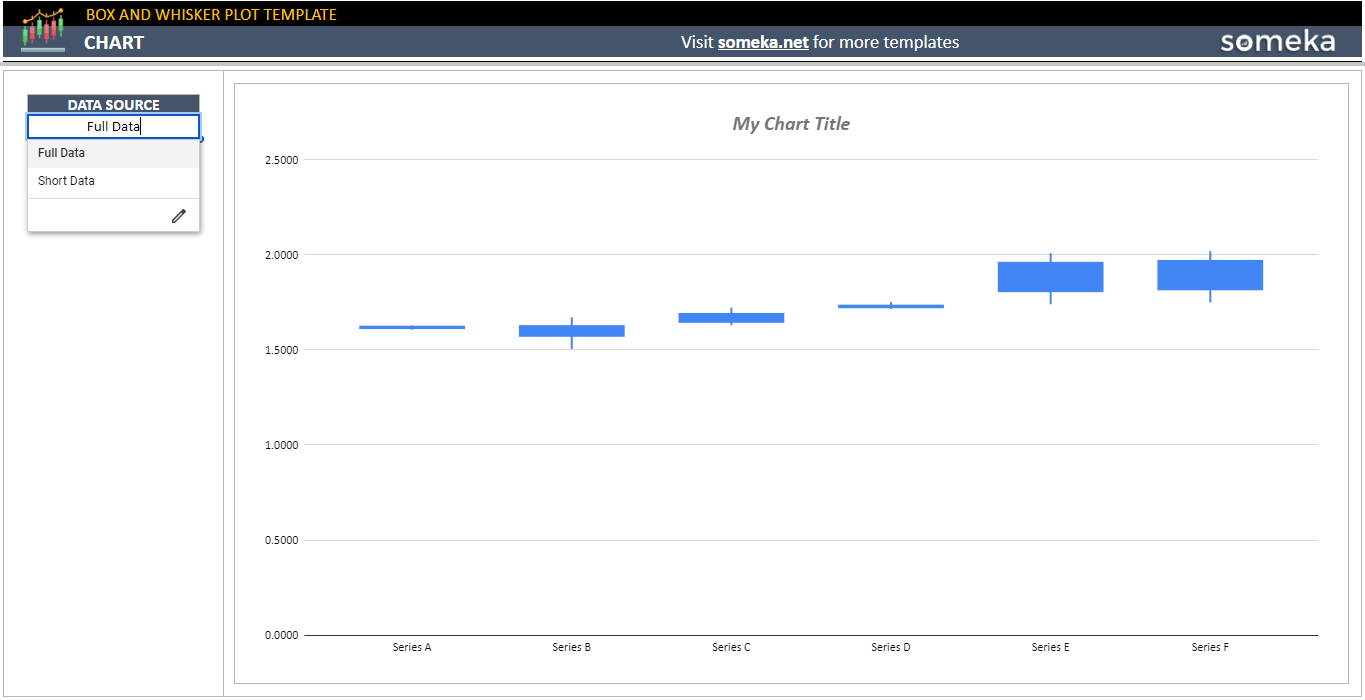
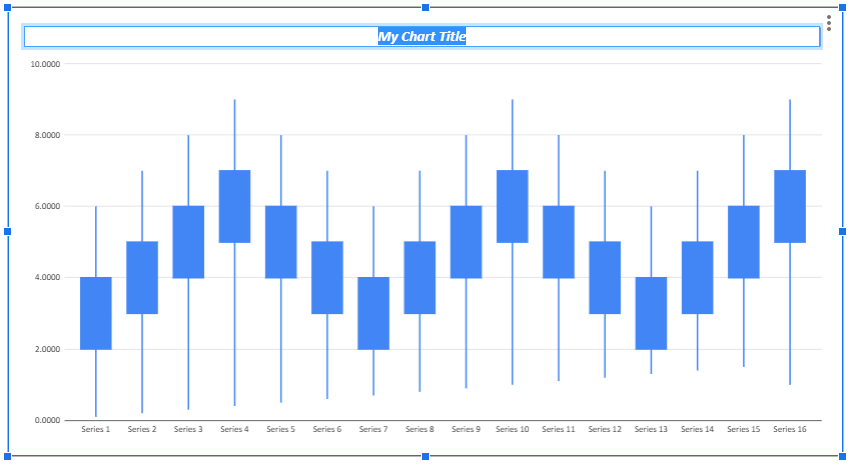
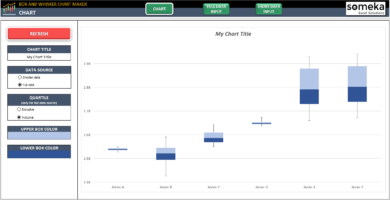
Chart
The chart section is the first sheet you will see in the Box and Whisker Plot Google Sheets Template. You need to enter your data set in either the short data sheet or the full data sheet. Then, your chart will be ready on this page.
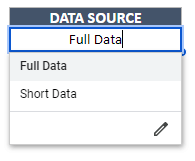
On the left side of the chart, you will see the Data Source settings. In this part, you can choose to create a box and whisker plot with either Short Data or Full Data.
We would like to remind you that the chart is ready-to-print and you can also simply copy paste it and use it on your presentations.
Moreover, you can effortlessly change the name or the style of the chart. So, just double click on the chart and edit it from the Chart Editor.
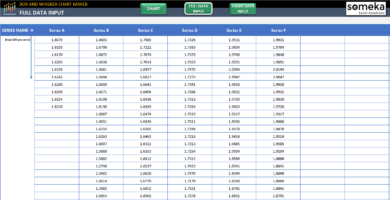
Full Data
You can enter many series of data sets in the Full Data in the Box and Whiskers Plot Google Sheets Template. Besides, you don’t need to specify the Min value, Max values, or quartiles in this sheet. Just input all your data. Then, the box plot calculator will determine them and create the chart for you.
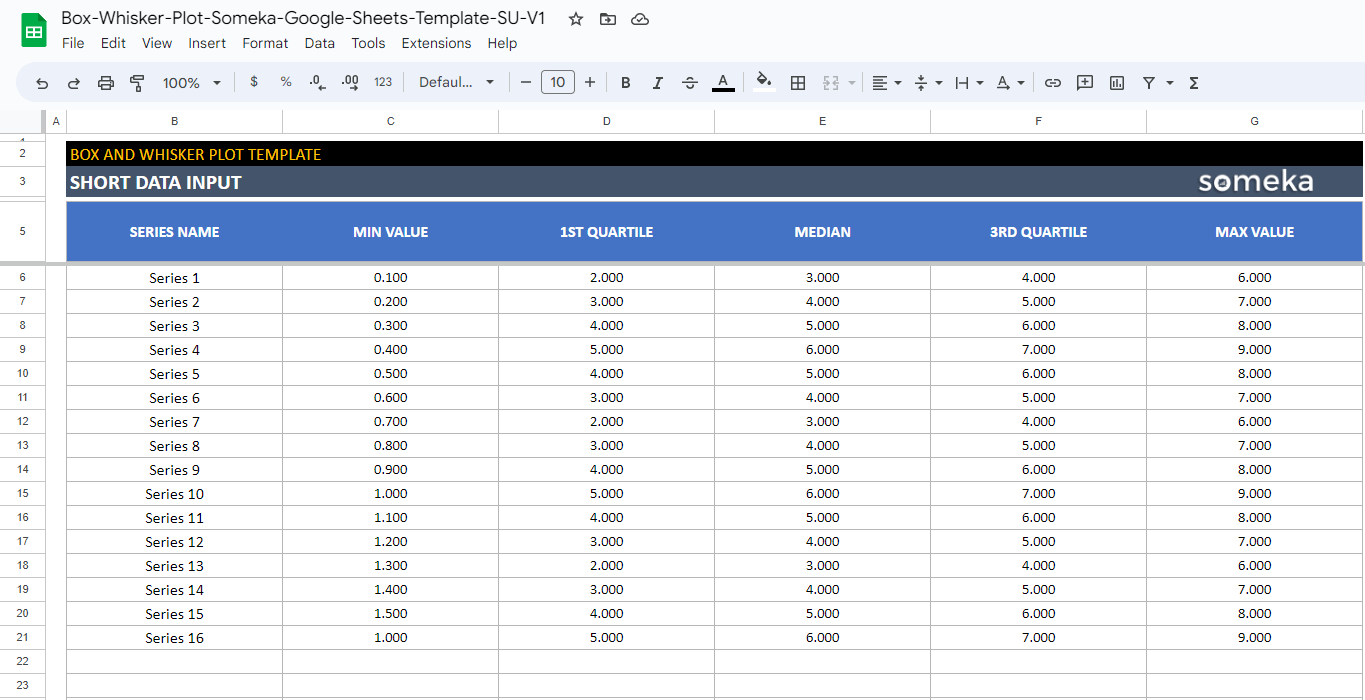
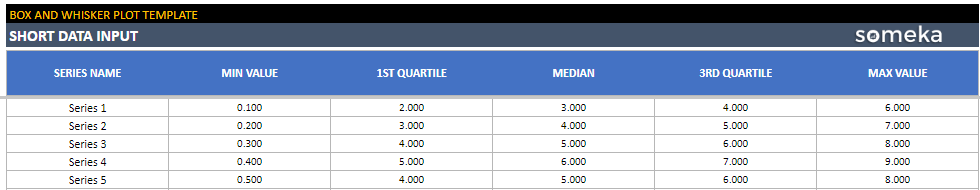
Short Data
Lastly, in the Short Data sheet, you can establish the max and min values and the quartiles of your data if you have them. Once you enter them, the Box and Whisker Plot Google Sheets Template will automatically generate the box plot.
In conclusion, this box and whiskers plot chart maker in Google Sheets will help you a lot with your data distribution and visualization needs.
Box and Whisker Plot Google Sheets Template Summary
- Double box and whiskers plot maker in Google Sheets
- Create boxplots online
- Fully printable
- Informational notes included
- Available on all devices (mobile, desktop, tablet)
- No need for installation
- Ready-to-use
USER REVIEWS & COMMENTS
3 reviews for Box and Whisker Plot Google Sheets Template
You must be logged in to post a review.
RELATED TEMPLATES
-
 This product has multiple variants. The options may be chosen on the product page
Pareto Chart Google Sheets Template
$0.00 – $59.95Frequency analysis tool in Google Sheets. Input your data and visualize it on Pareto Chart. Easy to use template with access from any device.
-
This product has multiple variants. The options may be chosen on the product page
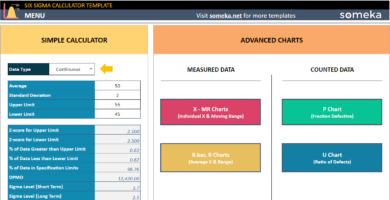
Six Sigma Calculator Google Sheets Template
$0.00 – $69.95Define your processes problems with Six Sigma Level Calculator in Google Sheets. Simple and advanced analysis with dynamic charts. Access from any device.
-
This product has multiple variants. The options may be chosen on the product page
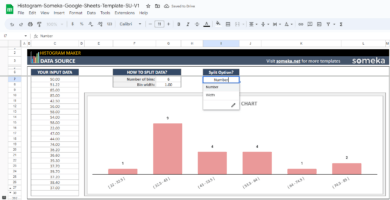
Google Sheets Histogram Maker
$0.00 – $49.95Simple histogram generator in Google Sheets. Input your data and create a histogram chart instantly. Use it in your presentations. Ready to print.
-
This product has multiple variants. The options may be chosen on the product page
Excel Box and Whisker Plot Maker
$0.00 – $49.95Automatic box and whisker template. Create box plot diagrams with one-click. Dynamic chart and quartiles with different color options. All in Excel.


Donna Tarrano –
Fine but it would be better to edit the chart style etc
Esther A –
GOOD
Khan Rustemi –
SHould we input both short data and full data to make it work??
Someka –
Hi Khan,
Thank you for your question! No, you don’t need to fill in both data sheets. If you only have the full data, you can input it in the template and it will make a plot.