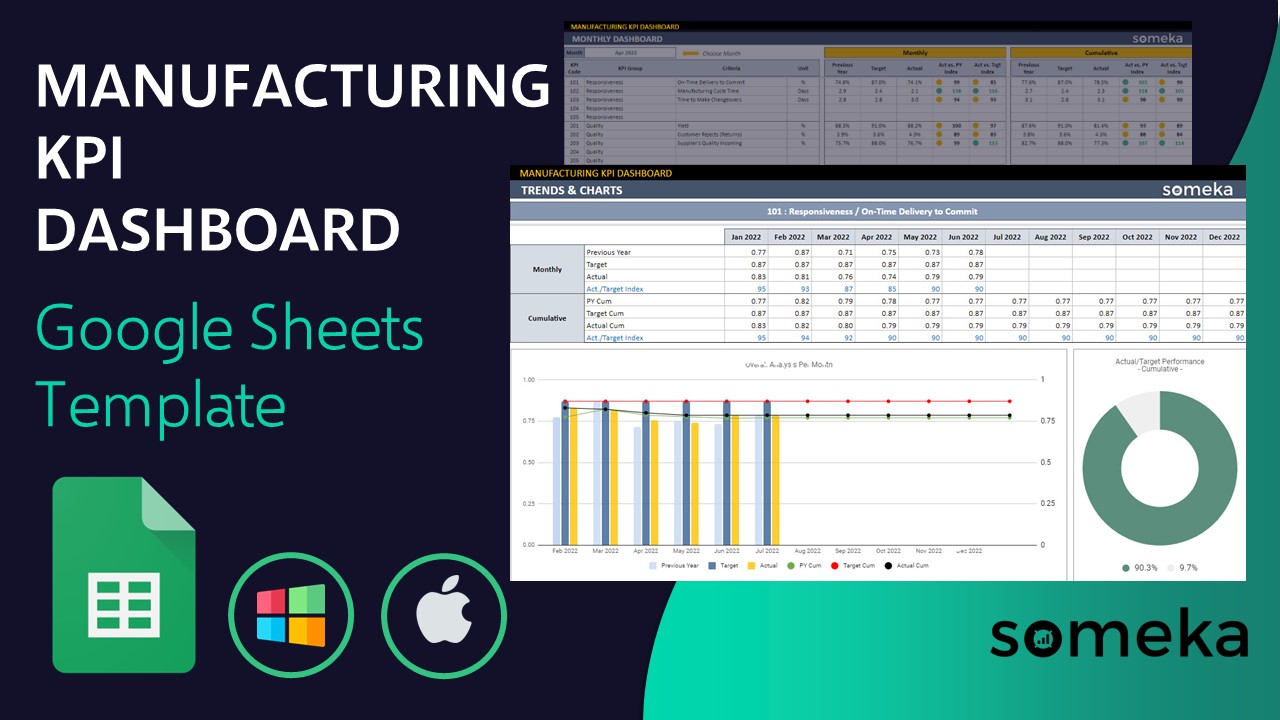
Manufacturing KPI Dashboard Google Sheets Template
Manufacturing KPI tool in Google Sheets. Track the quality and production processes. Monthly visual dashboard included. Access from all devices.


TEMPLATE DESCRIPTION
A manufacturing KPI Dashboard Google Sheets Template is a well-defined and measurable indicator used by the manufacturing industry to assess its performance over time. You may track all key metrics for manufacturing, production, oee, factory processes.
Manufacturing tasks, in particular, employ OKRs (Objectives and Key Results) and KPIs to monitor, evaluate, and optimize processes, frequently comparing their efficiency to competitors in the same industry.

What’s Manufacturing KPI Dashboard?
KPIs are useful tools for manufacturers to increase speed and quality while lowering costs. Using digital technology to focus on additional adjustments to enhance operations is a recommended practice that is sometimes referred to as industrial transformation.
Moreover, the use of corporate manufacturing information is a critical enabler of today’s digital manufacturing transformation (EMI). ERP packages with sophisticated manufacturing features automate and combine diverse manufacturing and corporate data, which may then be shown in real time via interactive dashboards. This integration of data allows for better decision and efficiency and also enables companies to quickly adapt to changes in the market.
Key Performance Metrics for Manufacturing

Here are some production KPIs in our template:
- Throughput: One of the most important KPIs for the manufacturing business, as well as one of the most essential. To clarify, the Throughput KPI checks a machine’s, line’s, or plant’s capacity for production, or how much they can produce in a given time period. Throughput = Number of Produced Units / Time (hour or day)
- Demand Forecasting: Companies use this manufacturing statistic to forecast the number of raw materials they will need to fulfill future customer demand. Customer Demand Forecast = Raw Materials * Production Rate
- Cash to Cash Cycle Time: This is a time-based manufacturing key performance indicator statistic. It quantifies the time lag between an initial financial outlay for raw materials, inventory, or a manufacturing plant and the receipt of cash from customers for the company’s product. Cash to Cash Cycle Time = Inventory Sale Date – Inventory Purchase Date
You will find more preset KPIs in your spreadsheet. Besides, you may always modify existing metrics or add new ones.
Manufacturing KPI Dashboard Google Sheets Template Sections
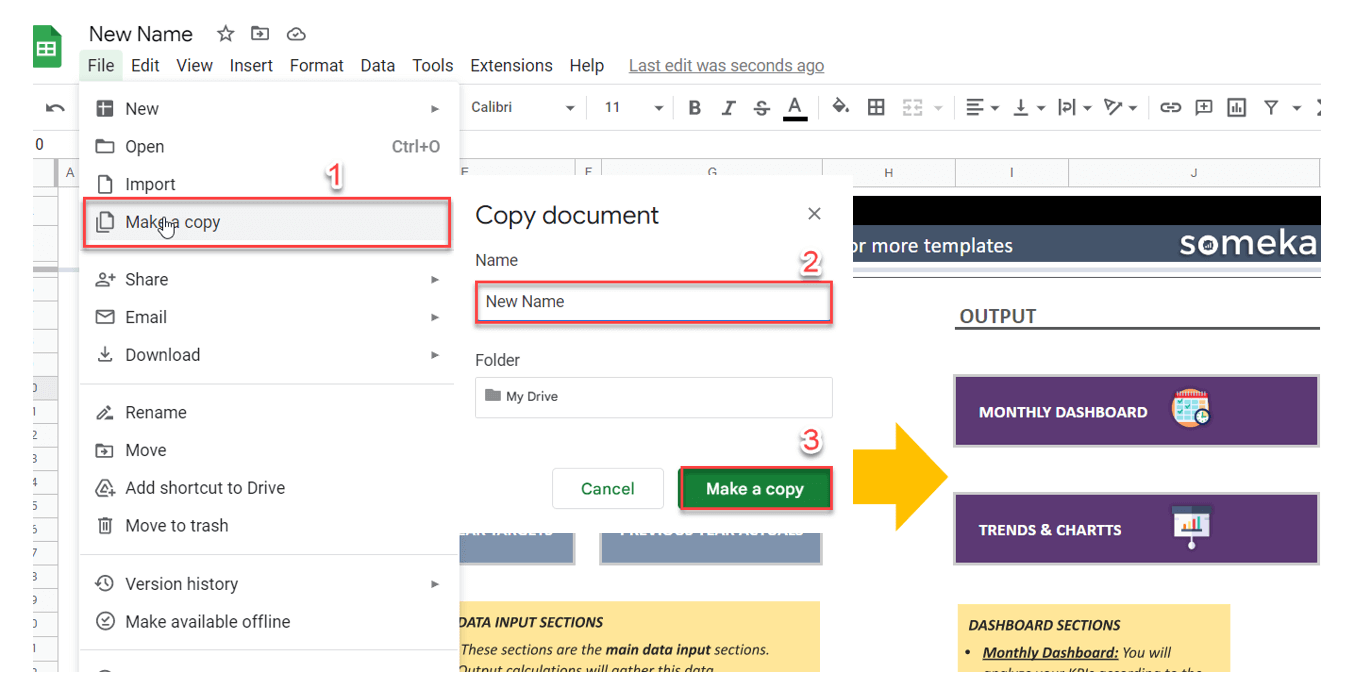
Basically, this template is split into two parts, input, and output. In the first sheet, you can see the Navigation Menu, which is useful for transferring between sheets and getting an overall view of the foundation. Let’s check the other sheets in detail:
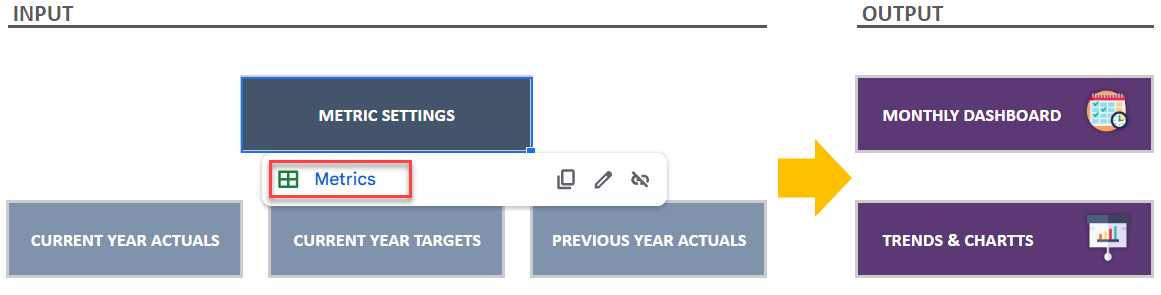
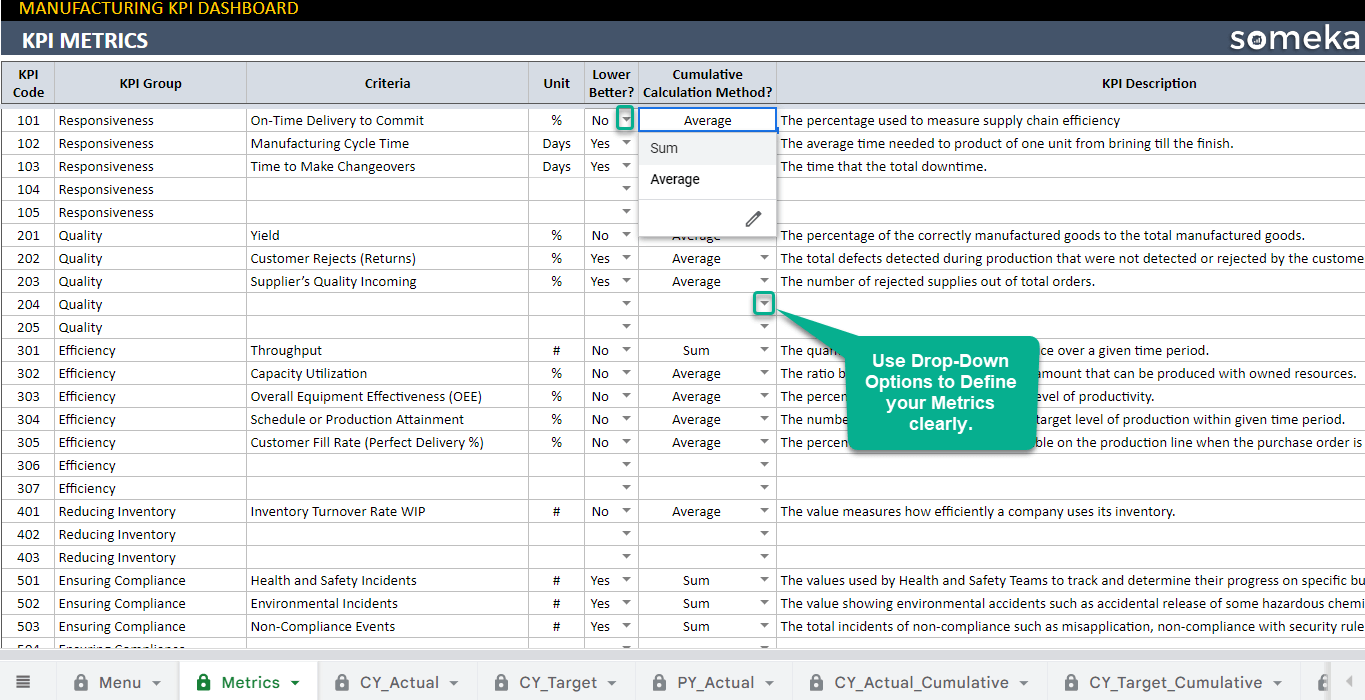
1. Defining Metrics in Manufacturing KPI Dashboard Template
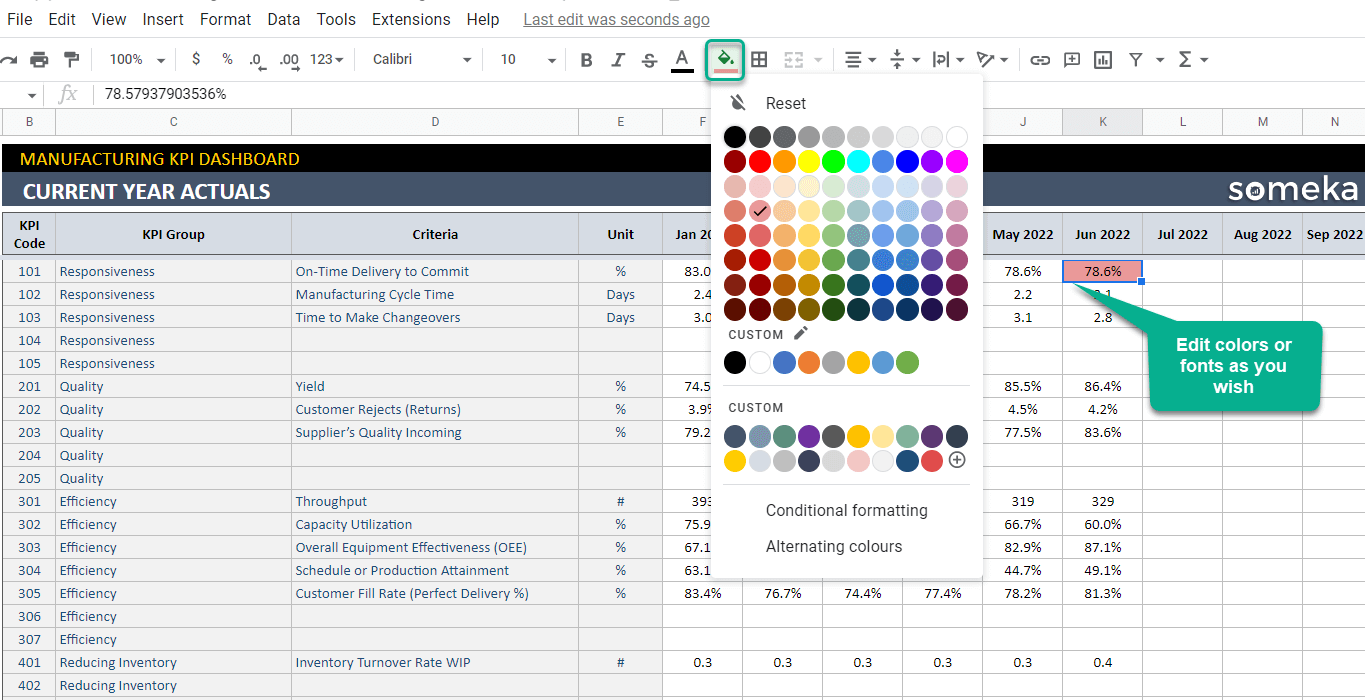
Firstly, you can add your metrics here along with their category, unit, and even a brief description of each metric. This serves as the template’s basis. As a result, to more clearly define your goals, always consult with your team, find out their opinions, and strive for extreme detail in this section.
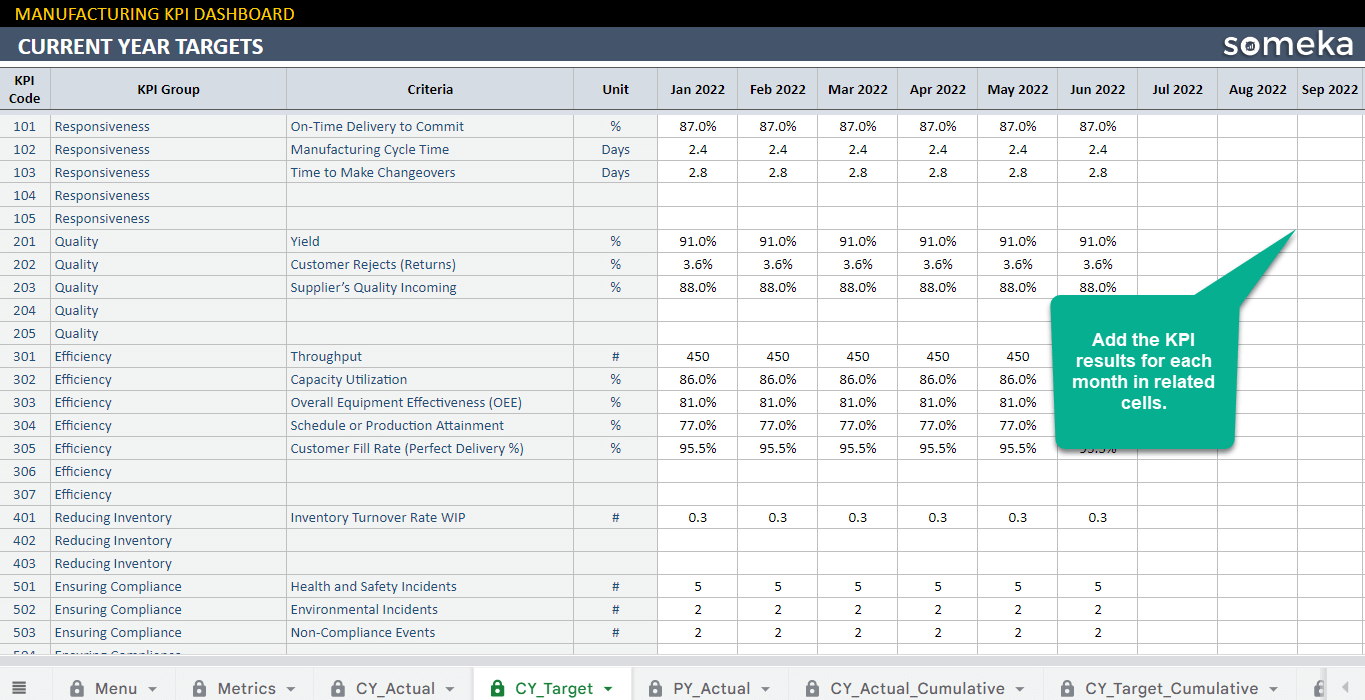
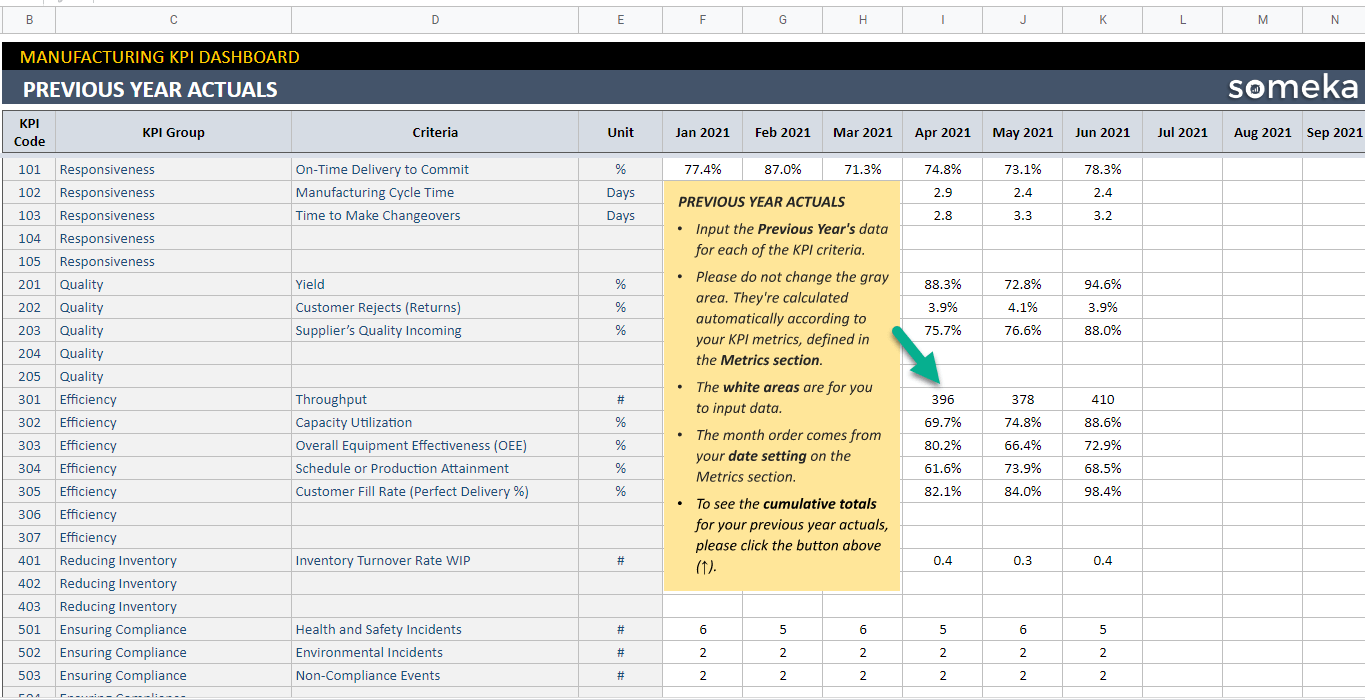
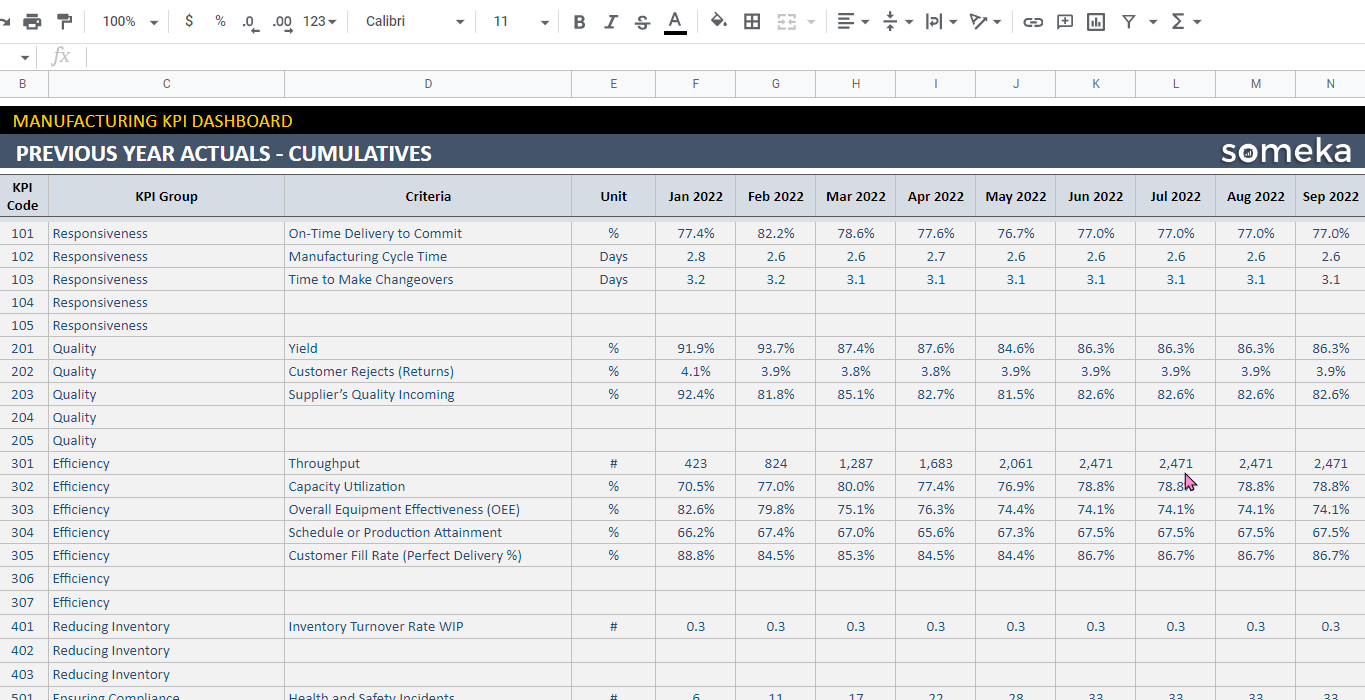
2. Actual and Target Values from the Current and Previous Years Actual:
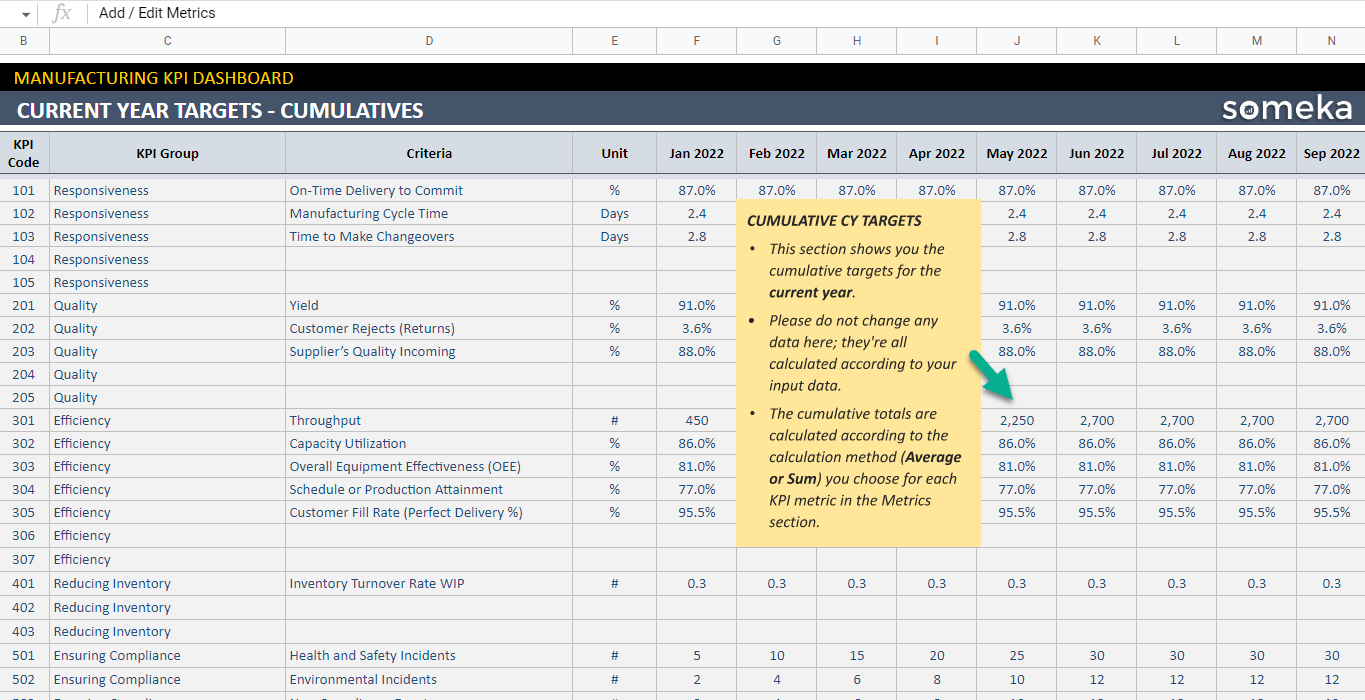
Secondly, the KPI Dashboard Google Sheets Template calculates the current year actual, current year target, and previous year actual cumulative figures after you add the results for each month to the sheet.
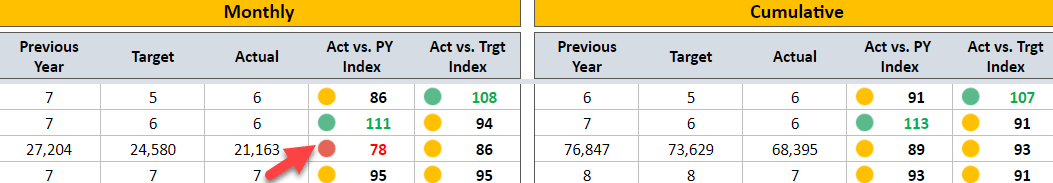
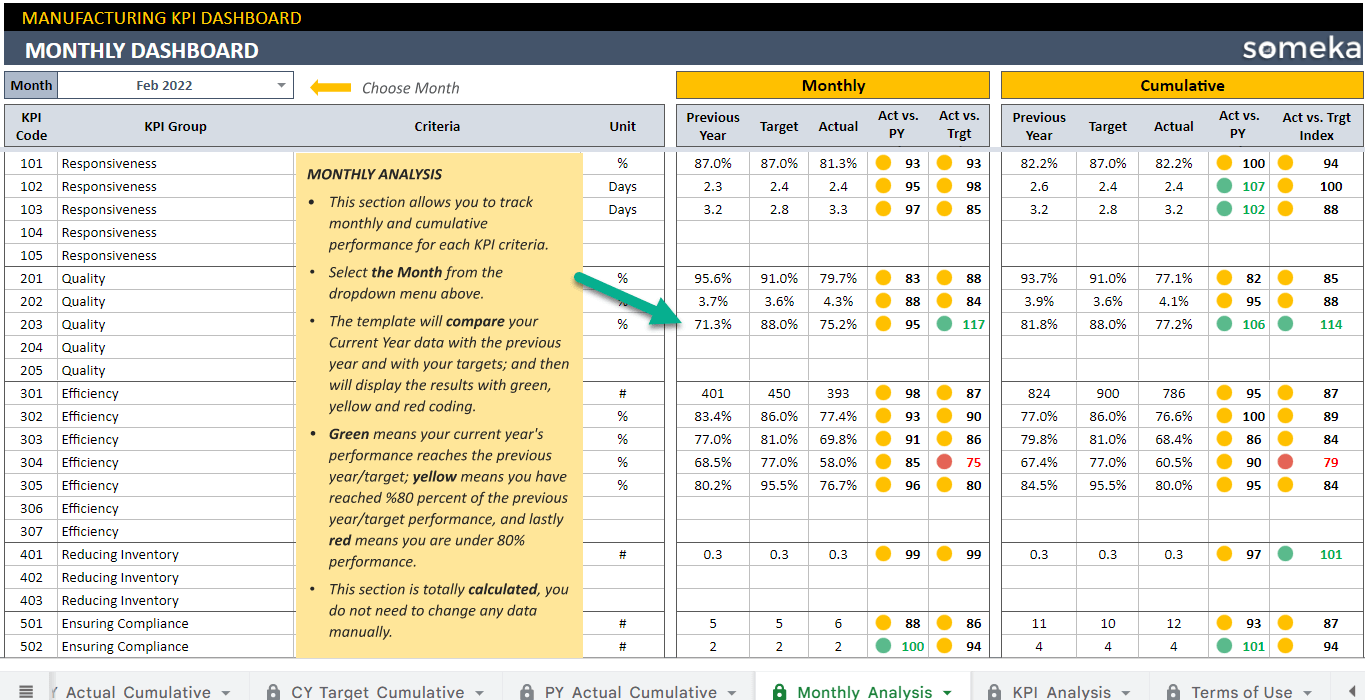
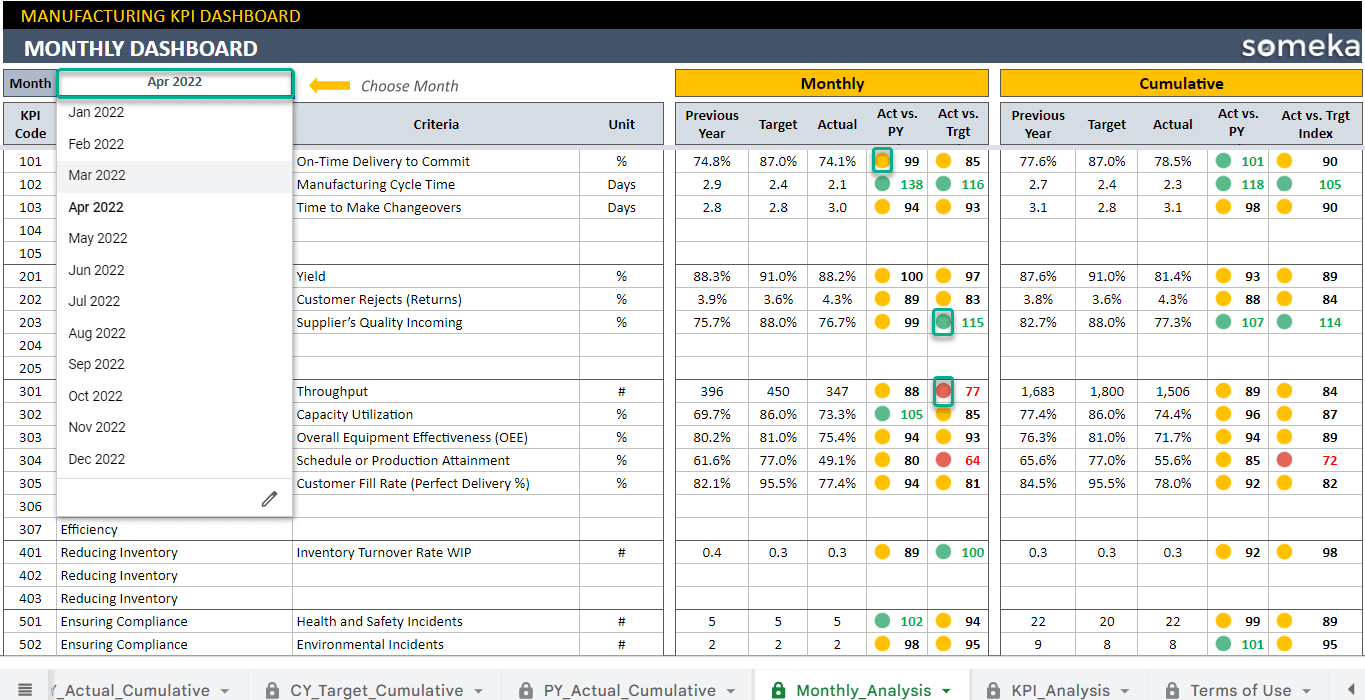
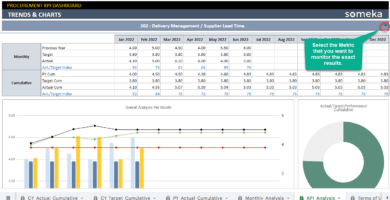
3. Monthly Analysis:
Furthermore, select Month in this section to compare monthly and cumulative results. The results of your monthly metrics are available in 3 different colors.
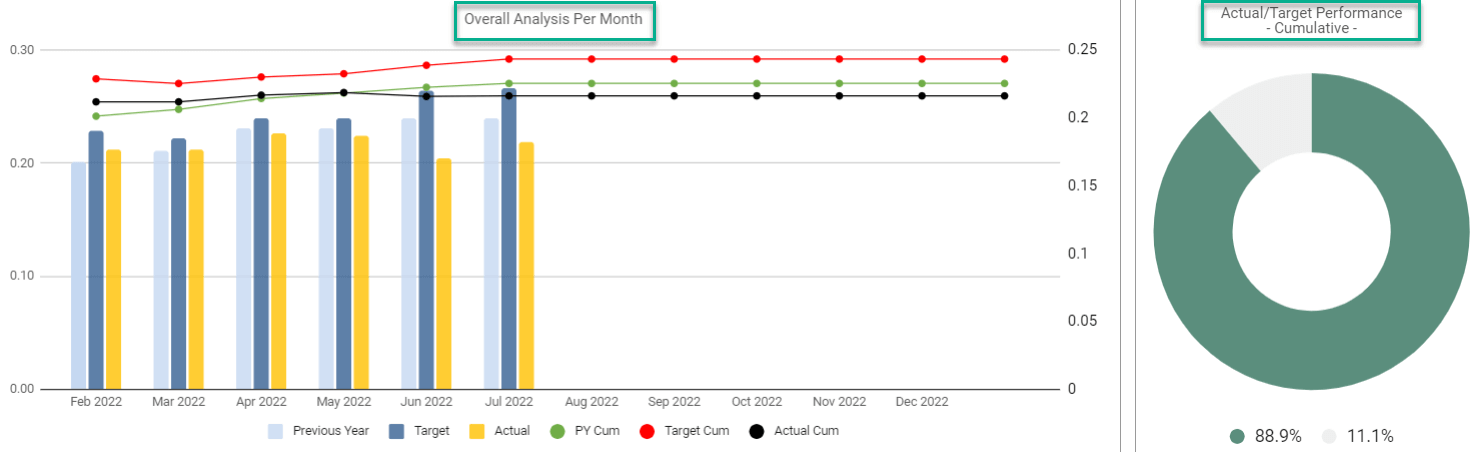
4. KPI Analysis:
Finally, here is an all-inclusive tool for managers who wish to display KPI and metrics results over time. Also, you can Simply choose your KPI to gain access to 3 different types of charts.
Meanwhile, all you need is an internet connection and a Google account to get started. And everything will be in sync!
Manufacturing KPI Dashboard Google Sheets Template Features Summary:
- Measuring success metrics of manufacturing on Google Sheets
- Monitor each metric on a monthly basis
- Ready-to-print
- Informational notes included
- Ready-to-use
- Works on any operating system
- Suitable for any device including mobile, tablet, desktop
GOOGLE SHEETS KPI DASHBOARDS COLLECTION
PRODUCT VIDEO
Watch the video below to see the template in action! Presentation also includes usage notes, explanations and tips & tricks about the template.
USER REVIEWS & COMMENTS
8 reviews for Manufacturing KPI Dashboard Google Sheets Template
You must be logged in to post a review.
RELATED TEMPLATES
-
 This product has multiple variants. The options may be chosen on the product page
Airbnb Calculator Google Sheets Template
$0.00 – $69.95Income tracker in Google Sheets for AirBnb hosts. Track your daily bookings in dynamic dashboard. Easy-to-use tool with access from all devices.
-
This product has multiple variants. The options may be chosen on the product page
Action Priority Matrix Google Sheets Template
$0.00 – $59.95Effort & Impact Matrix in Google Sheets. Easily prioritize your actions. Printable dashboard and charts. No installation. Access from all devices.
-
This product has multiple variants. The options may be chosen on the product page
Employee Evaluation Google Sheets Template
$0.00 – $69.95Performance review tool in Google Sheets. Track employee progress with individual review forms. Printable HR dashboard. Access from all devices.
-
This product has multiple variants. The options may be chosen on the product page
5S Audit Scorecard Google Sheets Template
$0.00 – $69.955S Scorecard audit tool in Google Sheets. Evaluate your workplaces with 5S checklist. Auto radar chart generator included. Access from all devices.
-
This product has multiple variants. The options may be chosen on the product page
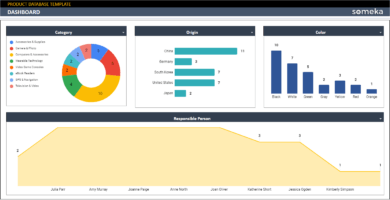
Product Database Google Sheets Template
$0.00 – $69.95All-in-one Google Sheets template for your product data. Create dynamic lists, forms and dashboards. Online tool with access from all devices.
-
This product has multiple variants. The options may be chosen on the product page
Procurement KPI Dashboard Google Sheets Template
$0.00 – $79.95Purchasing KPI Tracker in Google Sheets. Monitor key indicators for procurement department. Printable trend charts with access from any device.


Reyn J. –
Great spreadsheet templte! and detailed!
Laurence F. Lopp –
Great tool! But manufacturing accounting is another important metric that can really make difference in proper reporting. I’ve added it my own. thankfully your default settings are easy to customize.
Abigail Burns –
That was extremely educational!!!!! We must prioritize increased flexibility and creativity. It was certainly beneficiall!!
Juan Voltana –
This and all KPI templates guided me in identifying which metrics are essential. I wantd to define performance metrics, and this marvelous spreadsheet came in handy when I didnt have much time. Thx!!
Jeff A –
Easy to determine. Very resourcefull!
Elio –
Hello Someka
I found you by chance through another link, and it looks you helped me in solving a long-standing problem with our company’s KPIs. I believe my data structure was wrong, and after seeing one of your videos, everything makes sense now. I’ll need two things.
– Confirm or provide a correct data entry structure.
– A mockup of a KPI dashboard you constructed before creating the most recent version of the template.
Possible?
Someka –
Hello Elio
We’re delighted you found our template!
You will be able to view the general structure of the template we used to calculate the monthly or cumulative analysis once you download it. Aside from that, we’ve prepared an info sheet that explains all of the KPI metrics we use to create templates.
Our development team performed a significant study before collecting those KPIs. As a result, we recommend that you collect data before building a template for your company’s key metrics. If you request assistance during this process, please see this page:Hire Excel Expert
I hope that helps!
Albert Ravalo –
We add our data to the CY sheets, and the dashboard shows the results. Ok, it is nice. But I need some calculation of my raw data with a formula, and then I must add it to the template. How?!
Someka –
Hello Alberto,
A file that can be modified should be provided together with a password that has been purchased. Unprotect your sheets and display headings to create rows and columns.
Celina Bellatti –
I adore this. The ability to modify “lower better?” is advantageous!