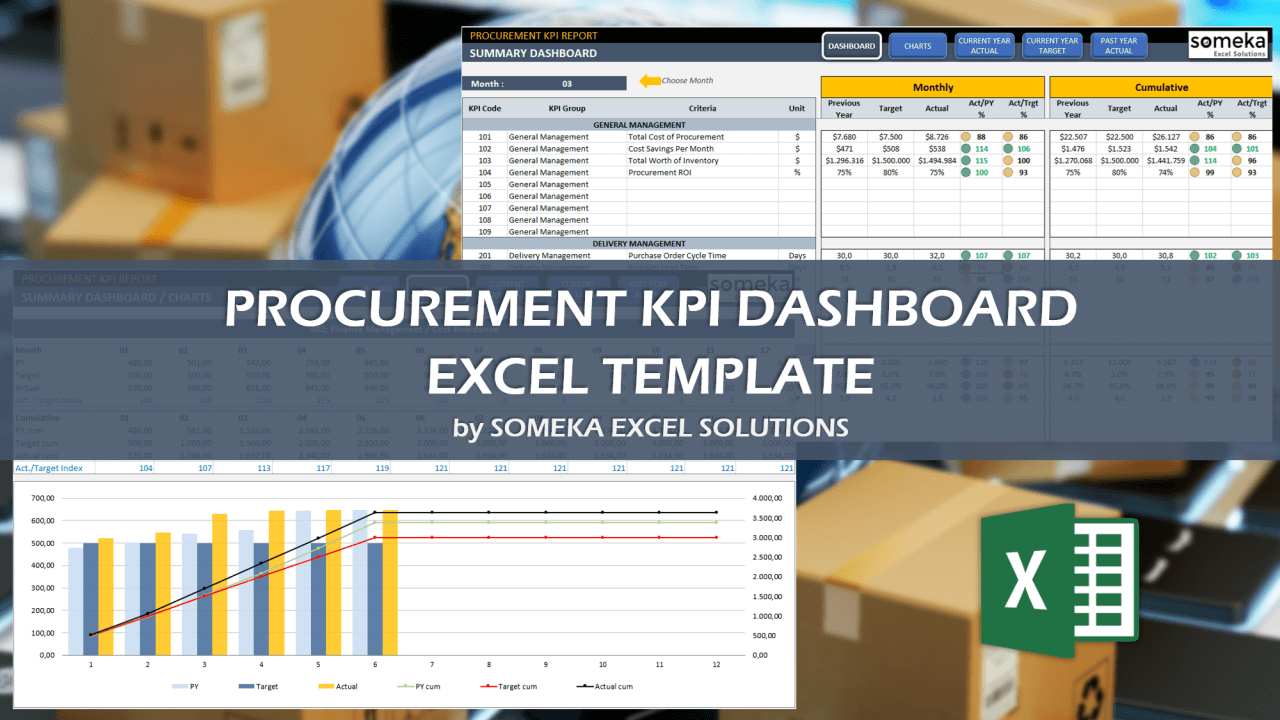
Procurement KPI Dashboard Excel Template
Excel spreadsheet for procurement metrics. Track your purchasing KPIs with monthly and cumulative analysis. Printable dashboard with on sheet guide.
TEMPLATE DESCRIPTION
The procurement team of the organizations consists of specialists who contribute a wide variety of services to all plan participants committed. So they are interested in the activities relating to the procuring of stocks and supplies required for a project or plan implementation. Therefore, this Procurement KPI Dashboard Excel Template helps keeps track of all your procuring activities with relevant and measurable metrics.
Furthermore, it provides benchmarks in which you can analyze your supplier and warehouse services whether are high quality or consistent.
There are numerous KPI metrics for purchasing departments, but, we’re going to look into the most used 20 KPIs in different categories of business metrics under five main groups:

Then, let’s see the details of the Procurement KPI Dashboard Excel Template.
Procurement KPI Dashboard Excel Template Features:
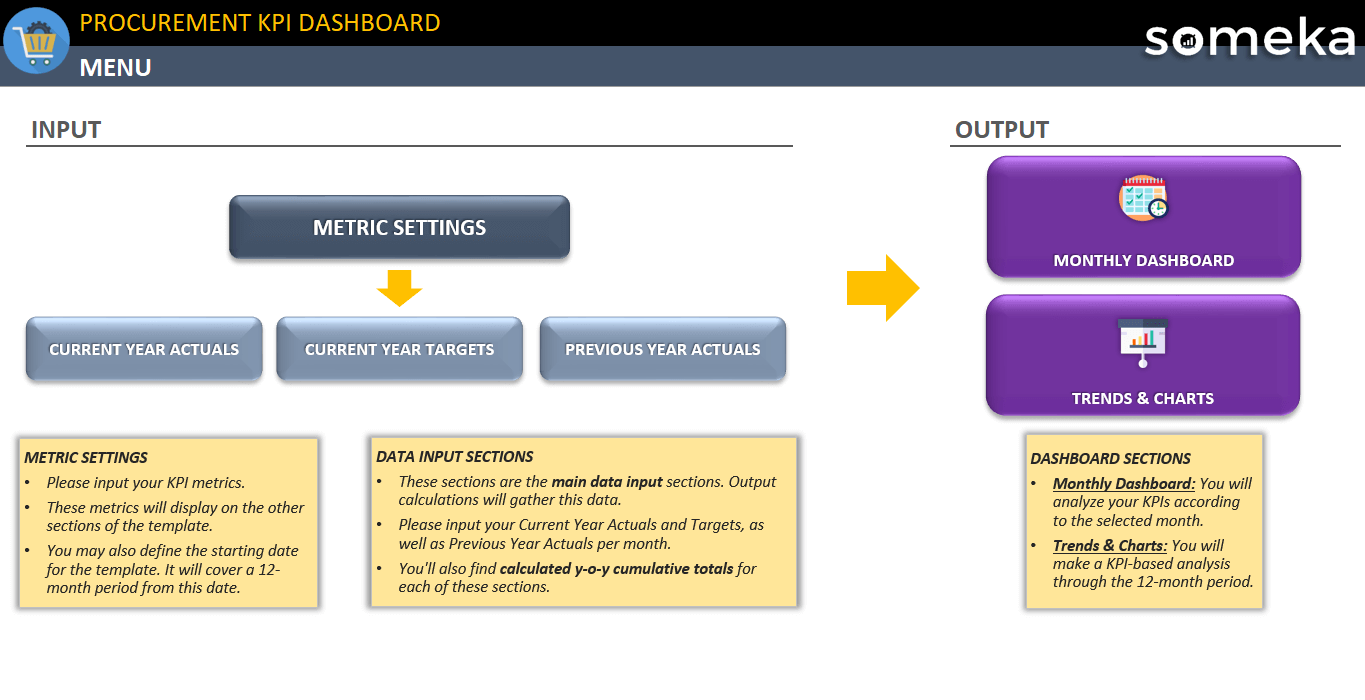
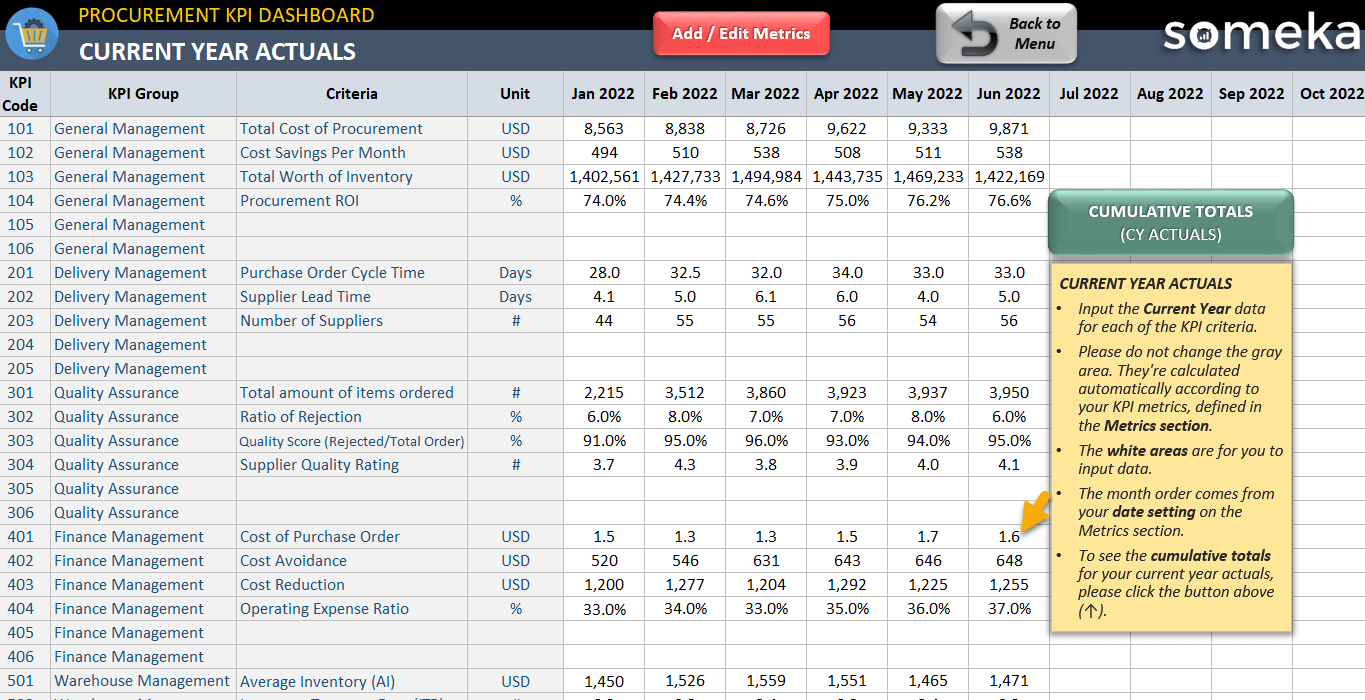
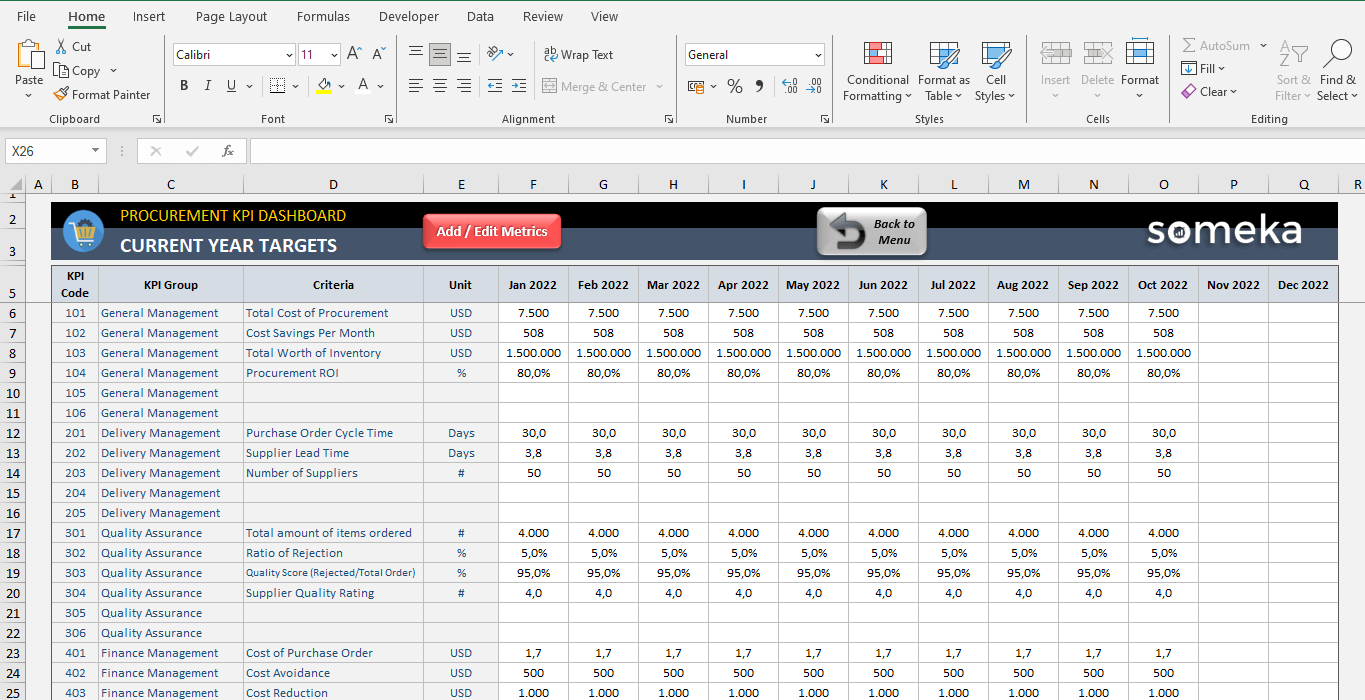
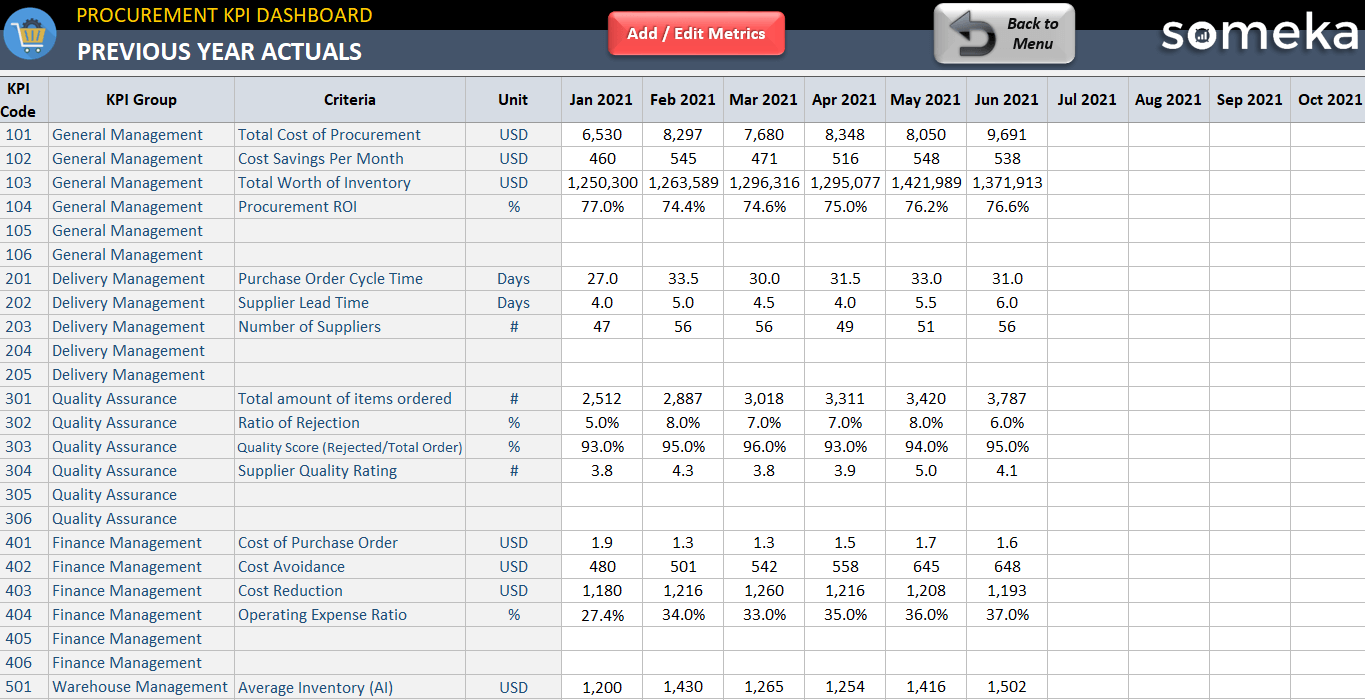
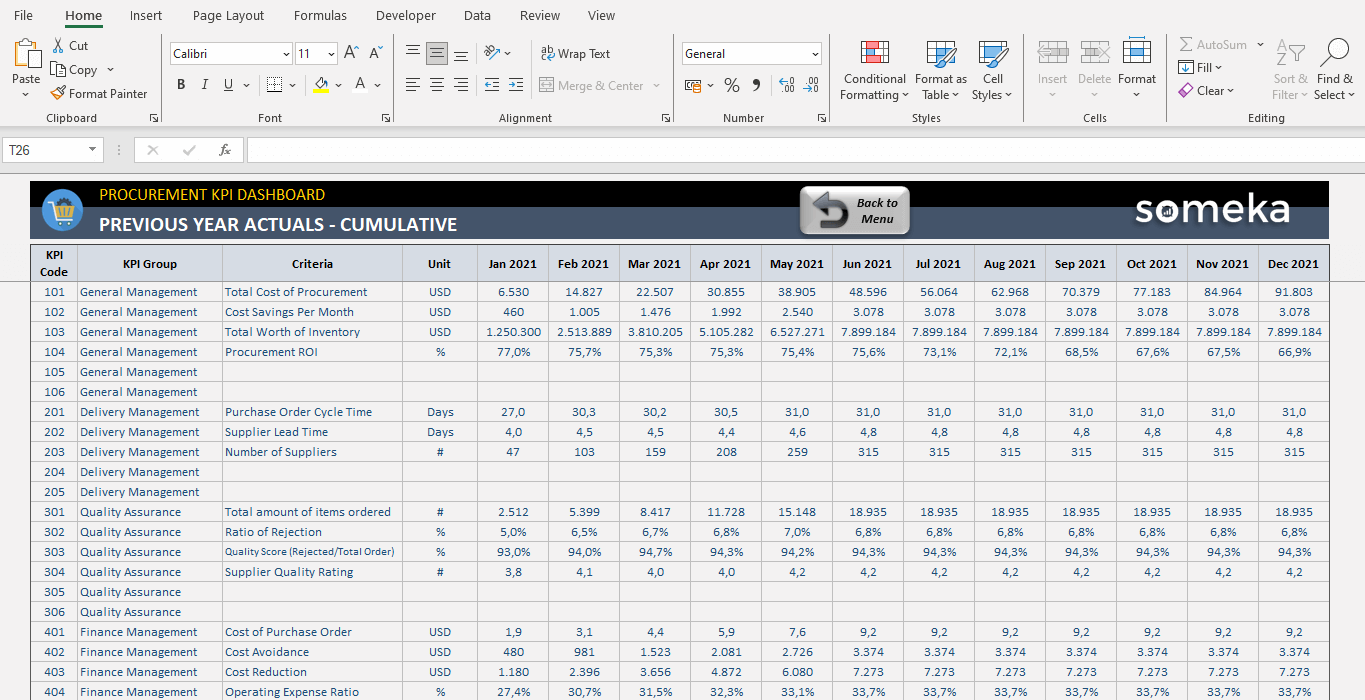
Firstly, you can use these navigation buttons in order to switch between other sections. In general, the Current Year Actual, Current Year Target, and Past Year Actual are the sections where you will input your own values here.
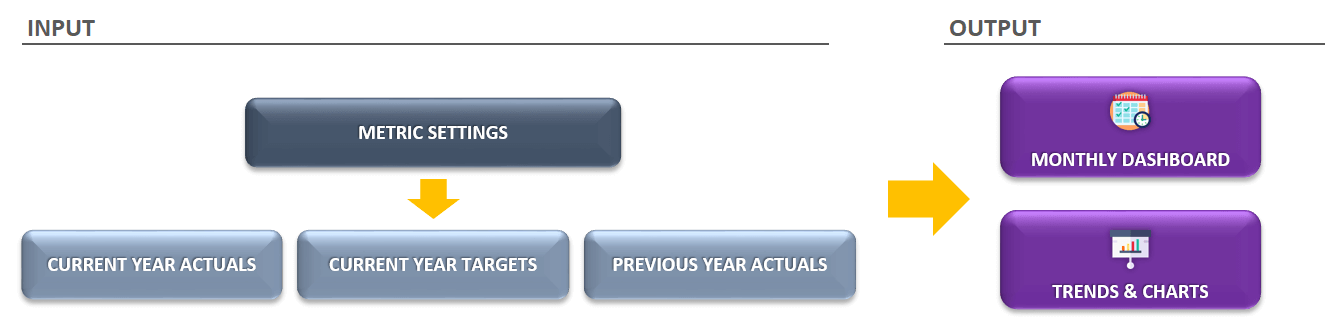
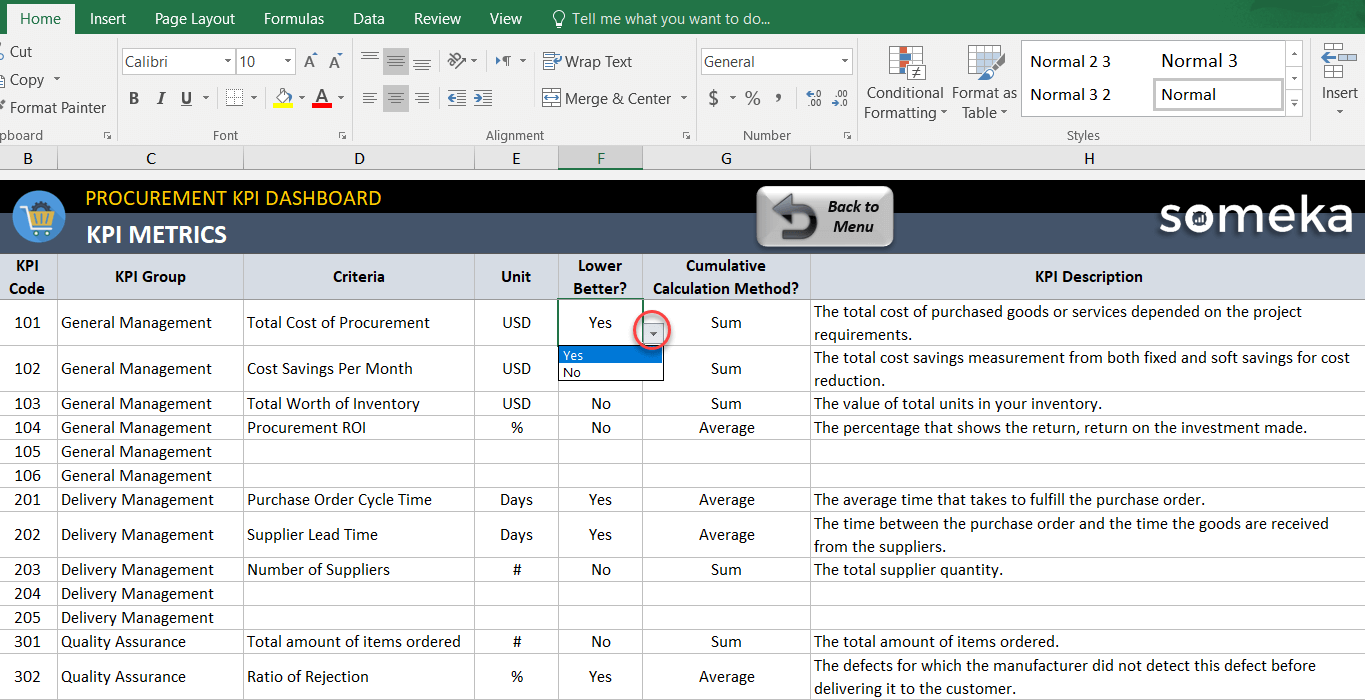
We have used some samples however you can also add new rows or put your data to existing blank areas with a new Procurement KPI code.
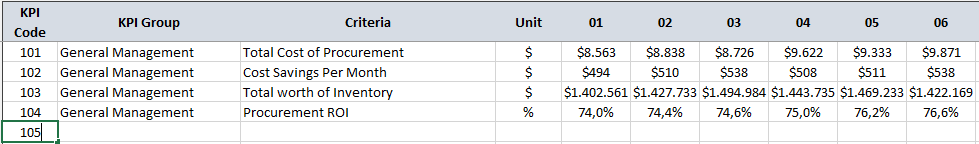
Warning!: Do not forget that when you add/remove a KPI code, you should change it in other sections as well. For example, if you add a new Procurement KPI to CY Actual section, you should change it in CY Target, PY Actual, and Cumulative.
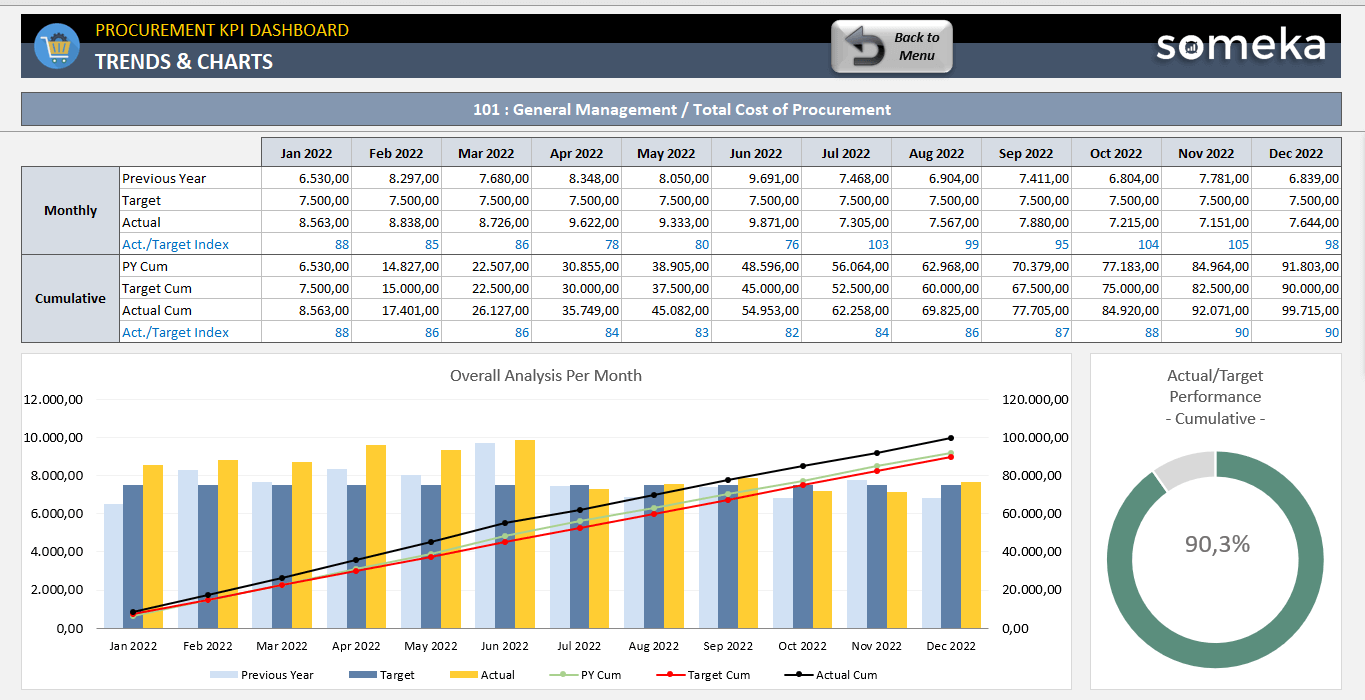
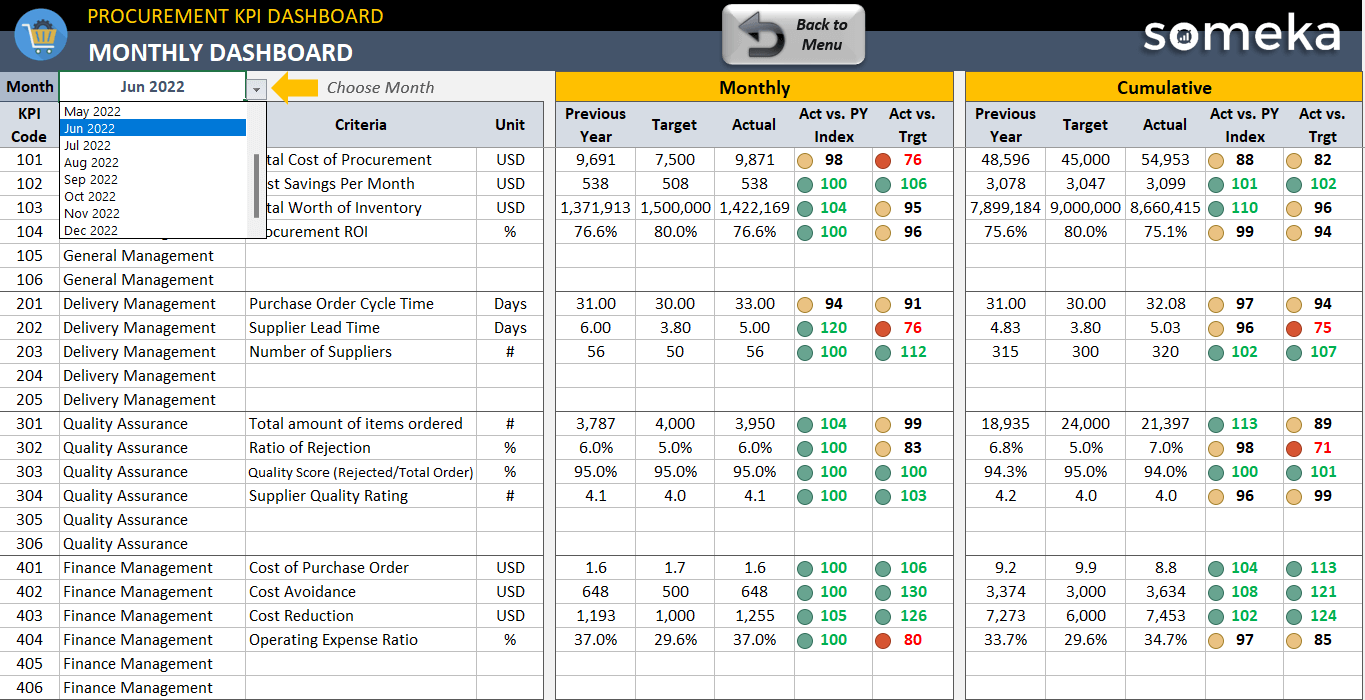
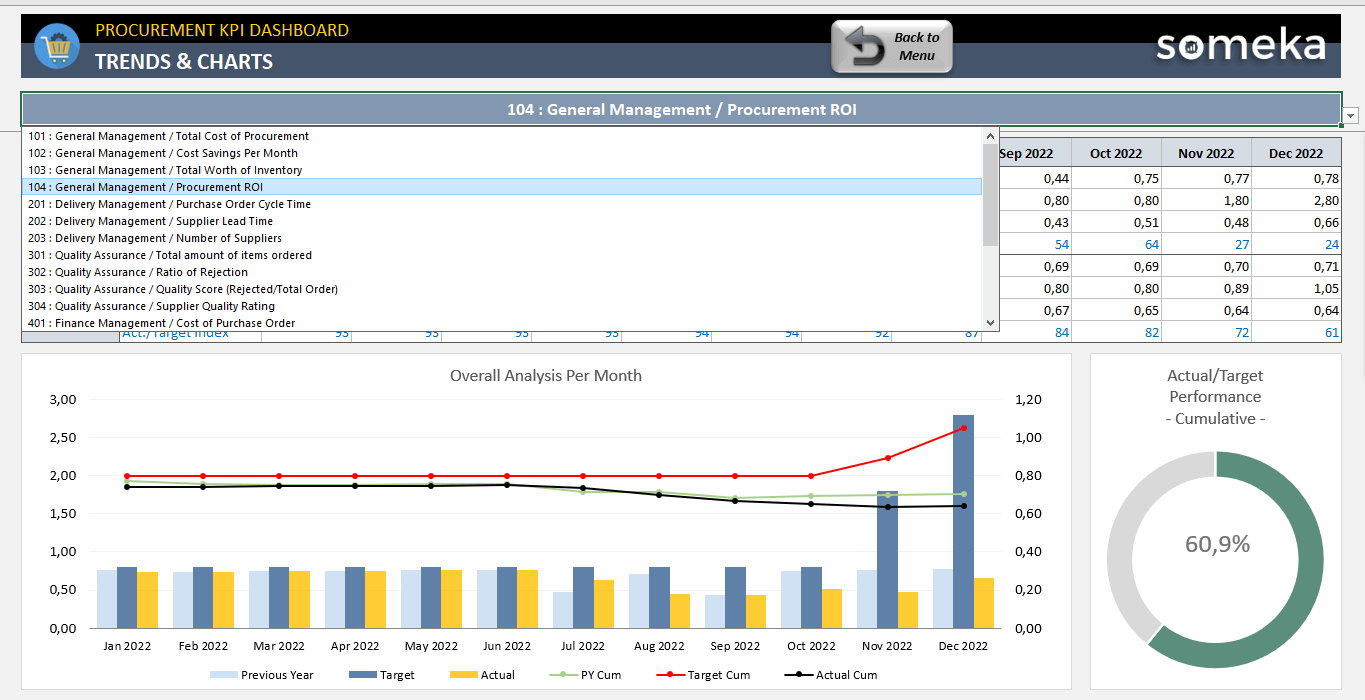
Furthermore, the template will allow you to see trends forming with the available charts, giving you a clear visual of your Procurement activity according to selected KPI.
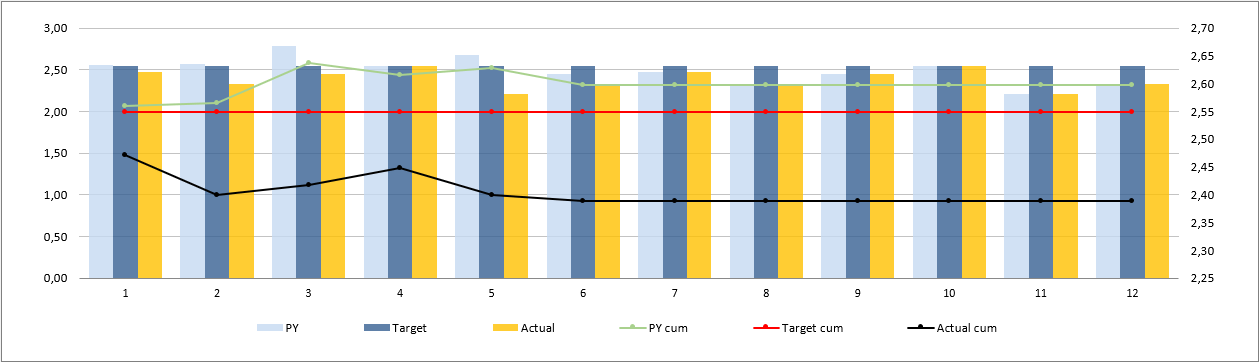
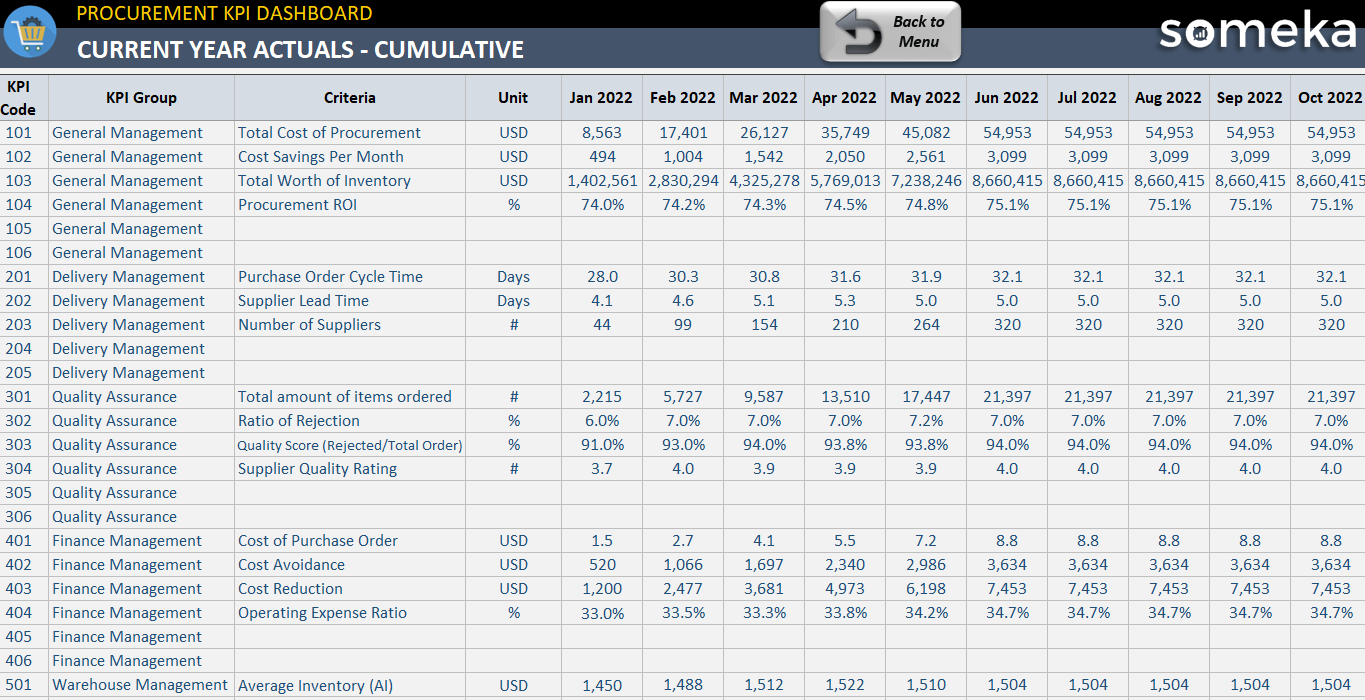
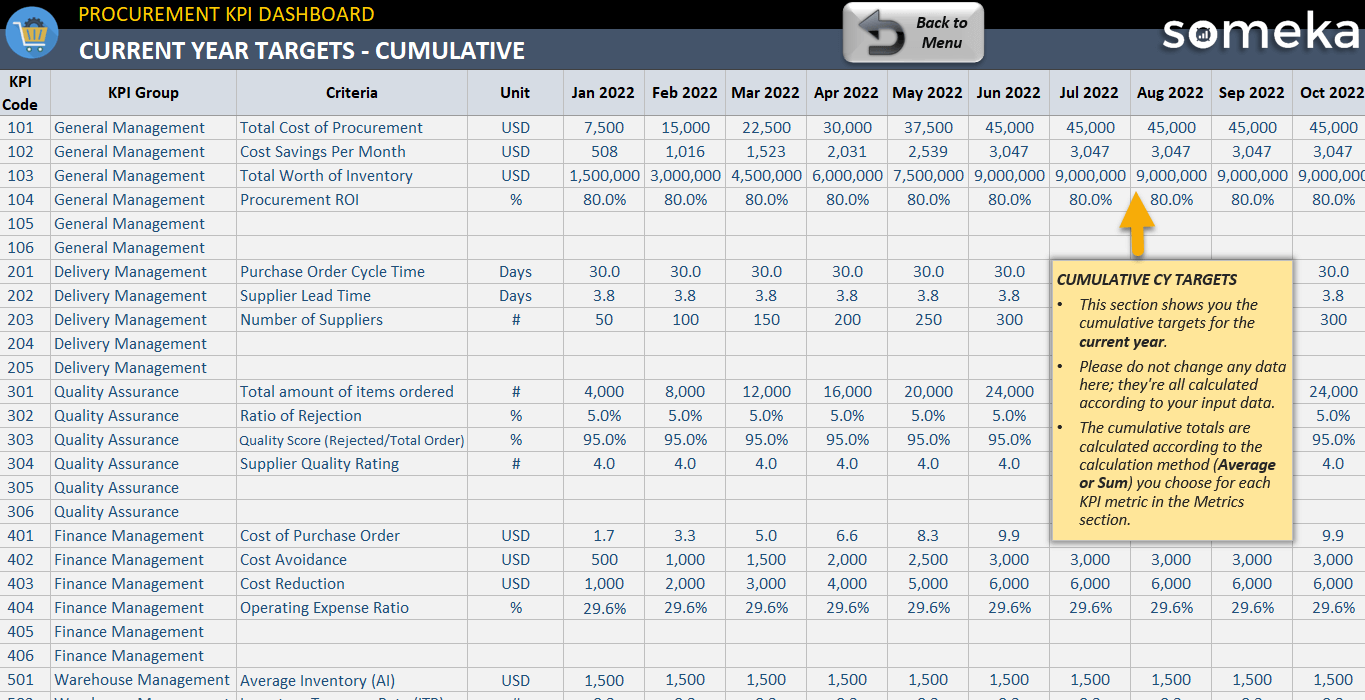
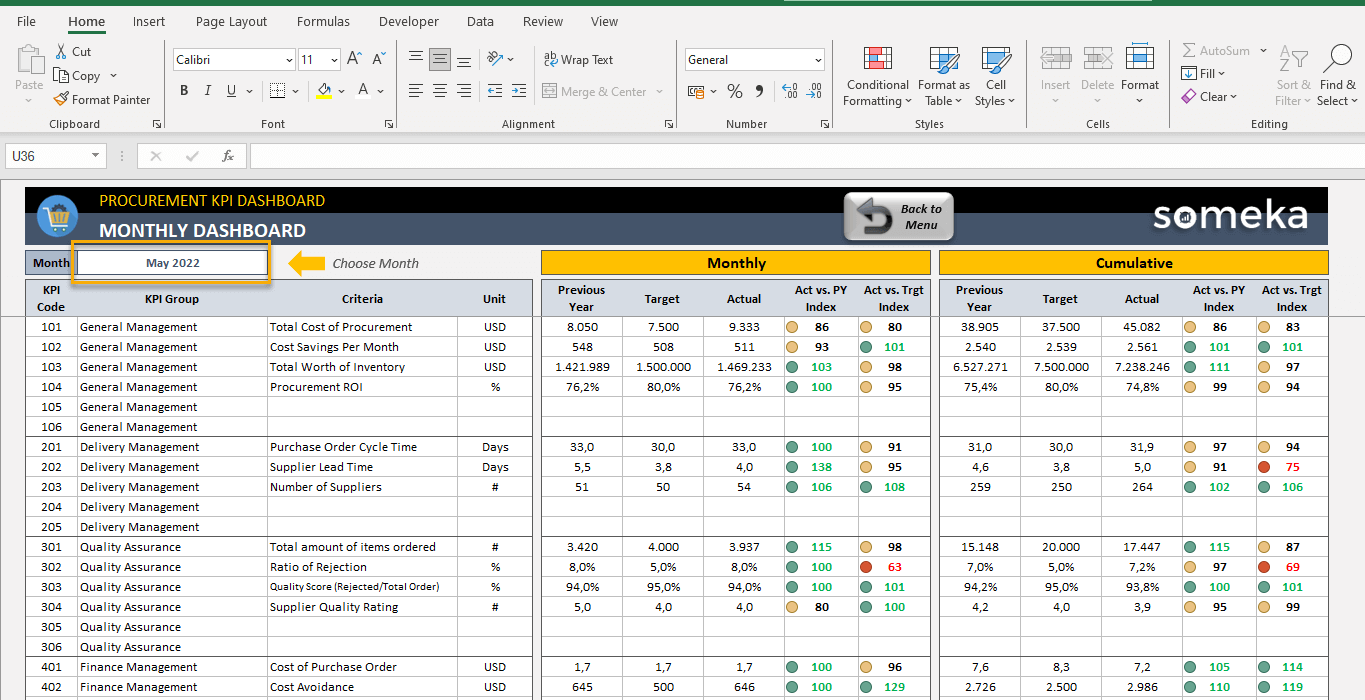
Finally, the Dashboard shows monthly and cumulative results to provide a clear view. In this way, you will see past year and company targets comparison.
Detailed Description of Procurement KPI Dashboard metrics:
 General Management
 General Management
Total Cost of Procurement: This metric includes costs like shipping and processing and payment of the vendor’s invoice.
Cost Savings: Also referred to as “Hard Savings” is planning and managing the work costs less than what was budgeted.
Total worth of Inventory: The value of Inventories as a financial asset. You should calculate the financial values of inventories according to the market price.
Procurement ROI: ROI which means Return On Investment is one of the most used profitability ratios. It analyzes the efficiency of money invested.
If you need other metrics in this group, feel free to add more KPIs on your Dashboard for this Excel template.
Delivery Management
 Delivery Management
Purchase Order Cycle Time: The time the purchasing department takes to fulfill the needs of the organization.
Supplier Lead Time: The amount of time between the purchase order and the customer’s receiving.
Number of Suppliers: How many suppliers do you need to have? It’s important to track your optimized supplier number and remain to stay with your critical borders.
Quality Assurance
 Quality Assurance
Total amount of Items Ordered: The total amount of items ordered. You should calculate by eliminating rejected and stock-out items.
Ratio of Rejection: The ratio of rejection referred to a faulty component or incorrect product which does not fulfill your requirements. This metric is important for KPI to track your supplier’s quality standards.
Quality Score: This ratio is important to decide whether your rejected order is accepted or not. To make this more quantifiable divide your total orders by the number of defective orders.
Supplier Quality Rating: This metric will be able to give a clear opinion about your satisfaction with your supplier’s quality.
To emphasize, you may add more quality assurance KPI metrics in this Excel template.
Finance Management
 Finance Management
Cost of Purchase Order (CPO): Most purchasing organizations analyze their effectiveness by tracking the cost per PO. To calculate this metric divide your organization’s total cost by per order.
Cost Avoidance: Also referred to as “soft savings,” it is any action including taxes, insurance critic stocks that avoid incurring costs in the future.
Cost Reduction: Cost Reduction means cutting back on unnecessary costs in your own organization or supplier’s process.
Operating Expense Ratio: It’s important to understand your operational effectiveness by tracking the operating expense ratio. Because if you have a high ratio it could refer that you need to improve your operation process.
Warehouse Management
 Warehouse Management
Average Inventory (AI): This critical purchasing metric shows your warehouse’s effectiveness as an average of beginning and ending inventory. It’s calculated by the summation of the current inventory and previous inventory, then divided by two.
Inventory Turnover Rate (ITR): Inventory turnover is a ratio showing how many times your function (department) has used and replaced inventory per month. It is calculated by dividing the total amount of the products which got out of the warehouse by the average inventory.
Holding Cost: Holding costs are the costs to store inventory. To calculate this metric correctly, you should include and sum up costs such as your warehouse rent, security and insurance personnel costs, depreciation of handle inventory, etc.
Stock-Out: In this situation, the required item cannot be accomplished because of ineffective inventory management.
Service Level Agreements (SLA): It’s an agreement between clients and providers with a contract. It may include technical definitions about meantime failures, repair, recovery, responsibilities, etc. In order to calculate your warehouse’s SLA divide warehouse work hours by available work hours.
This template will be a reference for your OKR (Objectives and Key Results) tracking for your procurement department and business.
Procurement KPI Dashboard Excel Template Features Summary:
- Both Monthly and Cumulative analysis
- Comparison with Past Year and Target values
- Summary dashboard with charts
- Easy to use and nice design
- Clear on-sheet instructions
- Compatible with Excel 2010 and later versions
- Works both on Windows and Mac
- No installation needed. Ready to use
- Full Print ready
- White Label
- Does not include any VBA macros
EXCEL KPI DASHBOARDS COLLECTION
PRODUCT VIDEO
Watch the video below to see the template in action! Presentation also includes usage notes, explanations and tips & tricks about the template.
USER REVIEWS & COMMENTS
11 reviews for Procurement KPI Dashboard Excel Template
You must be logged in to post a review.
RELATED TEMPLATES
-
 This product has multiple variants. The options may be chosen on the product page
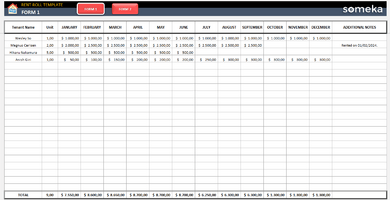
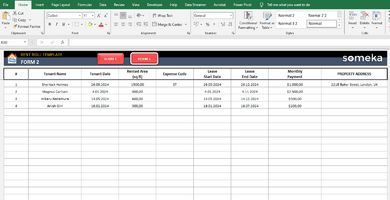
Rent Roll Template in Excel
$0.00 – $49.95Downloadable Rent Roll Template in Excel. Property management tool for landlords and real estate agencies. Printable and editable. Easy-to-use forms.
-
This product has multiple variants. The options may be chosen on the product page
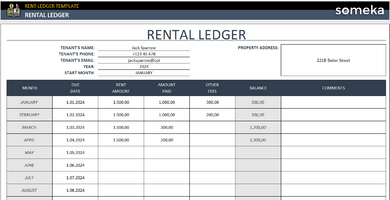
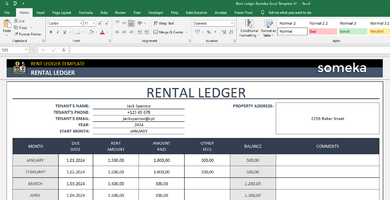
Rent Ledger Template in Excel
$0.00 – $49.95Excel template to create Rental Ledger Forms. Track your rental transaction history. Printable and fillable ledgers for landlords and property managers.
-
This product has multiple variants. The options may be chosen on the product page
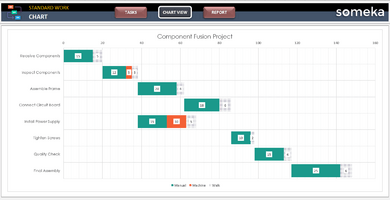
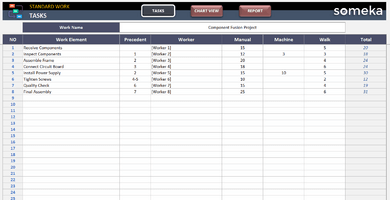
Standard Work Excel Template
$0.00 – $59.95Free download Standard Work Template in Excel. Sleek design tool for lean manufacturing. Ready-to-present charts and diagrams. Printable report included.
-
This product has multiple variants. The options may be chosen on the product page
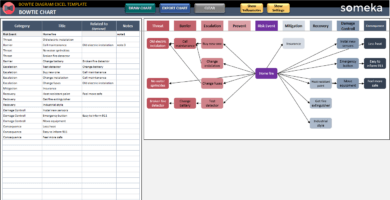
Bowtie Diagram Excel Template
$0.00 – $69.95Bowtie analysis tool in Excel. Visualize your risk pathways in a clean cause & consequence diagram. Fully printable with various color options.
-
This product has multiple variants. The options may be chosen on the product page
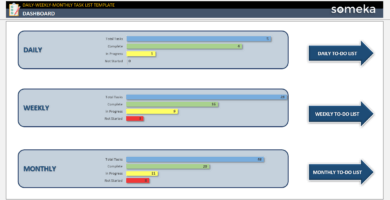
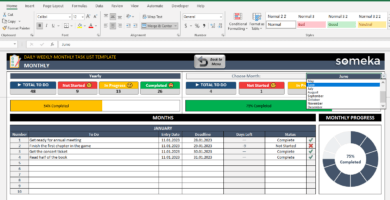
Daily-Weekly-Monthly Task List Excel Template
$0.00 – $69.95Excel Task List Template on a daily, weekly, monthly basis. Save your headspace and keep track of your to-dos easily. Works in Mac & Windows.
-
This product has multiple variants. The options may be chosen on the product page
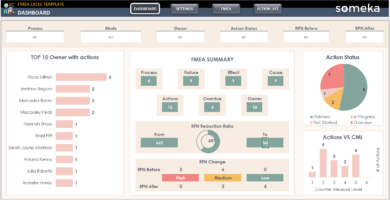
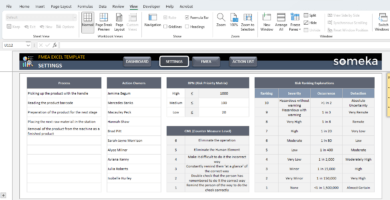
FMEA Excel Template
$0.00 – $69.95Risk analysis tool in Excel. Detect failure modes and plan preventive actions with FMEA model. Dynamic dashboard included. All print-ready.

Timoty. F –
The template is easy to use and has a nice design. I particularly like the charts that provide a clear visual of my procurement activity. Great job!
Nico –
I’ve been using this Procurement KPI Dashboard Excel Template for a while and it has had a great effect on my procurement department. It gives me benchmarks to help me review my supplier and warehouse services. I would certainly say that it was money well spent!
Vicky Klemm –
The template has nuamerous KPI metrics for purchasing departments, and the clear on-ssheet instructions make it easy to use.
Sanika –
I am disappointed in the Procurement KPI Dashboard Excel Template as the charts were not as detailed as I anticipated, and entering my own values was a challenge. It was an unfortunate use of money on this template.
Someka –
We apologize that you’re unhappy with this template. You’re eligible to ask for a refund if it isn’t up to your expectations. To do this, please share your file with us so we can figure out what the issue is. You can contact us at contact@someka.net. Thank you.
Dr. Rajeshkar –
How can I reach you if I have other questions or need support? Do you have a phone number or email address I can use?
Someka –
Reach out to us on our website’s live chat, or drop us an email at contact@someka.net. Our team is available and ready to assist you.
Lilly –
great template great job team i loved it very helpful
Gavin S –
I love this excel. I just wonder if there is a one-time charge for one of the downloads and not multiple charges??
Someka –
Hello Gavin,
All our prices are processed as one-time payment. You receive the template after you make the purchase.
There is no subscription or recurring payments. For more information please click here.
Ry Dalí –
I like KPI’s info sheet, it’s very explanatory. Thanks.
Julio C. –
– Customer support sometimes is slow.
– The graphics produced are clean and effective.
– It can be set up more detailed report (such as: weekly results)
mindy davidson –
Guys you are the best… I ve bought 5 KPI dashboards and i am plannong to buy a few more by the end of month…GREAT JOB
Yvonne Yadav –
I was initially overwhelmed by all of the options offered in the template. But the more I played around, the more I loved it. (Their video was very helpful.)