Excel Box and Whisker Plot Maker
Automatic box and whisker template. Create box plot diagrams with one-click. Dynamic chart and quartiles with different color options. All in Excel.
TEMPLATE DESCRIPTION
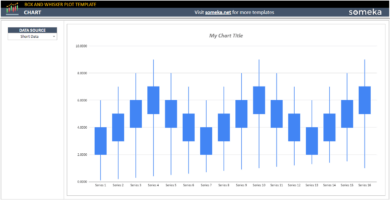
The Excel Box and Whisker Plot Maker is used for showing the data sets. In addition, you can see the median, 1st and 3rd quartile, min, and max values inside your data.
That’s to say, you can use this type of chart for analyzing the data set and this chart works for finding if there are any unlogical data or calculations inside the inputs.
Box and Whisker Plots in Excel are also used a lot for statistical research and experiments.

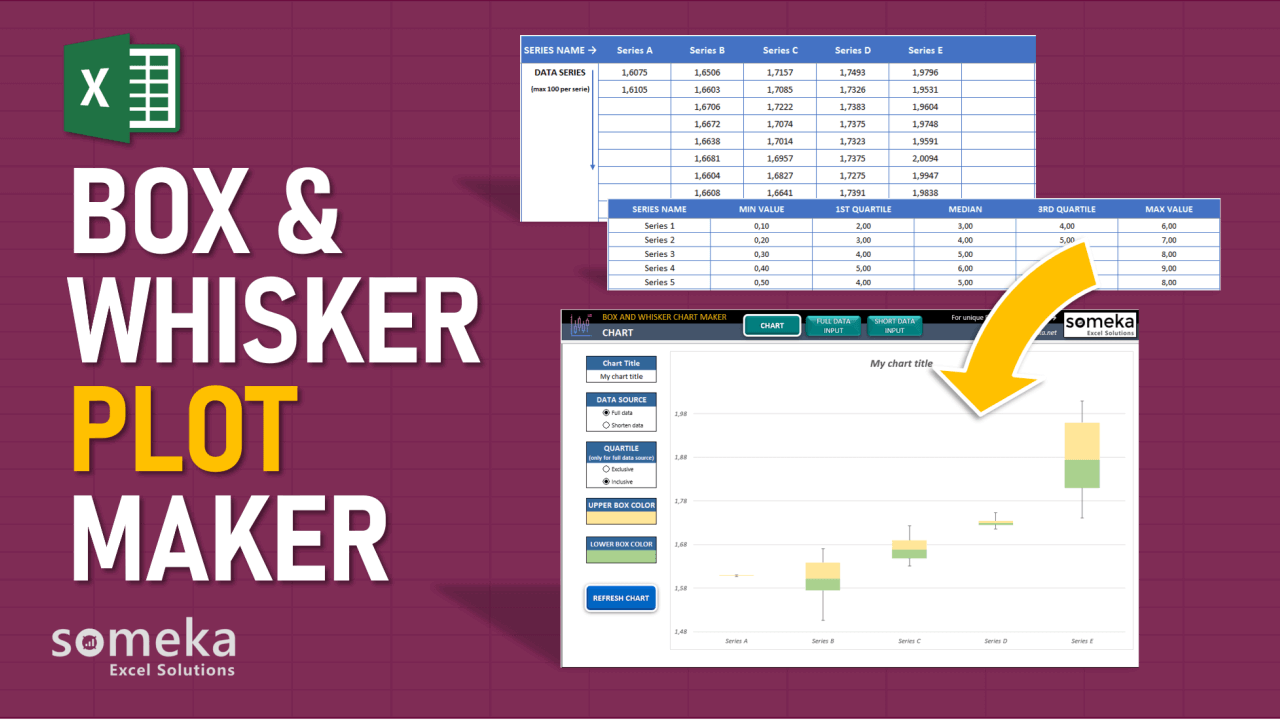
This Box and Whisker Chart Plot Maker template in Excel helps you to generate this type of chart easily and fast. All you need to do is, fill one of the data input sections according to the data number you have. Moreover, if you have enormous data, you should input it into the Full Data Input section. Otherwise, it would be better to use the Shorten Data Input section.
Box and Whisker Plot Maker Features:
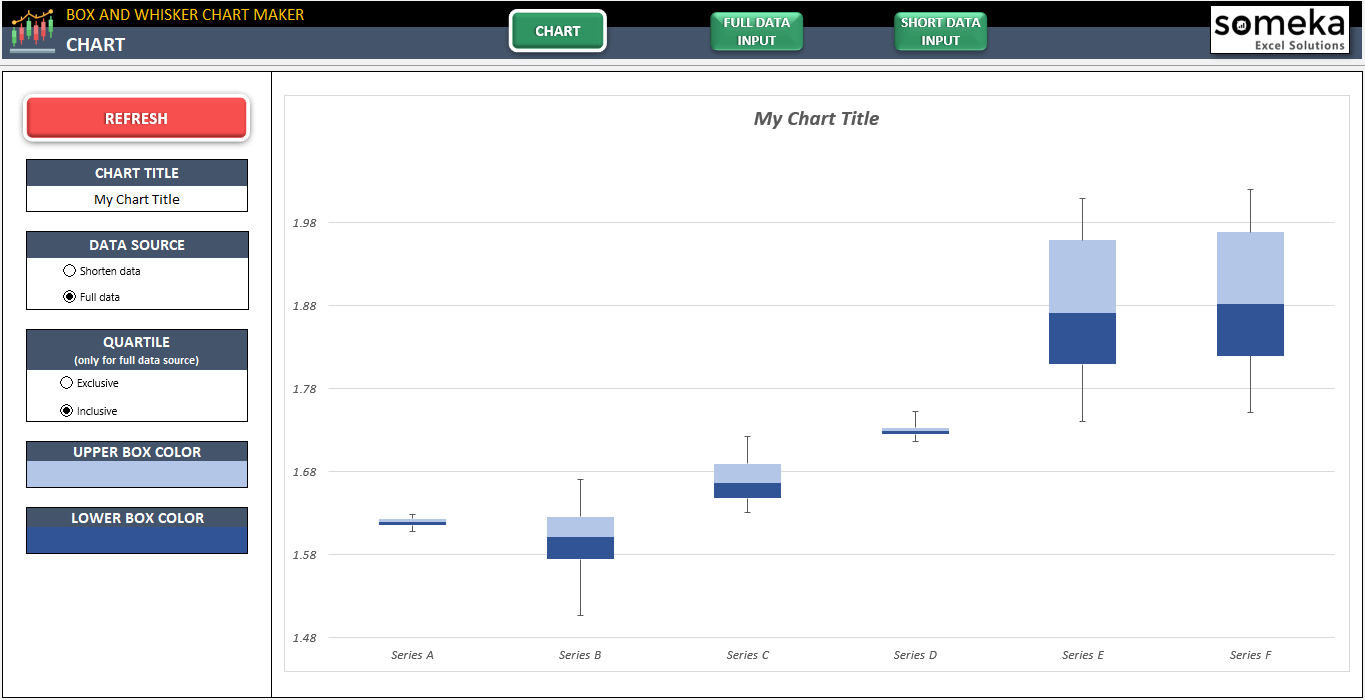
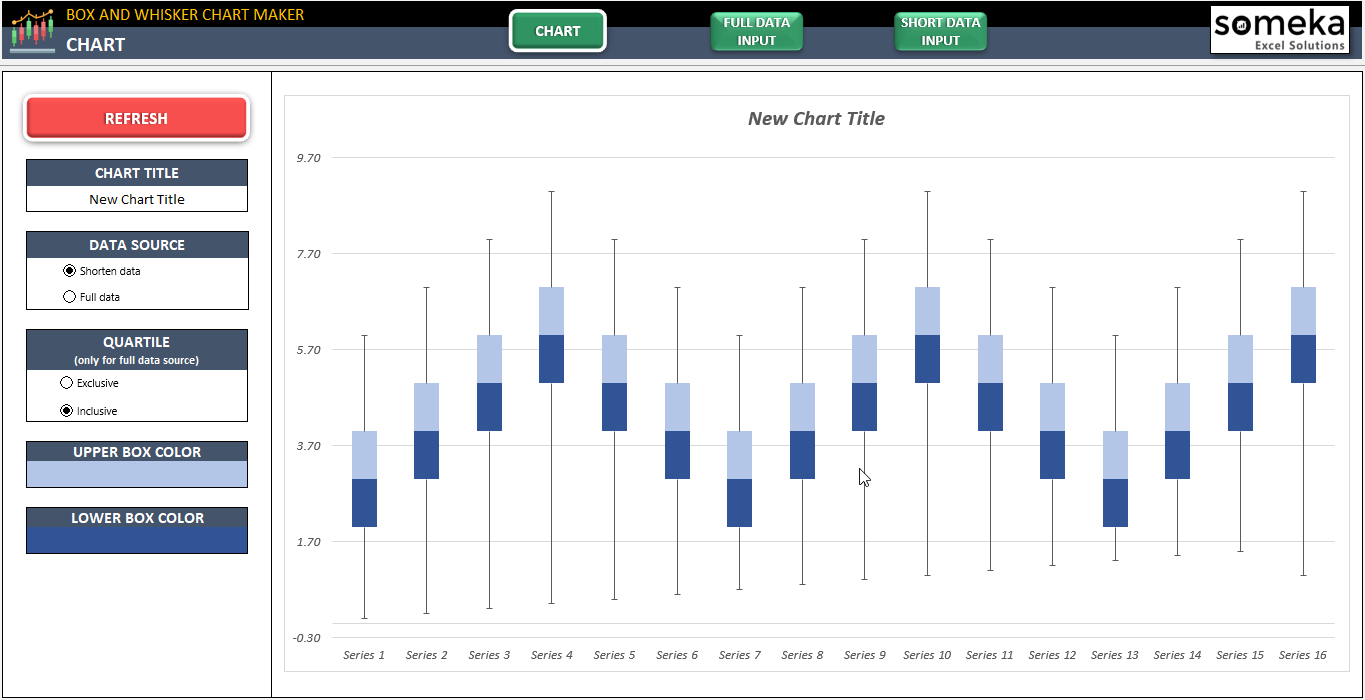
Chart Section:
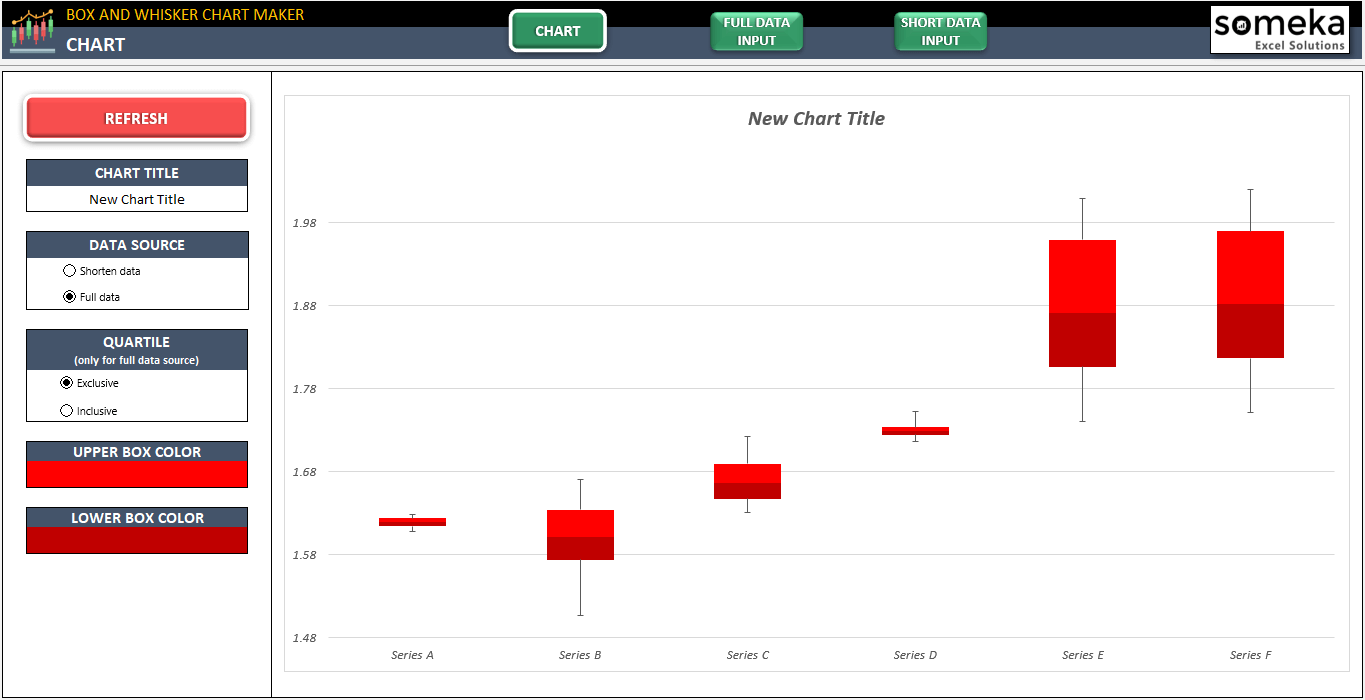
In general, you can see the original box and whisker plot according to your data in this section.
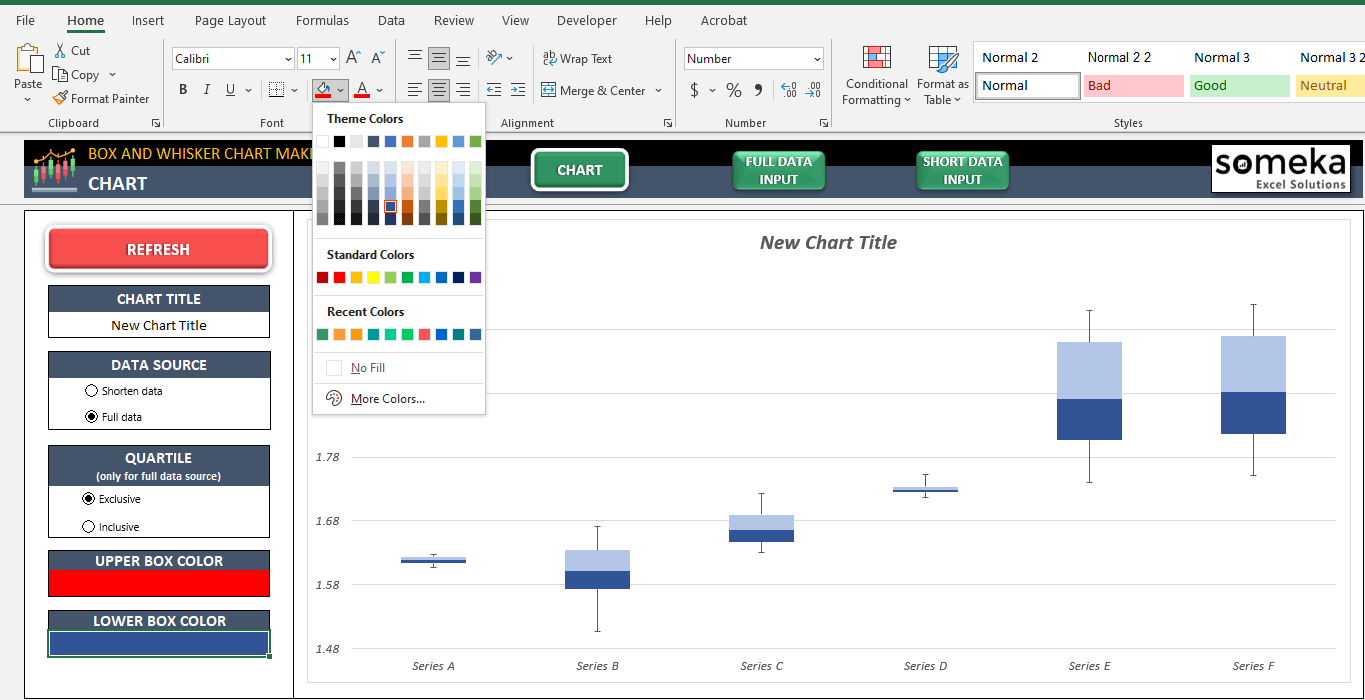
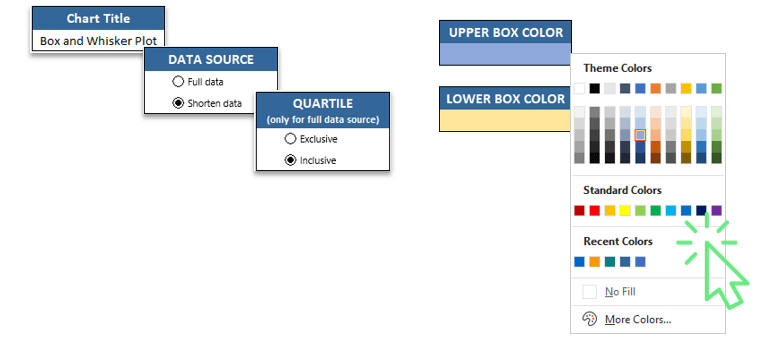
Firstly, you can select the Data source as Full Data or Shorten Data. Once you select your data source, the chart will update automatically.
Furthermore, you can also change the chart title manually from the chart sheet. Notable, there is also an opportunity to change the color of the upper and lower box from the leaved cells. After you changed the color of the boxes, please do not forget to click the Refresh button to update the chart.
 Important to realize, each box and its whiskers are created out of a separate batch of input data. So, those data are calculated in a specific way and based on that we get the result visualized as box and two whiskers. We use this box and whisker plot mostly to compare the distribution of values within some time.
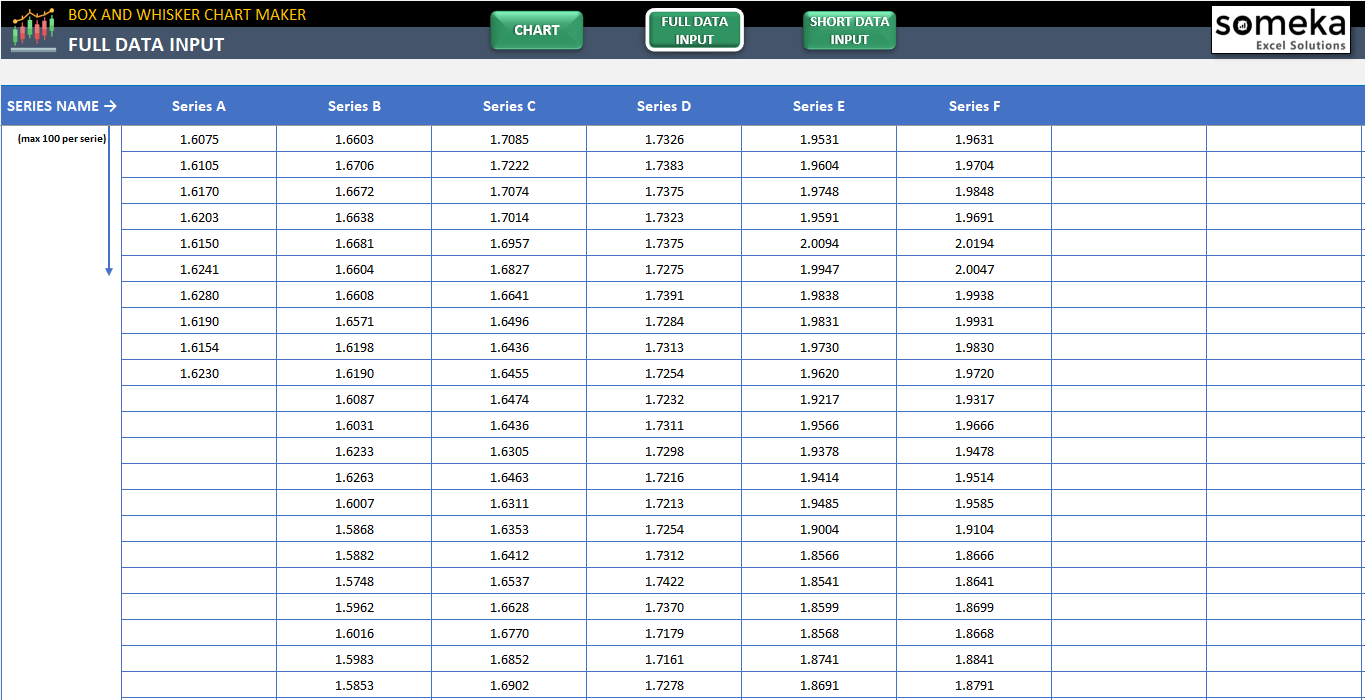
Full Data Input Section:
In this section, there is a quiet space for entering your data series. If the data amount is not enough to create a box and whisker plot, you will see and warning on the top of the Series Name. The template will specify the max, min values, quartiles, and median values of the data set you entered.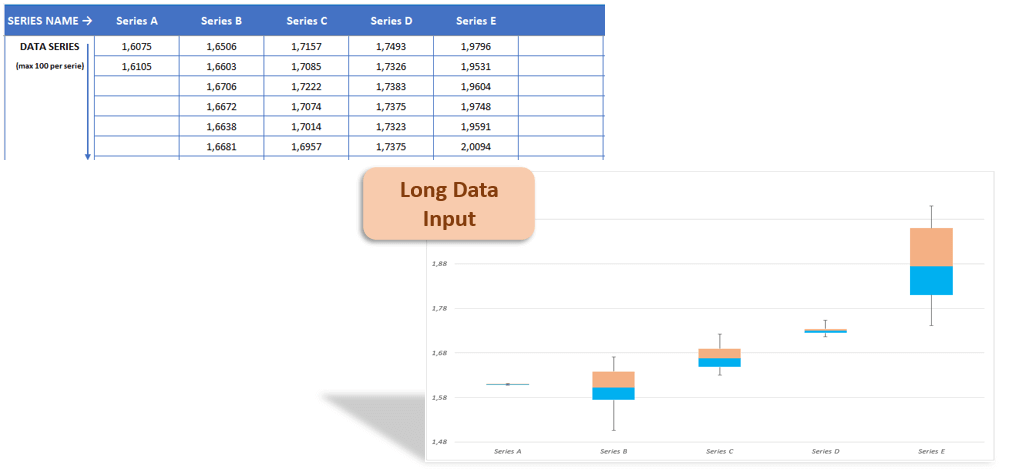
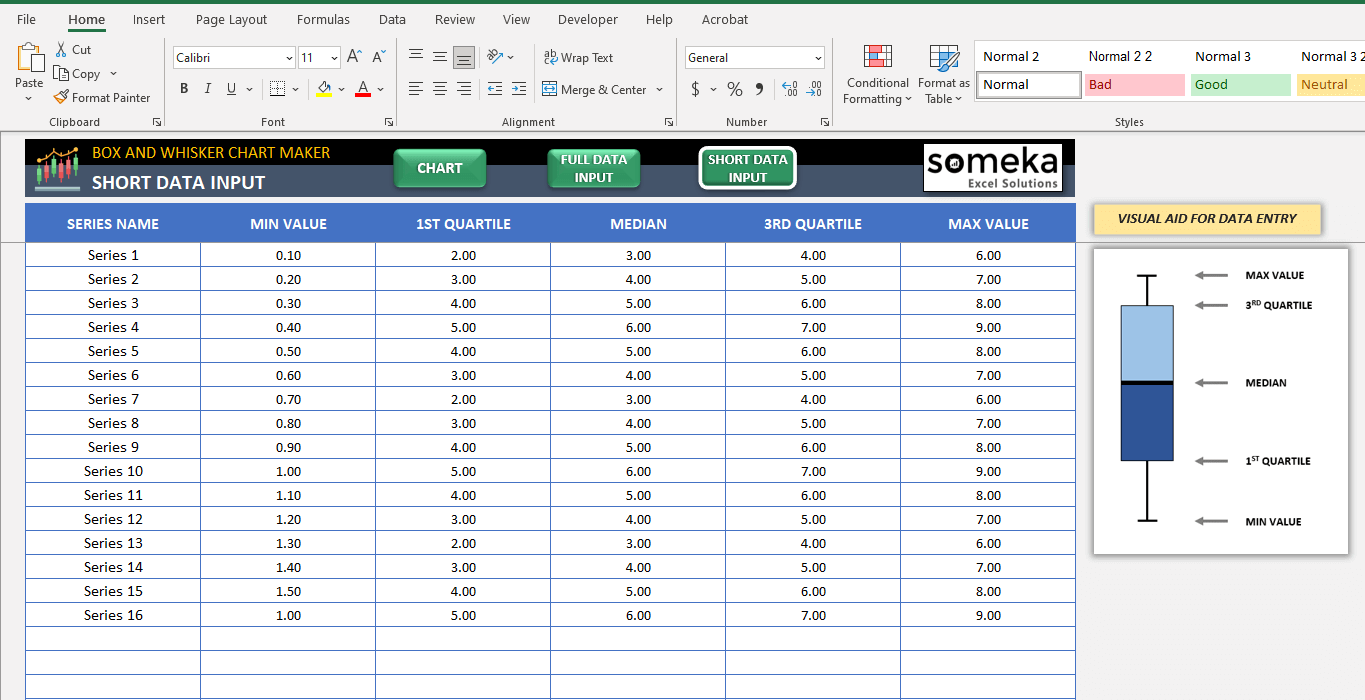
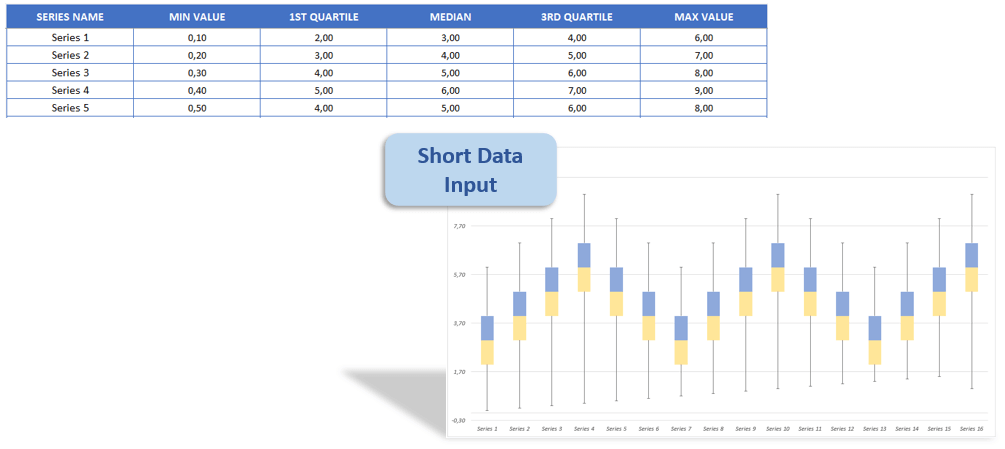
Short Data Input Section:
Finally, you can enter shorten data in this section. You already know the min value, 1st, and 3rd quartile, median, and max value of the data series. So, demonstrating the box and whisker plot shows all the important value points of the data set.
Box and Whisker Plot Maker Features Summary:
- Create Box and Whisker Plot in Excel
- Full Print Ready
- Informational notes included
- No installation needed. Ready to use.
- Works both on Mac and Windows
- Compatible with Excel 2010 and later versions
PRODUCT VIDEO
Watch the video below to see the template in action! Presentation also includes usage notes, explanations and tips & tricks about the template.
USER REVIEWS & COMMENTS
7 reviews for Excel Box and Whisker Plot Maker
You must be logged in to post a review.
RELATED TEMPLATES
-
 This product has multiple variants. The options may be chosen on the product page
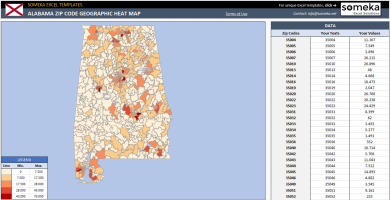
US County Heat Map Generator Excel Templates
$0.00 – $79.95Excel Template to generate heat maps for US Counties. Visualize your data in an editable spreadsheet. Copy paste shapes into Powerpoint.
-
This product has multiple variants. The options may be chosen on the product page
Box and Whisker Plot Google Sheets Template
$0.00 – $49.95Create box and whisker plot charts and visualize your data distribution in Google Sheets. Fully printable. Available on all devices.
-
This product has multiple variants. The options may be chosen on the product page
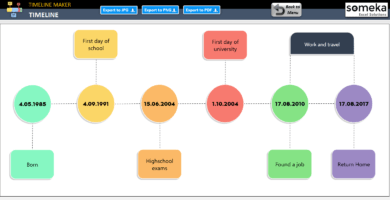
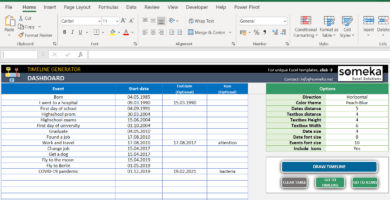
Excel Timeline Maker
$0.00 – $69.95Create a timeline in Excel automatically! This interactive spreadsheet template allows you to make functional timeline charts. Works in Mac & Windows.
-
This product has multiple variants. The options may be chosen on the product page
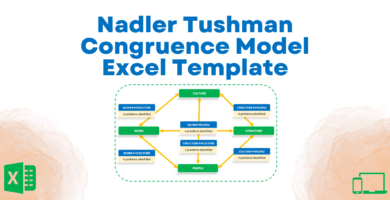
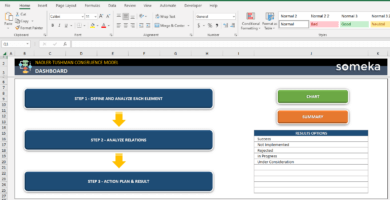
Nadler Tushman Congruence Model Excel Template
$0.00 – $59.95Congruence model framework in Excel. Review your organizational performance and plan your actions. Fully printable and ready for your presentations.
-
This product has multiple variants. The options may be chosen on the product page
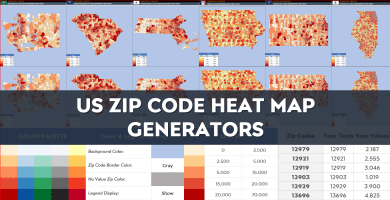
US Zip Code Heat Map Generator Excel Templates
$0.00 – $79.95US Zip Code Heat Map Generators convert your data into visual geographical heat map by zip code. Editable shapes in Excel & Powerpoint.
-
This product has multiple variants. The options may be chosen on the product page
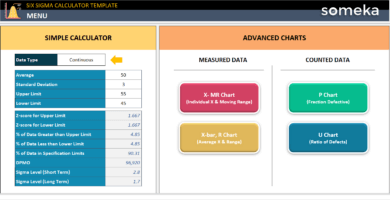
Six Sigma Calculator Excel Template
$0.00 – $69.95Calculate the Six Sigma level and create process control charts in Excel. Visual tool for monitoring the process behavior and variations. Ready for presentations.

Pedro –
This is a good template but I have got problem when i make change to color of the chart it doesn’t work
Someka –
Hi Pedro,
If you are trying to change the colors of the upper and lower boxes, you can do it from the ´Chart´ tab.
Make sure to click the ´Refresh chart´ button once finished to show the changes.
Please see the image below.
Lucia –
Great app and very useful.thx
Sandy –
This product has everything you need and it is easy to use! I recommend it!
MANUEL GONZALEZ –
Excelente herramienta !!
Ric –
Note: This plot maker does not plot negative values, unfortunately.
Someka –
Thank you for your comment. Our developers are checking the issue with negative values.
We’re trying to find out if it is theoretically possible to get box and whisker plot charts with negative values.
Dominique Davis –
This is very amazing and fantastic. We are using charts and graphs in my accelerated class for 6th graders and now they are acing box plots
Nancy Barron –
This is terrific. We are using charts and graphs in my financial math class at school. This is very helpful for my students.