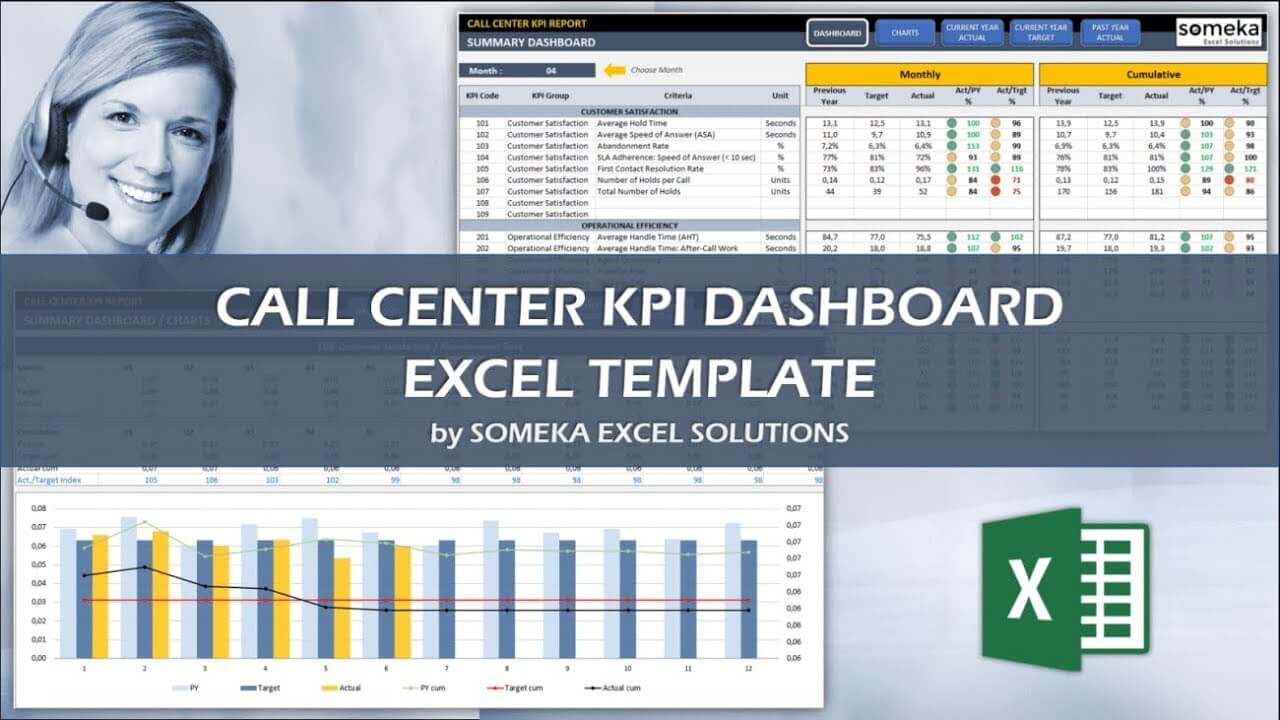
Call Center KPI Dashboard Excel Template
Excel KPI spreadsheet for call centers. Track your key metrics with yearly and target-based comparisons. Printable dashboard with trend charts.
TEMPLATE DESCRIPTION
Do you manage a Call Center? If so, you will be aware of the great need to set goals and targets for your operators and agents. Thus, this Call Center KPI Dashboard Excel Template is a purpose-built system created to support you in collecting the necessary data for your success and customer satisfaction.
You should always track your KPI and also OKR (Objectives and Key Results) metrics for a sustainable call center business.
Generally, our readymade Excel Template supports you in following your key measures and enables you to present your results in a simple, professional way.

CRM KPI dashboards are designed to track and measure your organization’s business and sales processes in order to improve them.
The Question is – Which KPIs Should A Manager Follow?
Above all, as a qualified person in your job or business, you will understand the essential requirement to fulfill your role. However, our Template design has already taken away all the hard work and collated 20 of the most used Call Centre KPIs, such as:
- Average Speed of Answer (ASA)
- First Contact Resolution Rate (FCR)
- Number of Holds per Call
- And many more…
So, we have grouped them under three main categories as Customer Satisfaction, Operational Efficiency, and Business Value. You also have the option to add, create, and track your own unique KPIs to the template.
Creating A Successful Call Centre KPI Dashboard is Easy
Once you have your metrics entered you can then add the goals you want to establish for your team. So, from here you can identify the differences between previous years and your current targets. Furthermore, the Template will offer you an insight into trends with data in the form of interactive charts. The Template gives you the following:
- Call Centre Key Performance Indicators Description
- Charts Showing Trends
- Year on Year to Target Comparisons
- Monthly & Collective Analysis
Therefore, using this Template is a great way to measure your results and achieve success within your company.
Call Center KPI Dashboard Excel Template Sections:
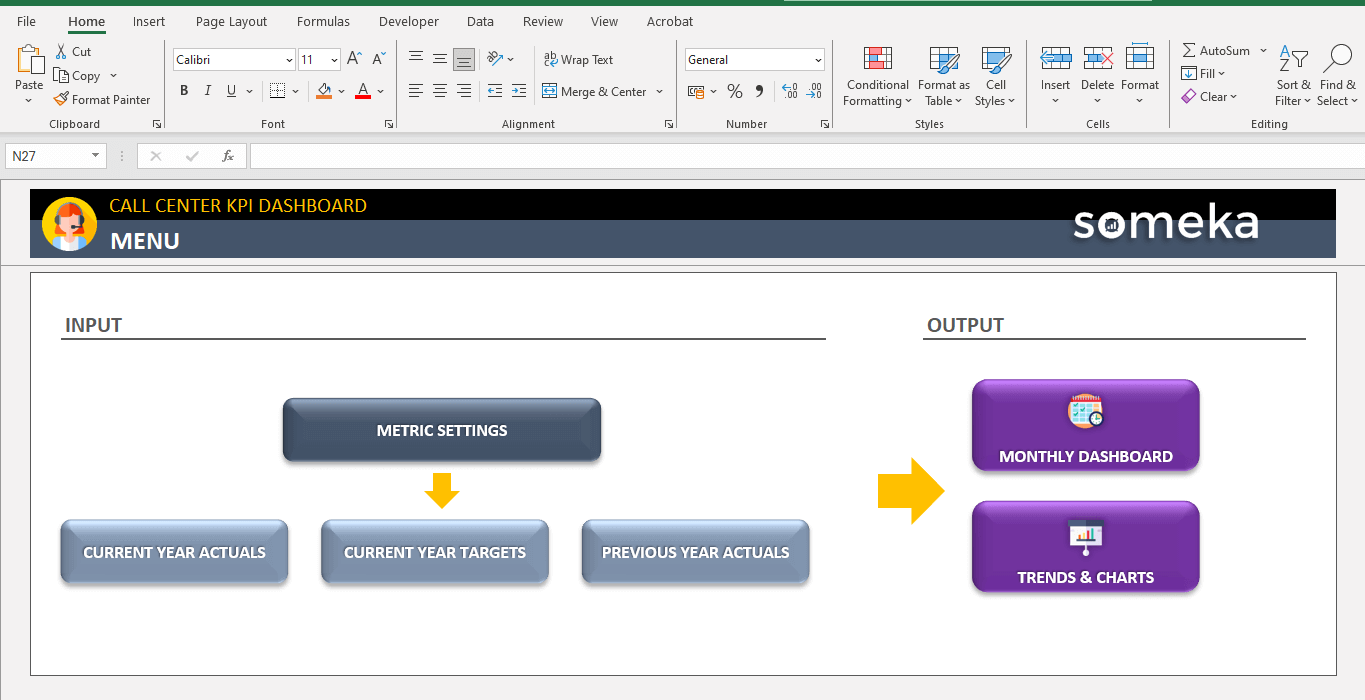
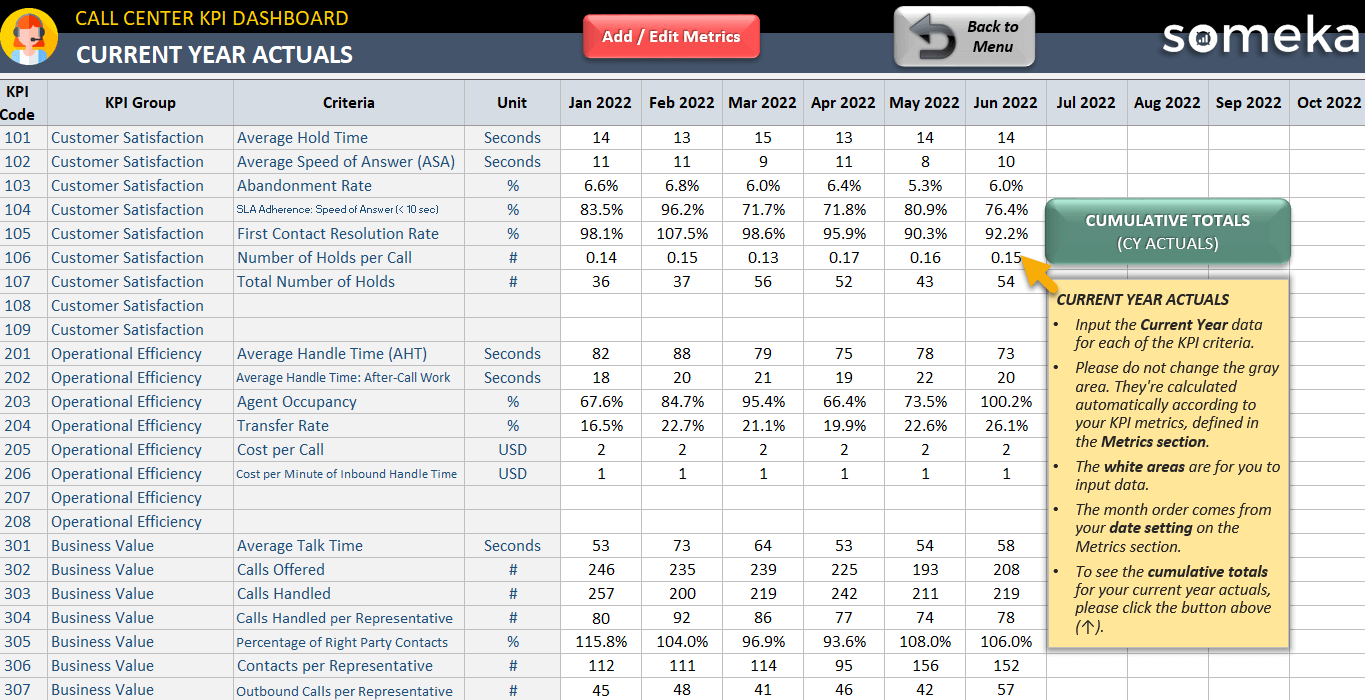
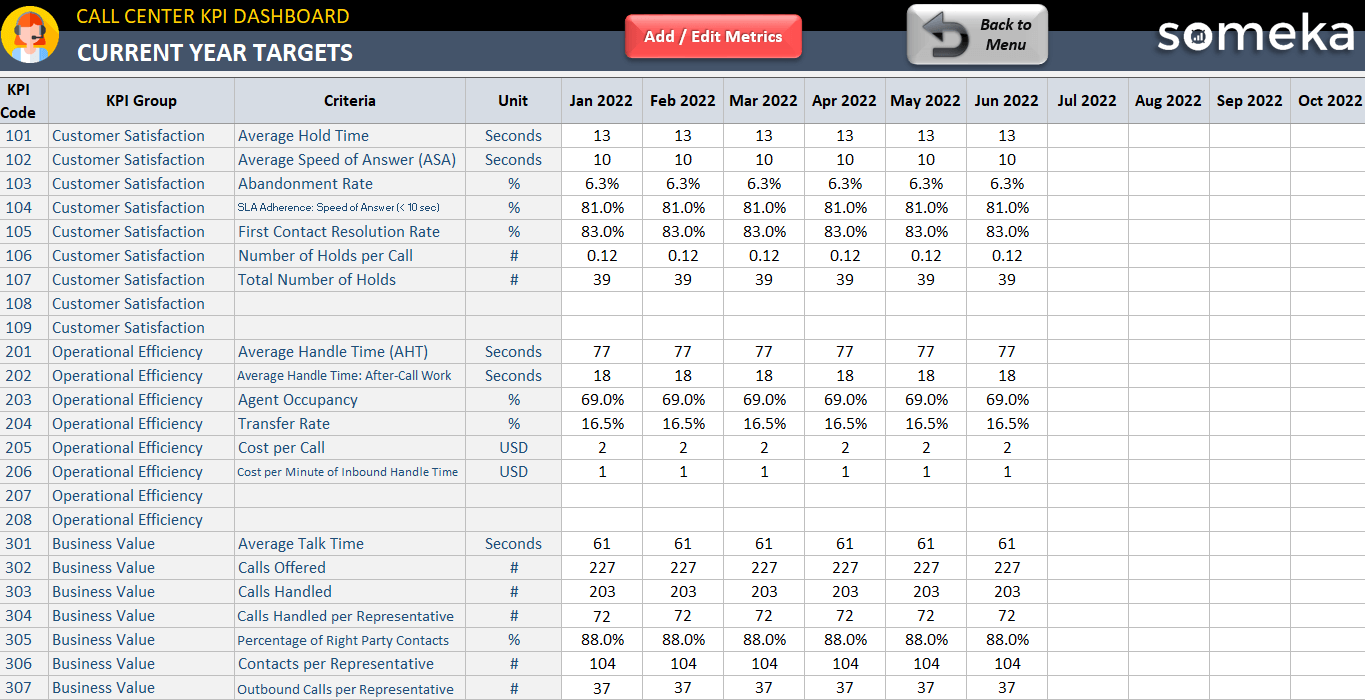
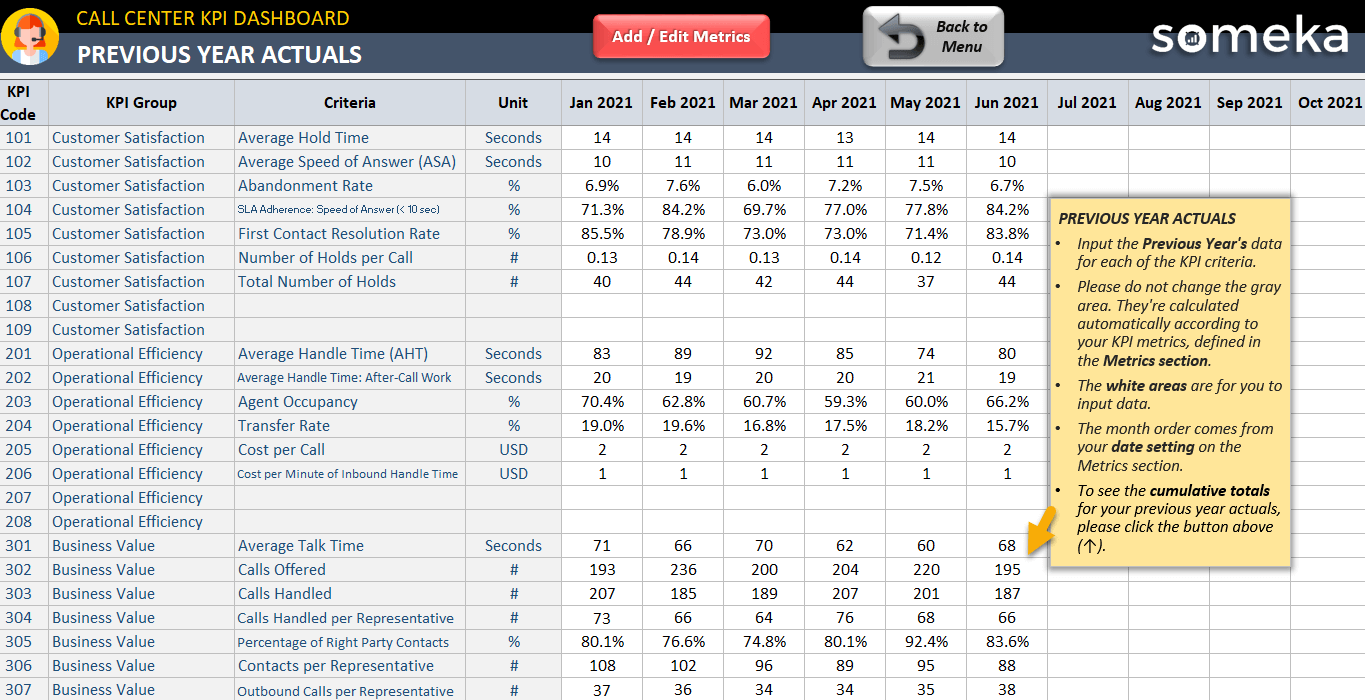
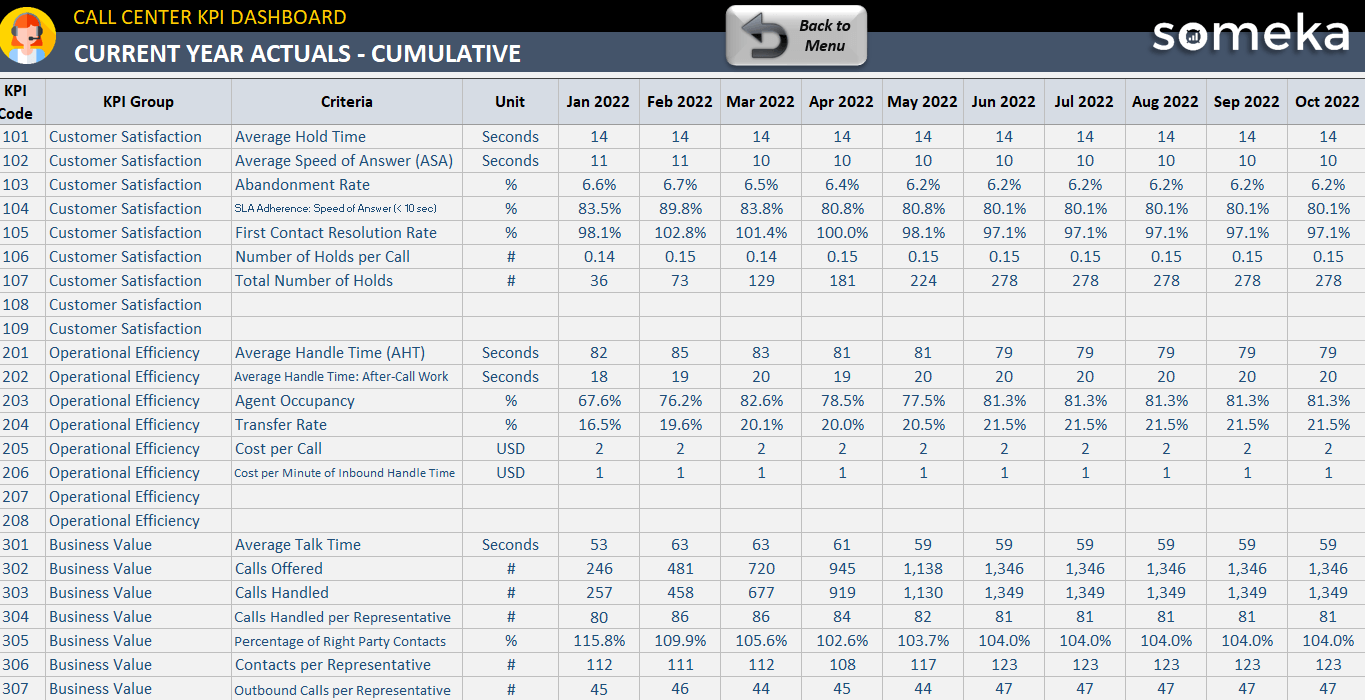
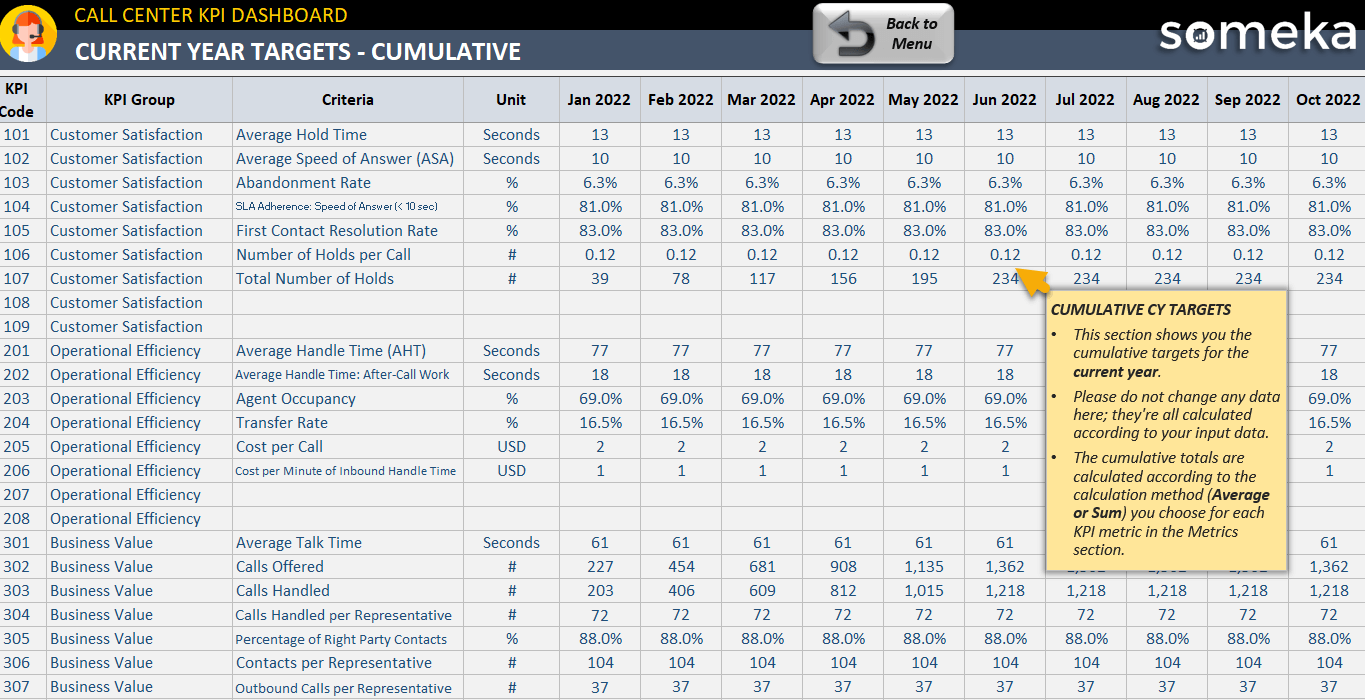
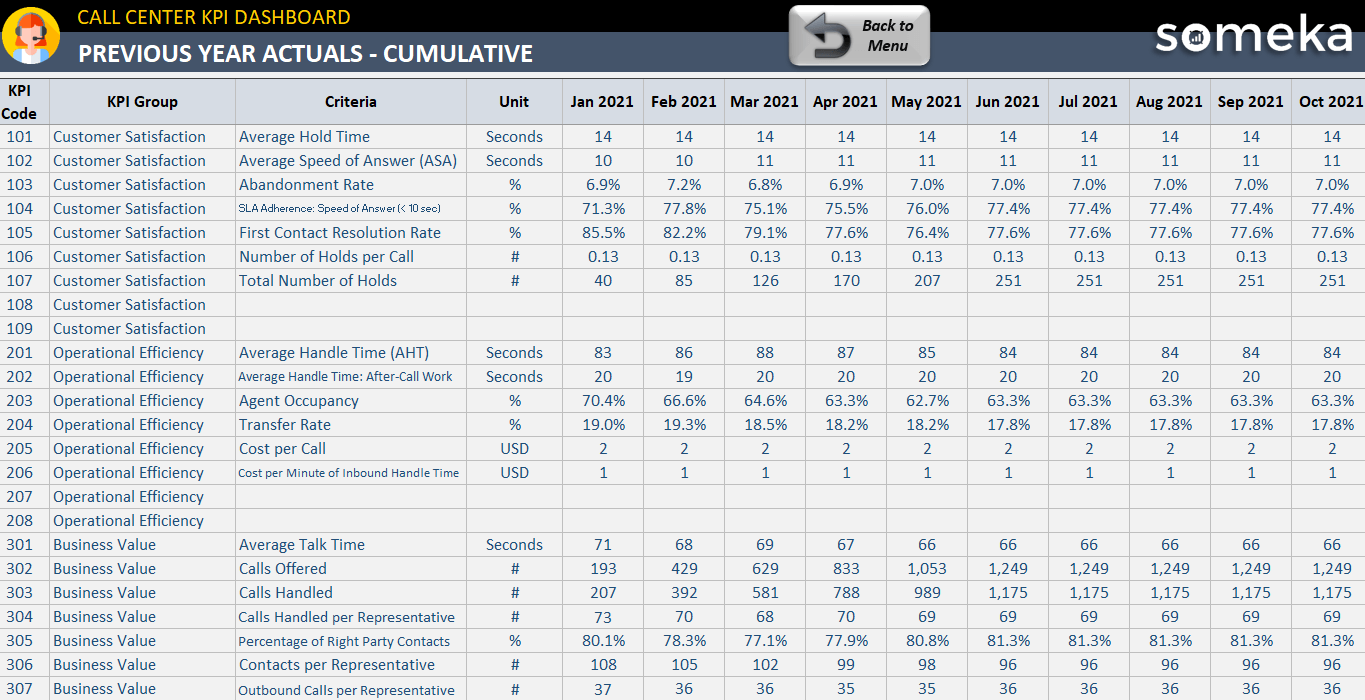
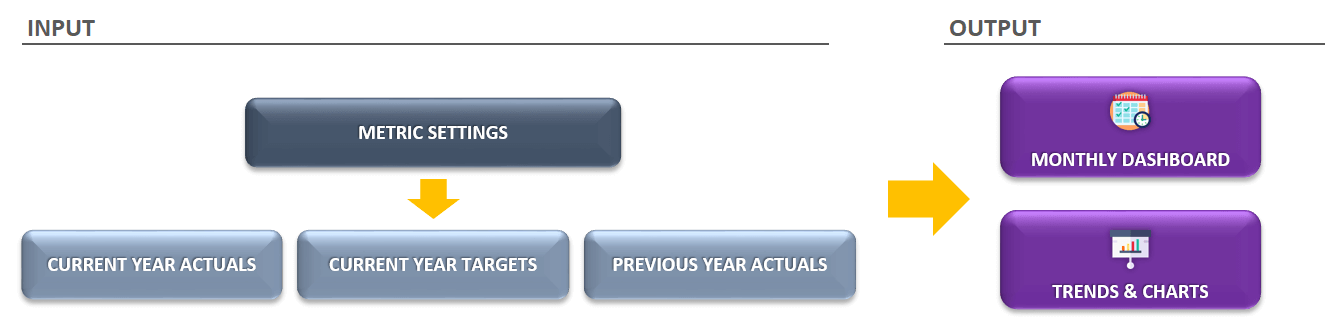
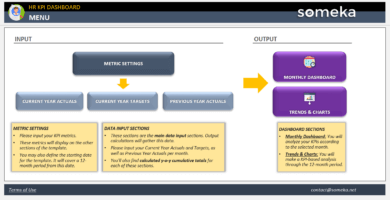
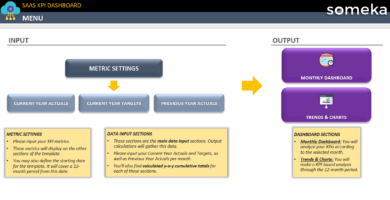
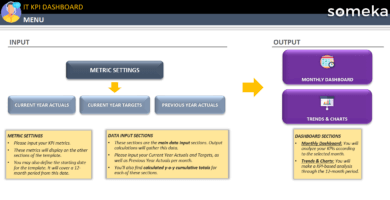
Basically, this template is divided into two sections: inputs and outputs. Input cosists of: Metric Settings, Current Year Actuals, Current Year Targets, Previous Year Actuals.
The Output section includes: a monthly dashboard, trends, and charts to help in analysis.
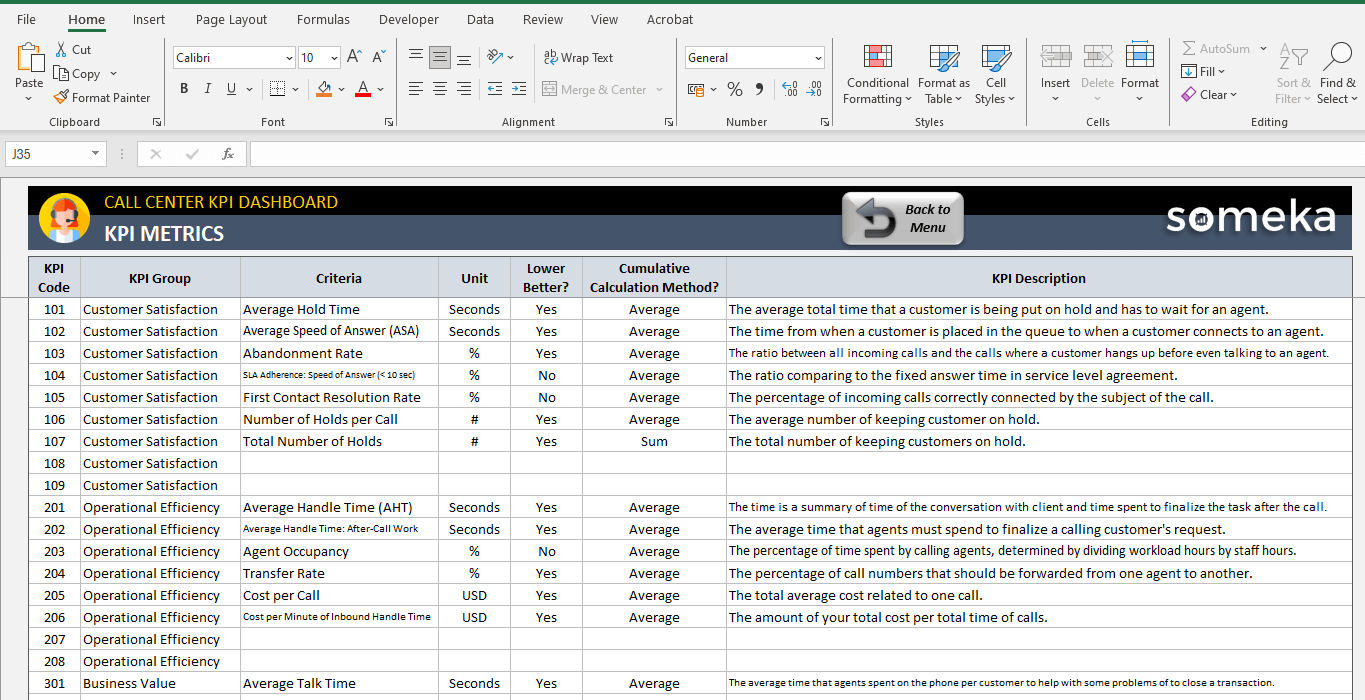
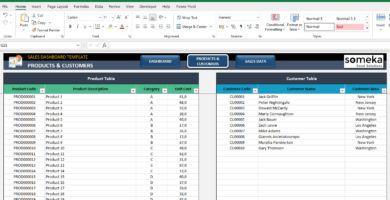
 KPI Metrics for Call Centers:
 KPI Metrics for Call Centers:
Firstly, this sheet contains some predefined answers in columns that you can add, change, or delete.
You can also select KPI Group, KPI Criteria, Unit, Lower is Better or Not, and Cumulative Calculation Method from the DropDown menu.

Additionally, if you have any notes or descriptions for your KPIs, include them in the KPI Description column.
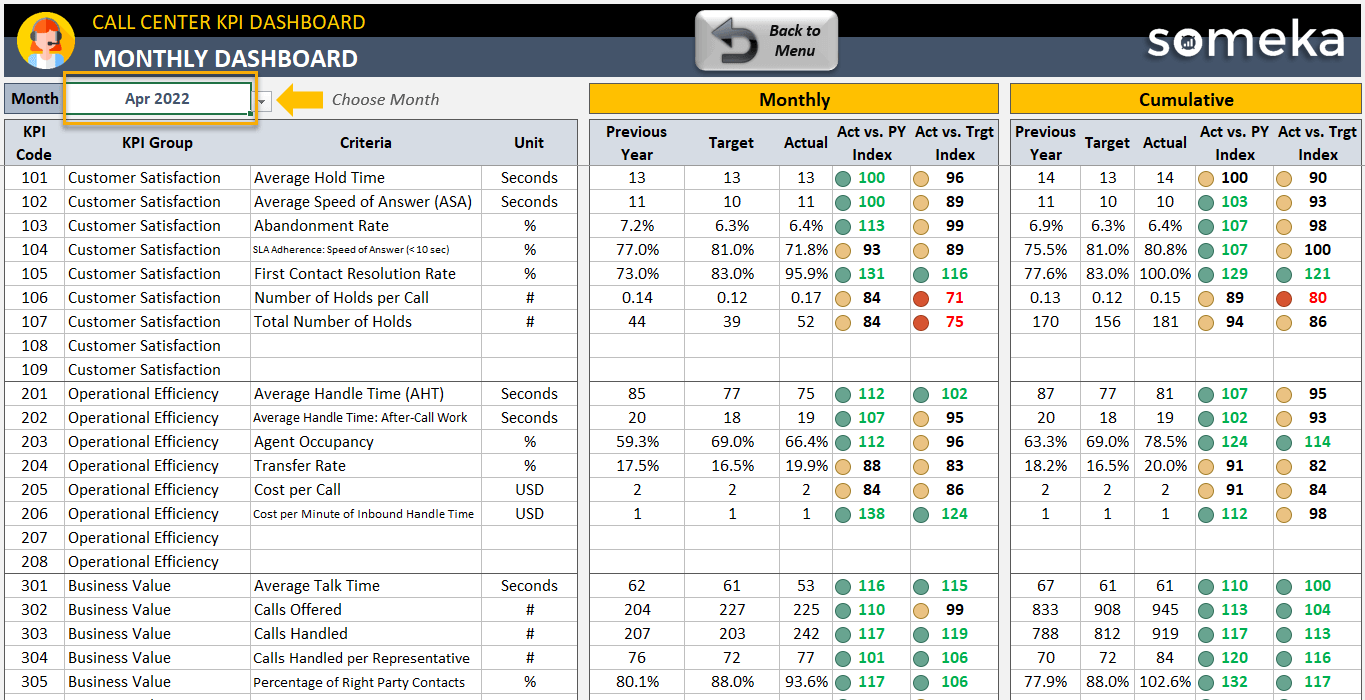
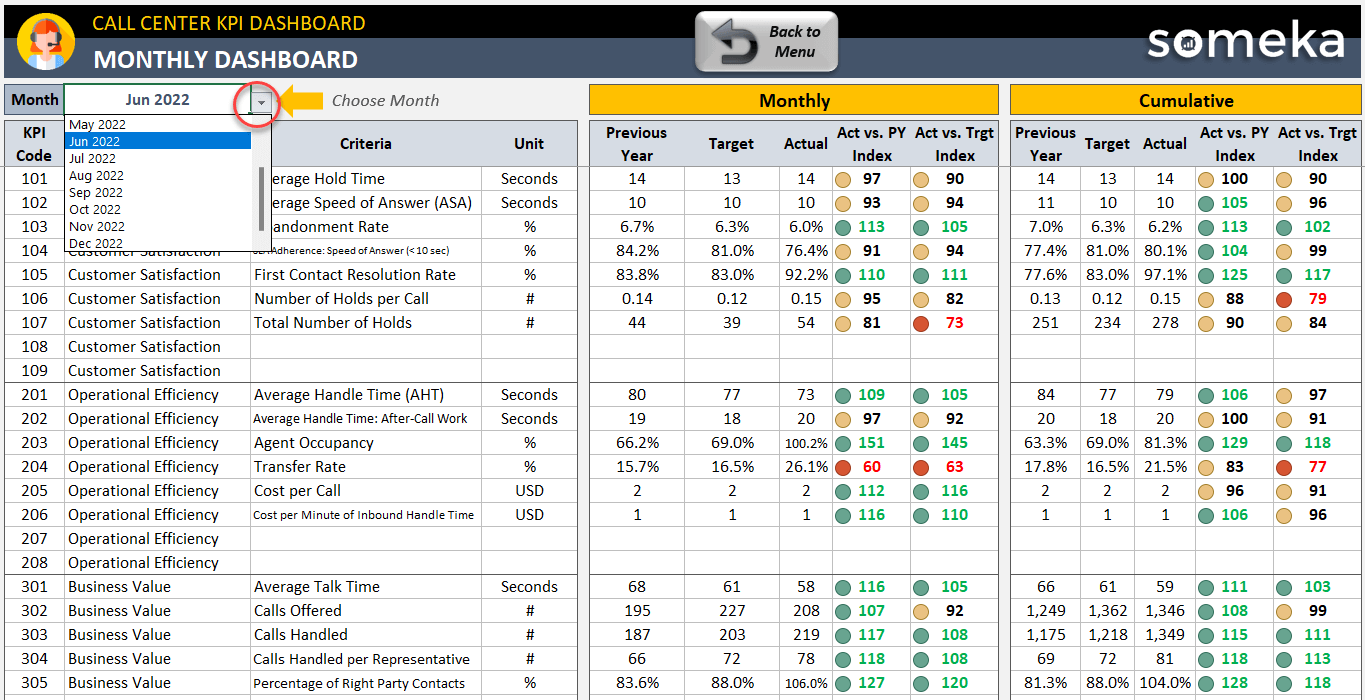
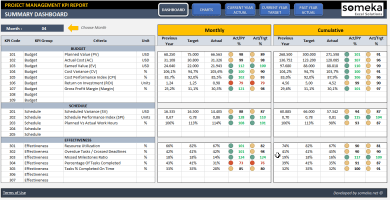
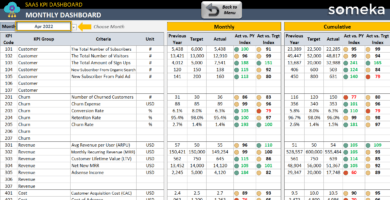
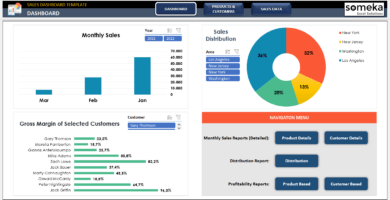
Monthly Summary
Secondly, in this section, first select the month for which you want to view the analytics. The template will then dynamically display the Monthly and Cumulative Analysis.
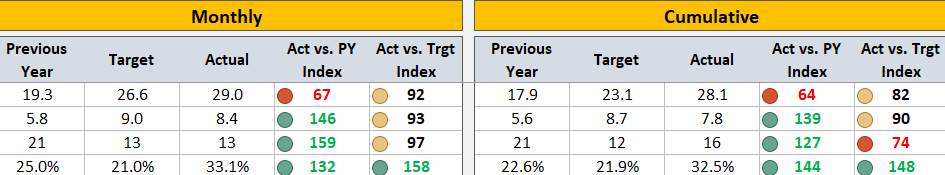
Additionally, Actual VS. Previous Index and Actual VS. The Target Index is visible in three different colors. Green indicates that you met the target, Yellow indicates that you met 80% of it, and Red indicates that you fell short of the target.
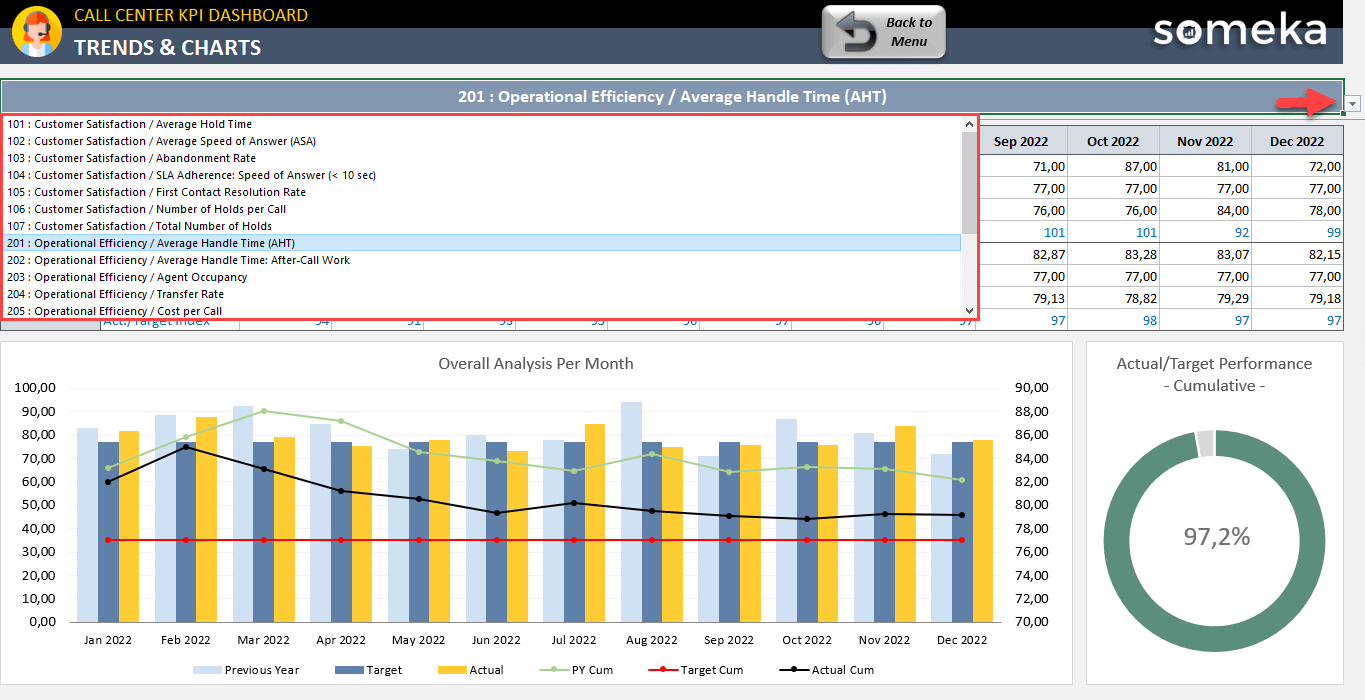
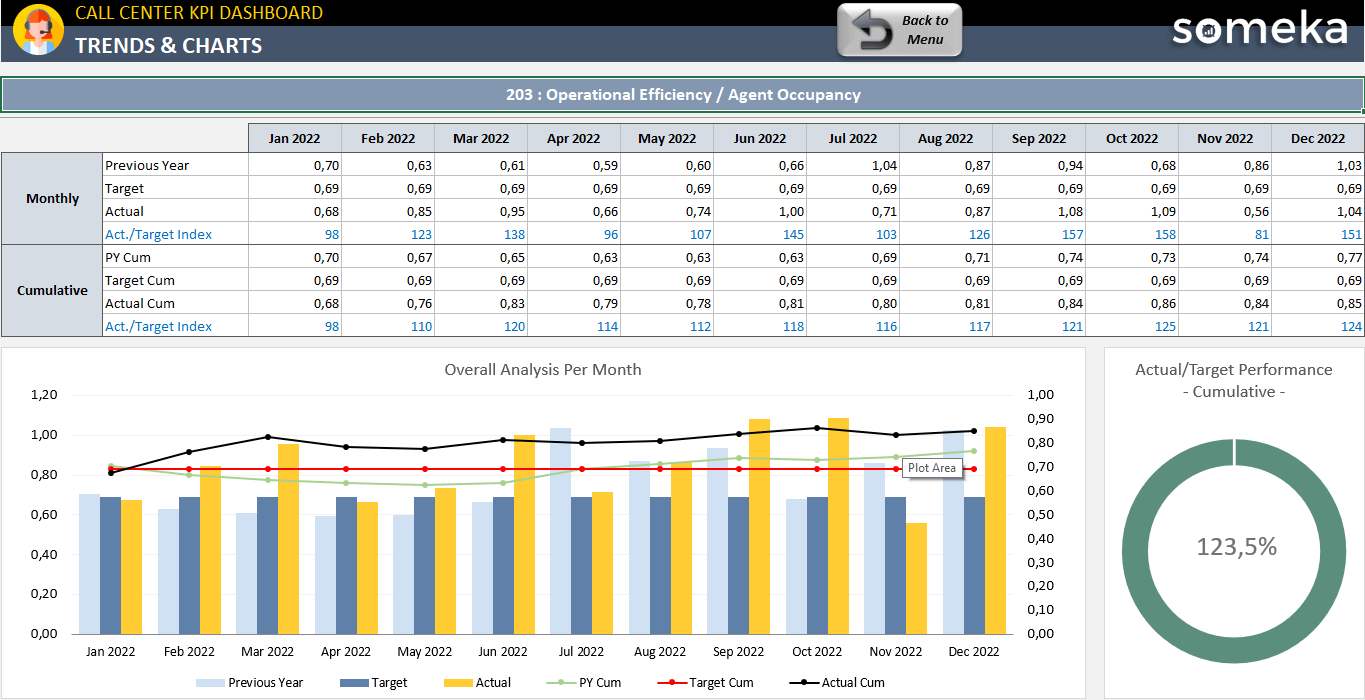
Charts for KPI Analysis
Finally, this section will help you track your KPIs’ monthly and cumulative performance. The results are displayed in a Bar Graph and a Doughnut Chart.
Call Center KPI Dashboard Excel Template Features:
- Monthly and Cumulative analysis
- Comparison with Past Year and Target values
- Summary dashboard supported with interactive charts
- Easy to use and nice design to be used in presentations
- Clear on-sheet instructions
- Compatible with Excel 2010 and later versions
- Works both on Windows and Mac
- No installation needed, ready-to-use
- Full Print ready
- White Label
- Does not include any VBA macros
EXCEL KPI DASHBOARDS COLLECTION
PRODUCT VIDEO
Watch the video below to see the template in action! Presentation also includes usage notes, explanations and tips & tricks about the template.
USER REVIEWS & COMMENTS
9 reviews for Call Center KPI Dashboard Excel Template
You must be logged in to post a review.
RELATED TEMPLATES
-
 This product has multiple variants. The options may be chosen on the product page
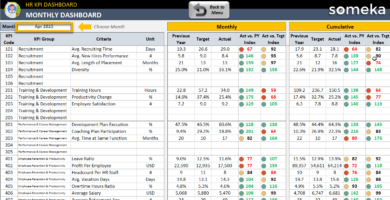
HR KPI Dashboard Excel Template
$0.00 – $79.95Excel spreadsheet for HR metrics. Most common staff KPIs. Printable dashboard with trend charts. No installation needed. Ready to use.
-
This product has multiple variants. The options may be chosen on the product page
KPI Dashboard Excel Templates Bundle
$199.95 – $399.95Bundle pack for KPI Dashboard templates in Excel. Top selling KPI tools. All uniquely designed, printable, professional spreadsheets. Ready for use.
-
This product has multiple variants. The options may be chosen on the product page
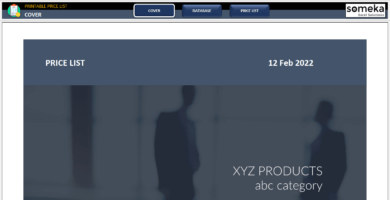
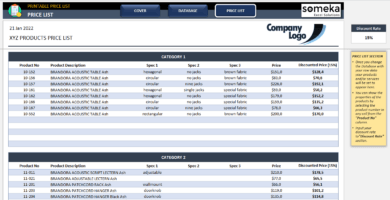
Price List Excel Template
$0.00 – $59.95Ready-to-use Price List Template for your products and services. Easily customize it according to your small business needs. All in Excel. Ready-To-Print.
-
This product has multiple variants. The options may be chosen on the product page
SaaS KPI Dashboard Excel Template
$0.00 – $79.95Excel KPI tracker for software business. Track your key metrics with monthly and cumulative analysis. Printable, dynamic and nice-looking dashboard.
-
This product has multiple variants. The options may be chosen on the product page
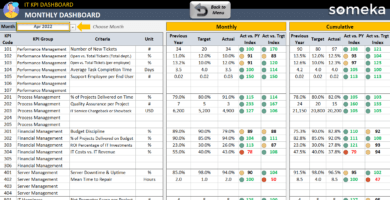
IT KPI Dashboard Excel Template
$0.00 – $79.95Excel spreadsheet for IT departments. Track your key metrics in information technology with target-based and yearly comparisons. Printable trend charts.
-
This product has multiple variants. The options may be chosen on the product page
Sales Dashboard Excel Template
$0.00 – $69.95Interactive Sales Dashboard Template in Excel. Great tool for sales management. Features a dashboard with profitability, sales analysis and charts.
Katrina D. Mauney –
nice tool and the best support! I have been using it for almost two years and have received answers to all of my questions so far.
Soren Manning –
When I look at the KPI dashboard, I only see monthly performance. What if I wish to track KPIs on a daily, weekly, and monthly basis?
Someka –
Hi Soren, The ready-to-use versions of our KPI templates are for tracking monthly metrics. However, we can create a custom template for you on weekly /daily / any predestinated period basis. If you are interested in our Custom Services, please contact us via contact@someka.net. Thanks
Mary Jane Cameron –
wish it was cheaper 🙁
John K. Hayde –
I was so impressed with my previous purchase that I had to come back.
Magnolia Foster –
Your KPI templates seem to cover many metric data handling concepts
Ljubica –
Nice and complete but a bit difficult to use, our workers had a hard time to learn how to use it but once understand we use it for our work, thank you
Someka –
Hello and thank you for your feedback.
Have you watched the video tutorial to learn more about the template?
You can watch it and get an overview of using the tool step by step.
If you have more questions after watching it, please get in touch with us via Livechat or Mail.
We’d be more than happy to clarify things for you.
Onyinye –
This is great tool, I thank you Someka
Aeron M –
As default great performance plan as I needed. Customization is complex a bit.
Chris Evens –
Nice dashboard…Its going to save lot of effort in coming days!