GE McKinsey Matrix Excel Template
Growth Matrix to evaluate business portfolio. Compare industry attractiveness and strength in a visual chart. Ready-to-use GE McKinsey Matrix Excel Template.
TEMPLATE DESCRIPTION
Do you want to evaluate all your business portfolio or investment prospects? Here’s our complete GE McKinsey Matrix Excel Template!
This tool was carefully made to help business analysts, strategic planners, and corporate leaders make better portfolio analyses and strategic decisions.

With this GE McKinsey Matrix Excel Template, you can get the most out of your business portfolio.
What’s GE McKinsey Matrix?
The GE-McKinsey Matrix is a renowned business tool used for portfolio analysis and strategic planning. Developed jointly by McKinsey & Company and General Electric in the 1970s, it helps businesses assess their business units or product lines in terms of their market attractiveness and the company’s strength in that market.
This strategic framework is particularly useful for large corporations with diversified portfolios, offering insights into where to allocate resources for maximum return and competitive advantage.
What are the dimensions of GE McKinsey Matrix?
The matrix has two axes: 1. Business Strength, 2. Market Attractiveness
1. Business Strength: This dimension assesses how strong a company or business unit is within its market. It includes factors like market share, brand strength, product quality, customer loyalty, production capacity, and financial resources. Essentially, business strength measures the ability of the business to compete effectively and profitably in its industry.

2. Market Attractiveness: This dimension evaluates the overall appeal or potential of the market or industry in which the business operates. It considers factors such as market growth rate, market size, profitability, competitive intensity, and technological stability. A more attractive market is typically one that offers higher growth opportunities and profitability with manageable levels of competition and risk.

In the GE-McKinsey Matrix, businesses use these two dimensions to plot their various business units or product lines, helping them to make informed strategic decisions regarding investment, development, or divestiture.
Why to use GE McKinsey Matrix?
This tool is commonly used to evaluate investment prospects. It gives you an comparative visual based on the Market Attractiveness and Competitive Position of individual business units.
- Strategic Portfolio Management: Assess and categorize business units effectively, aligning them with your overall business strategy.
- Time-Efficient Analysis: With ready-to-use formulas and layouts, save hours of work on complex calculations and data representation.
- Informed Decision Making: Leverage data-driven insights to make well-informed decisions on investments, divestitures, or resource allocations.
- User-Friendly: Even if you’re not an Excel expert, our intuitive design makes it easy to navigate and utilize the full functionality of the template.
How to use GE McKinsey Excel Template?
The template consists of four main sections:
- Settings
- Business Table
- Dashboard
- Category List
Let’s explore these sections one-by-one.
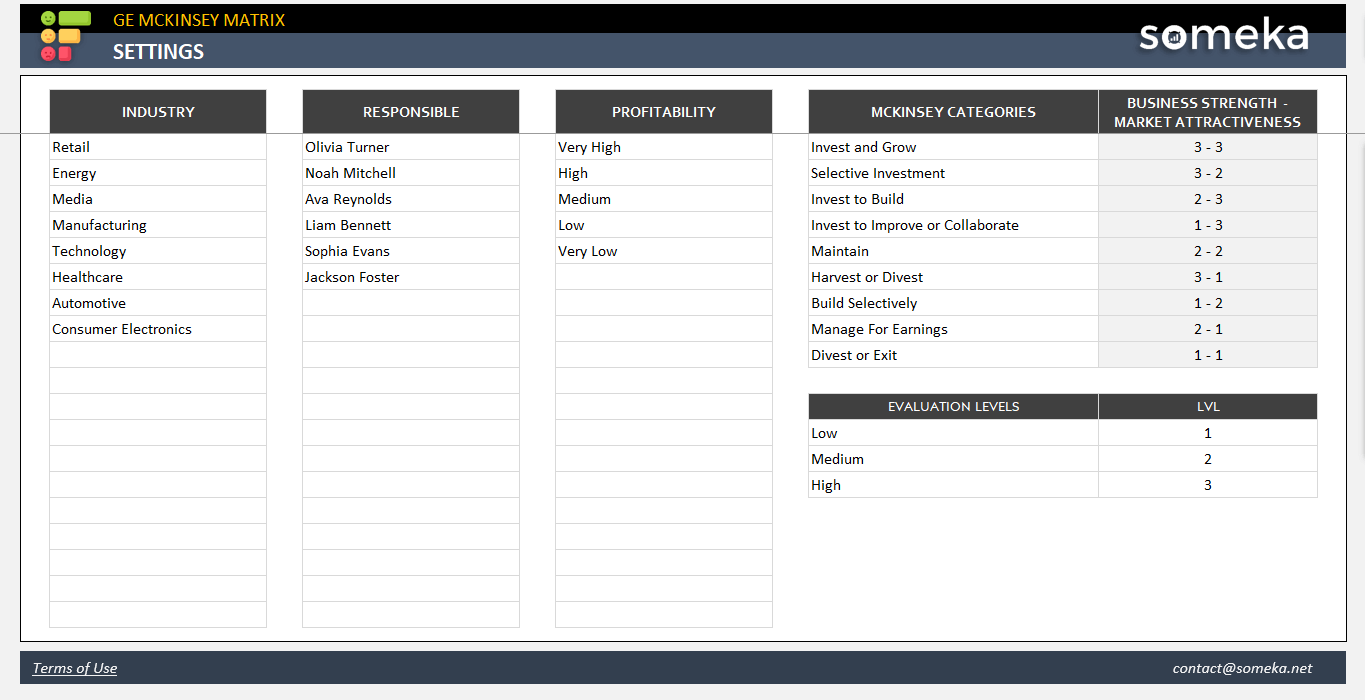
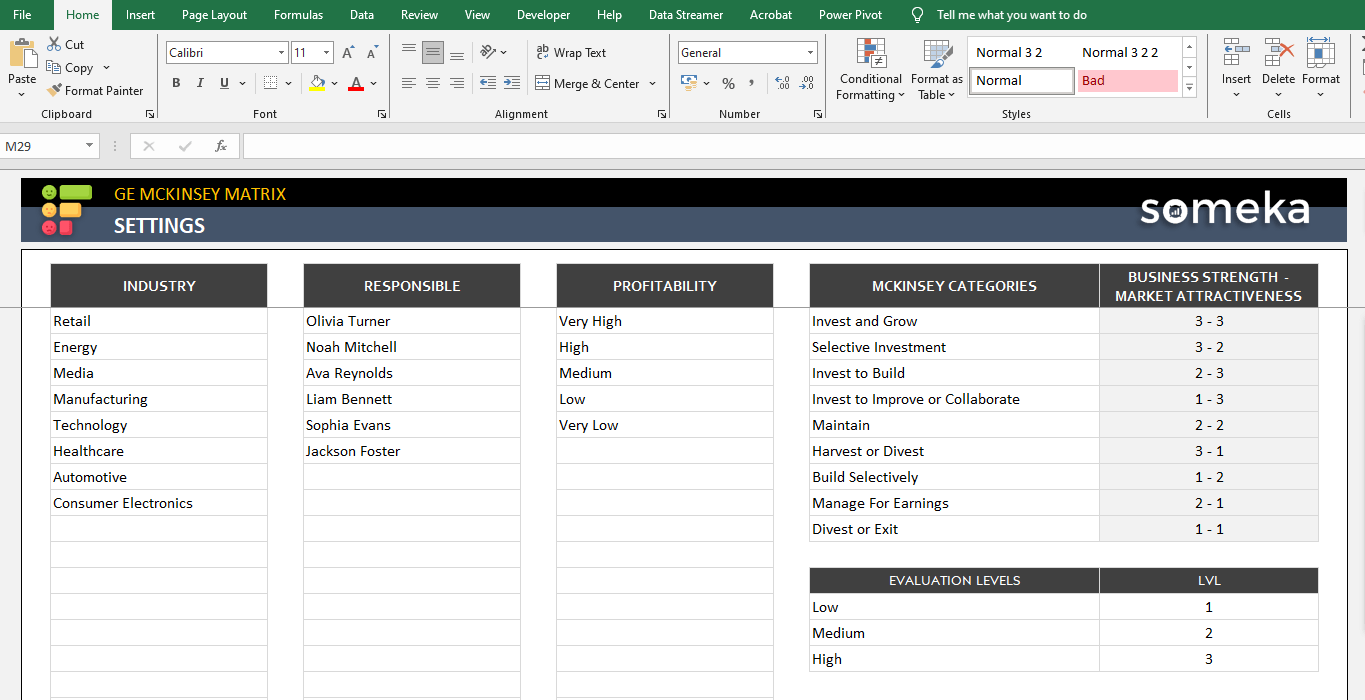
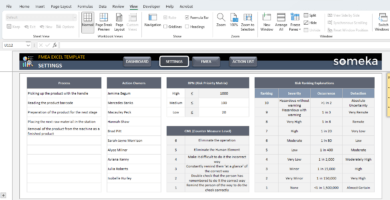
1. Settings:
Comprehensive settings panel allowing you to customize the template according to your business requirements. So you’ll find adjustable parameters to refine your analysis and gain more precise insights.
Here you’ll define the Industries, Responsible People, Profitability Levels and also Evaluation Levels. Then this Excel template will use these metrics all through your investment assessment journey.
In this configuration section, you can also define your categories for your nine block investment evaluation. We have added the mostly used McKinsey categories for you, but you can easily edit them according to your preferences.
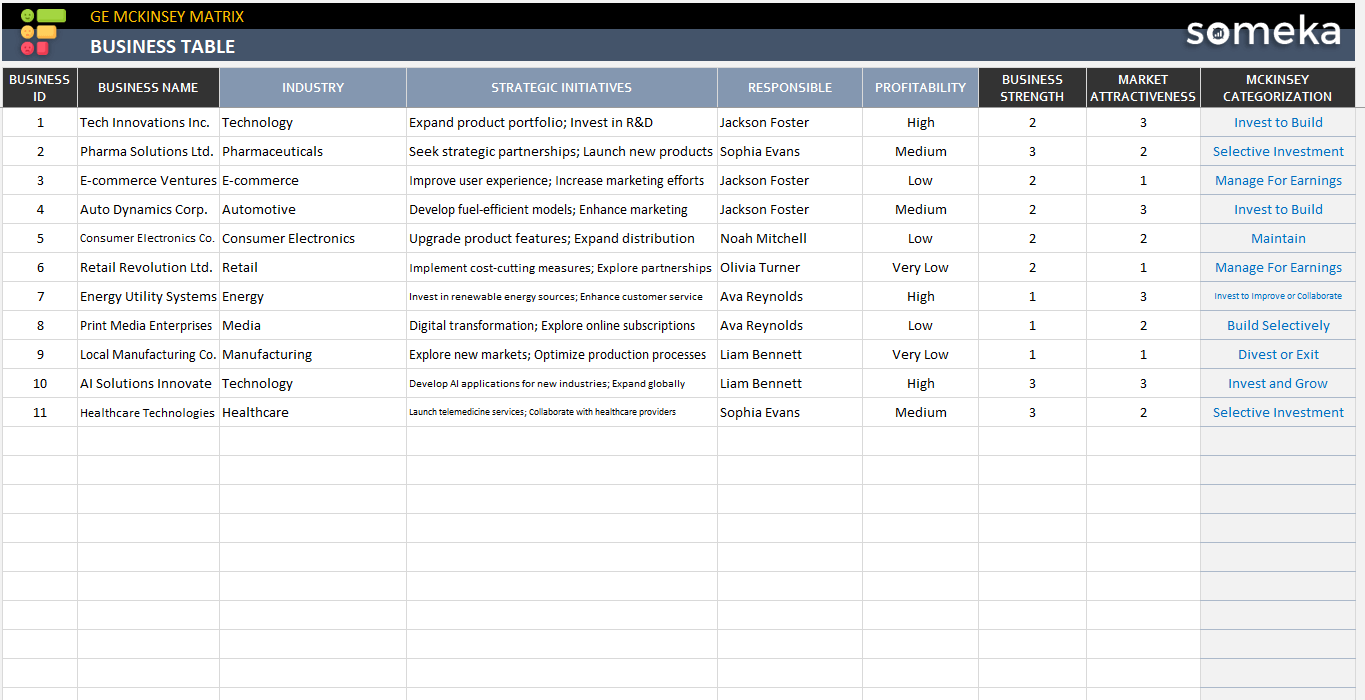
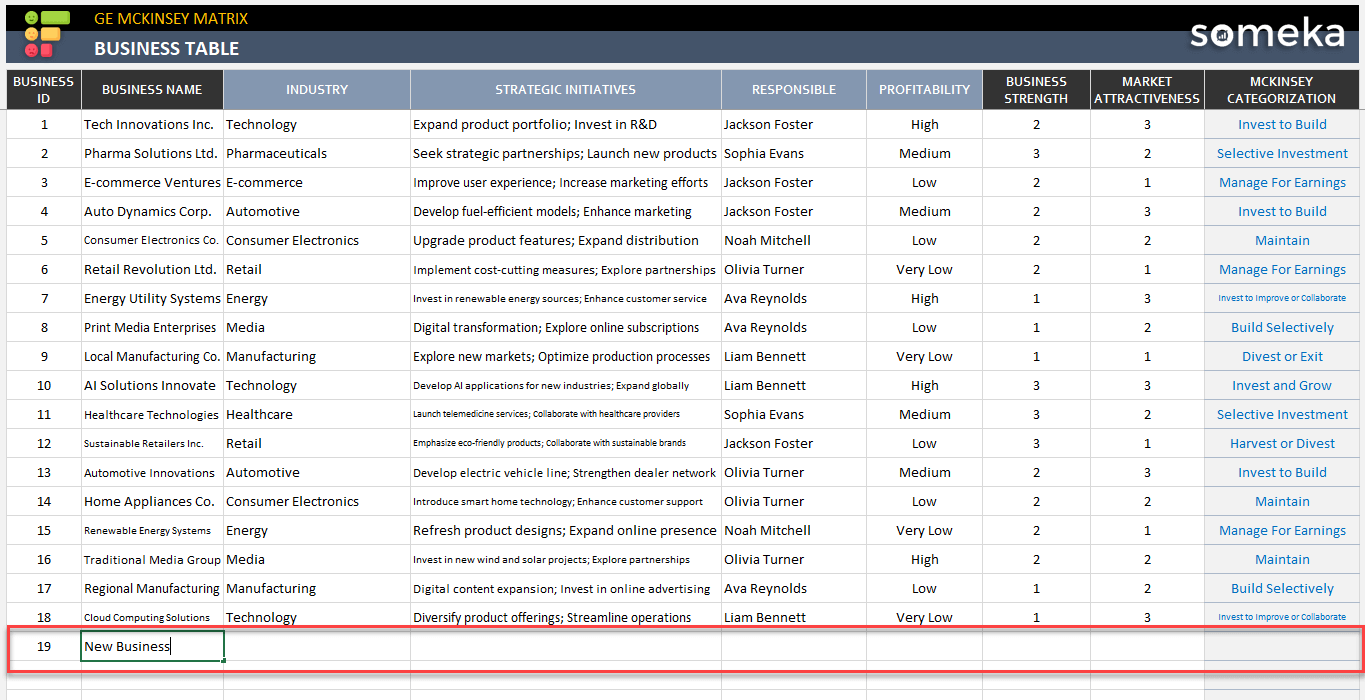
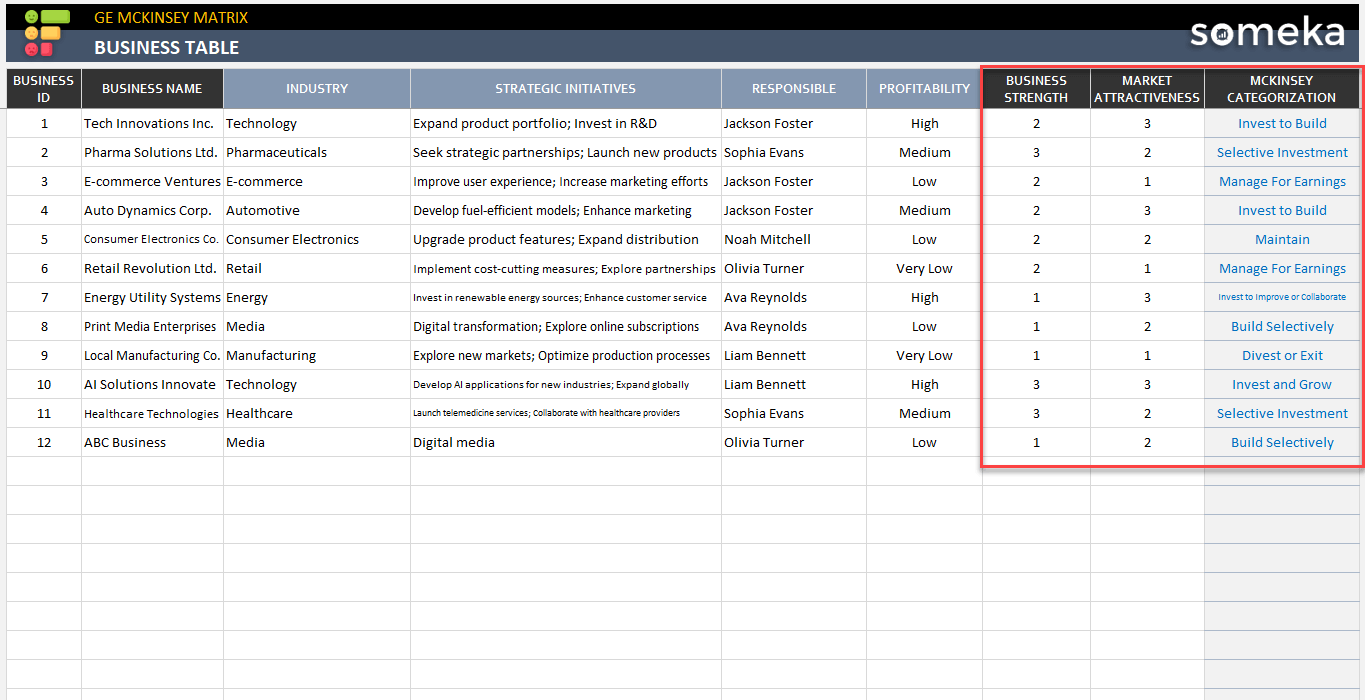
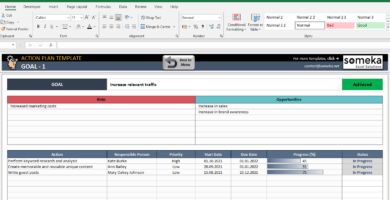
2. Business Table:
Firstly, this is the detailed data entry section for in-depth analysis of each business unit. You’ll have customizable fields to input vital statistics like business name, industry, responsible person, profitability level.
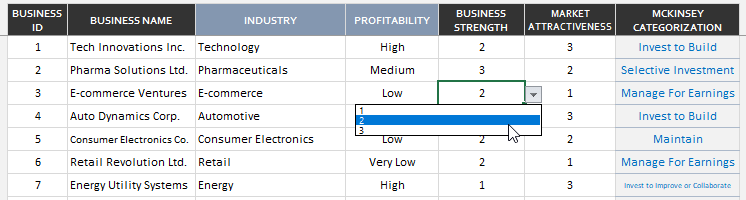
Here’s also where you’ll make your ratings for the business prospects to form your ge-mckinsey matrix.
There’re dropdown menus with numbers 1-3 to rate each business units.
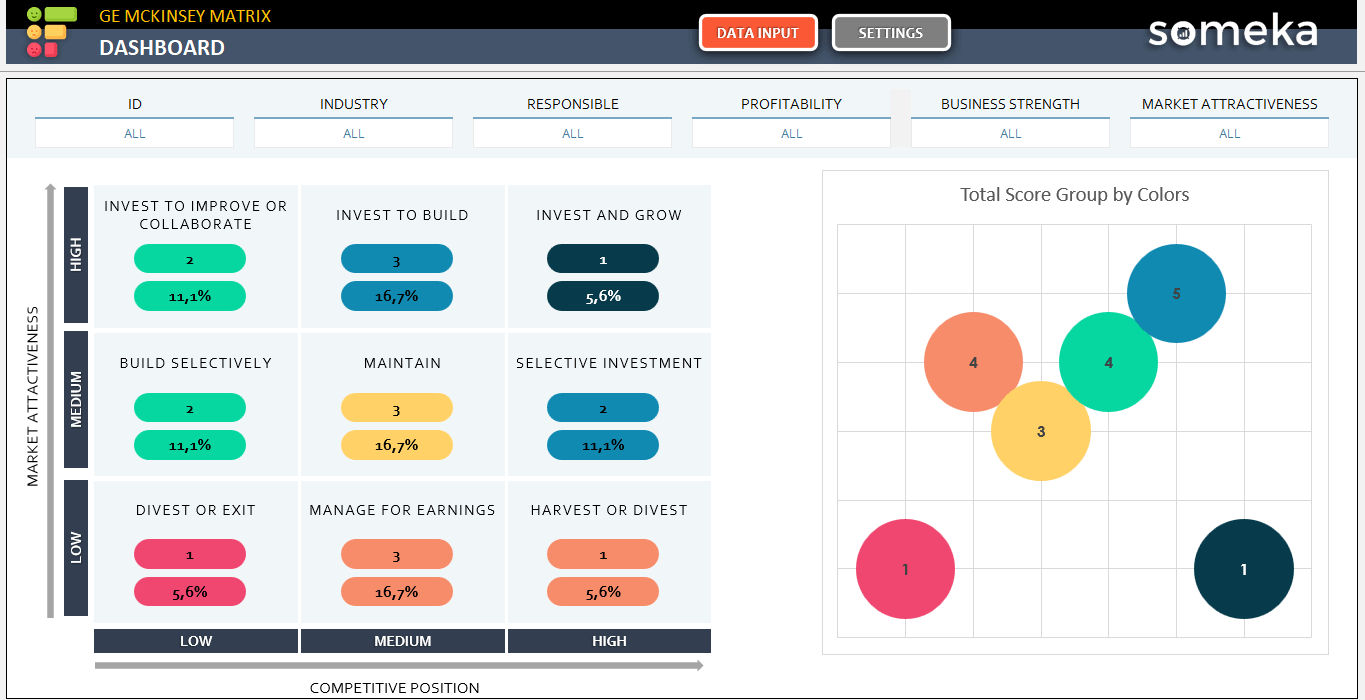
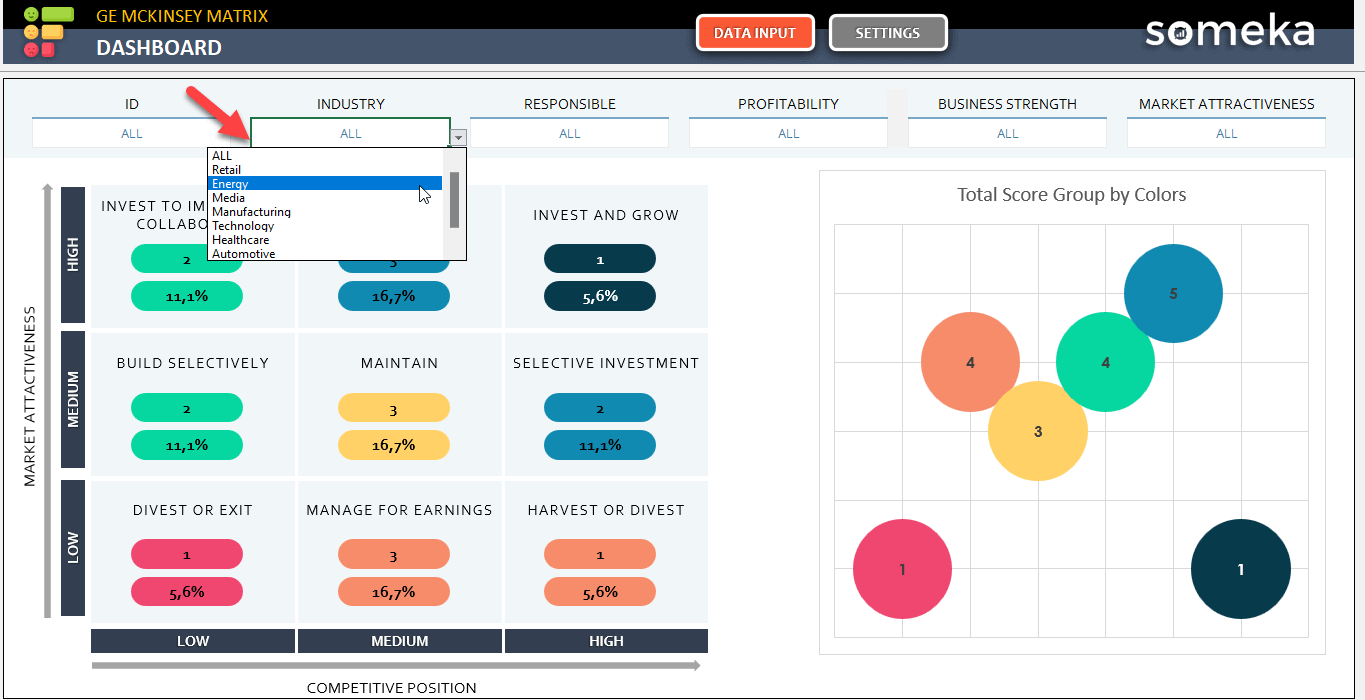
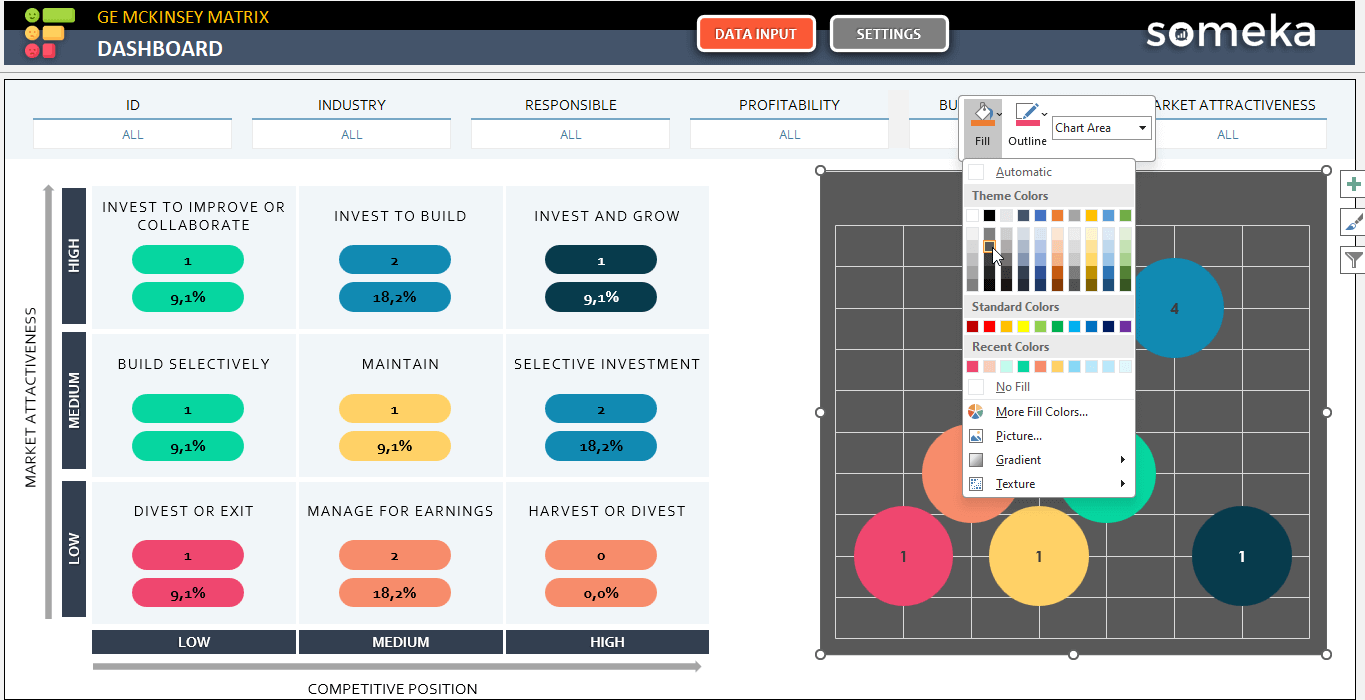
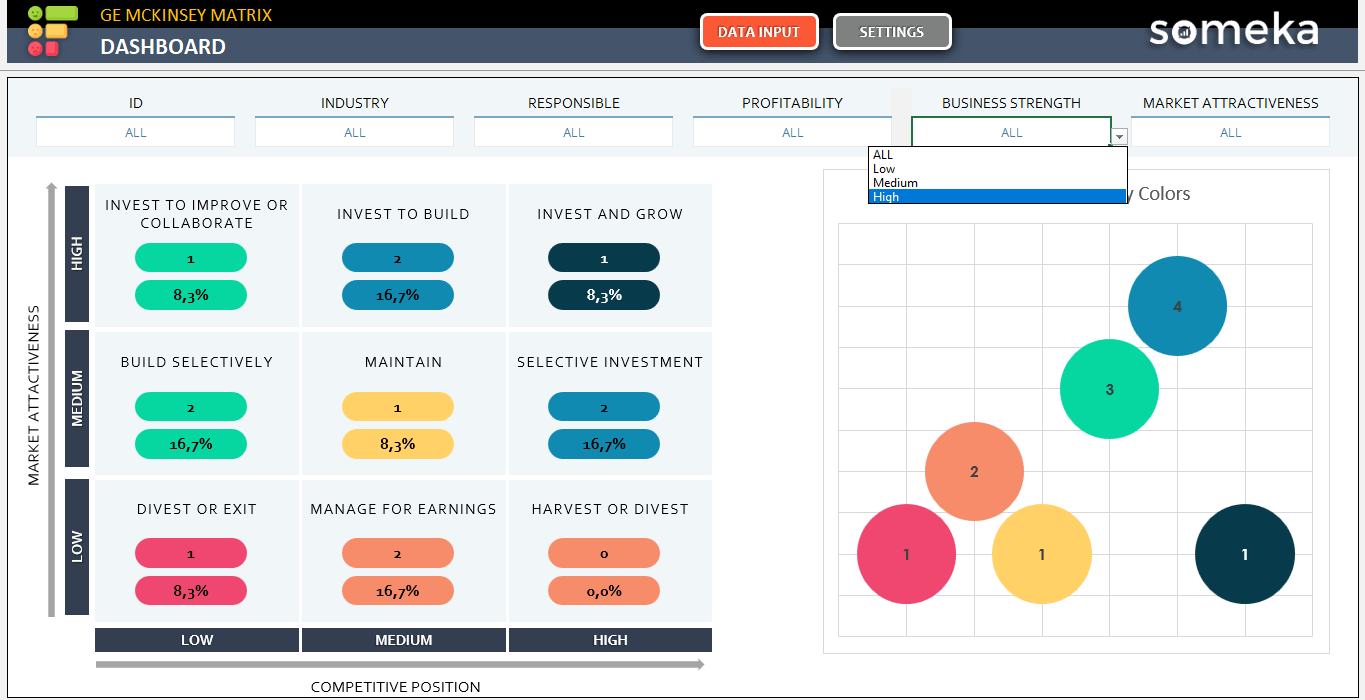
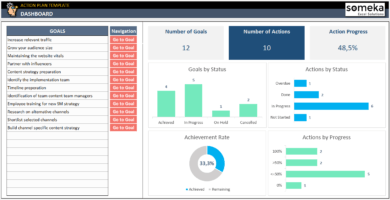
3. Dashboard:
This page will provide you with a high-level overview of your portfolio analysis with our interactive dashboard.
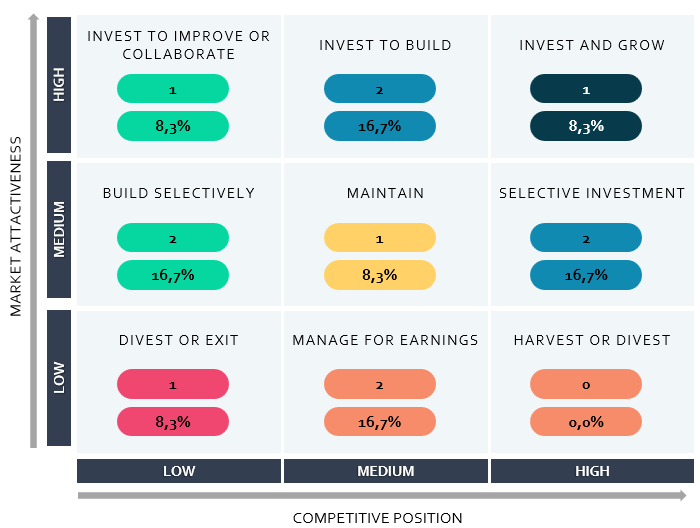
You can visualize key metrics at a glance, enabling quick and informed strategic decisions. And the filters above will help you make a detailed analysis.
Also, the colorful boxes on this matrix are all clickable buttons, which navigate you to the relevant section of your investment category list.
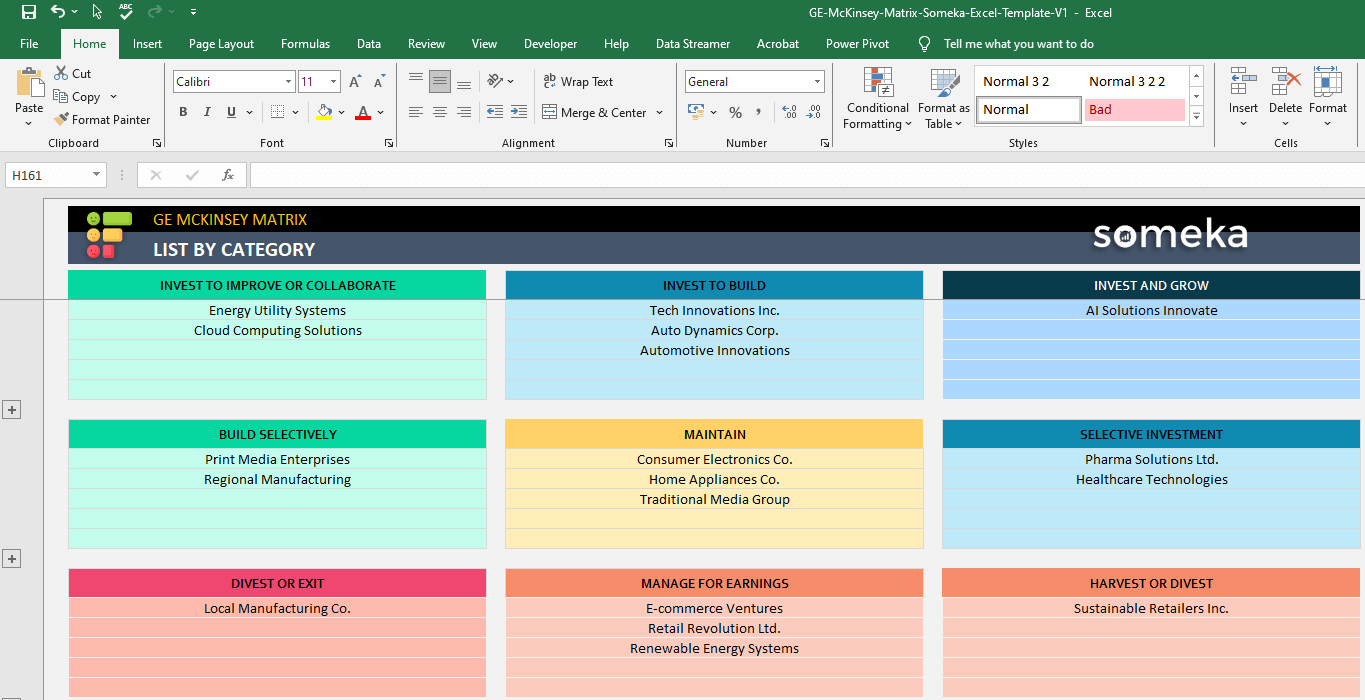
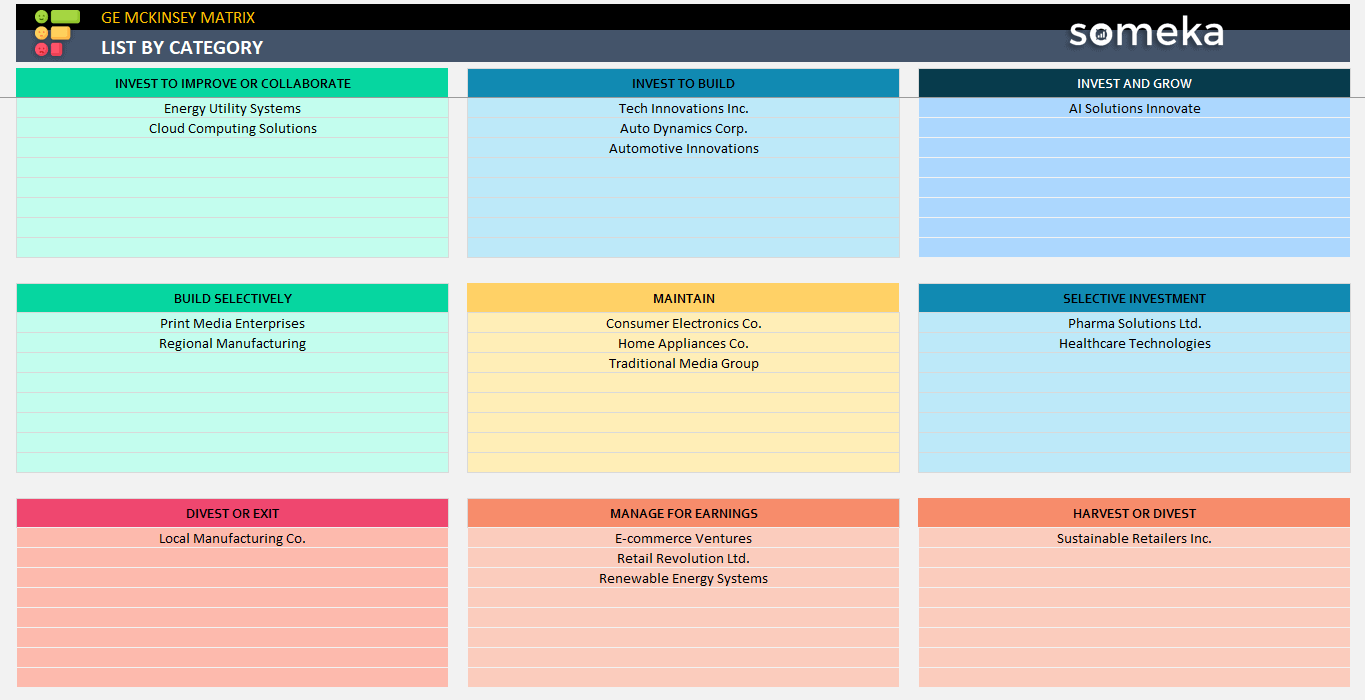
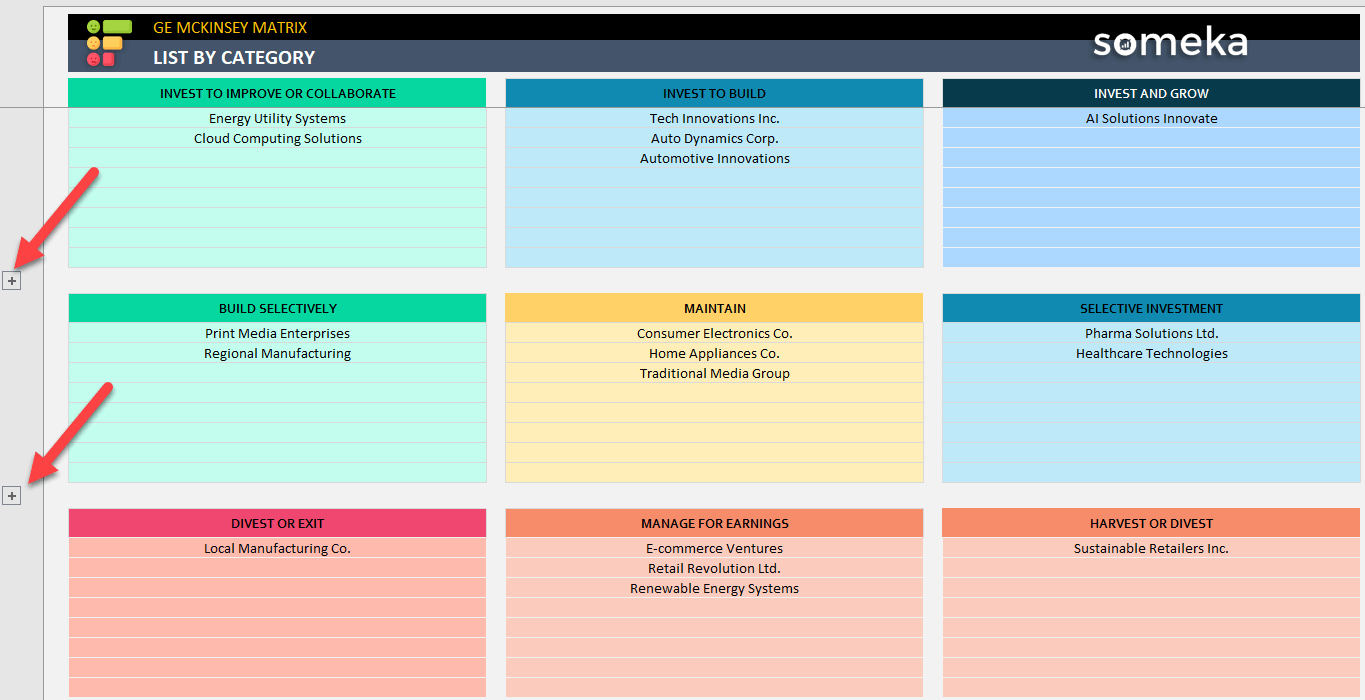
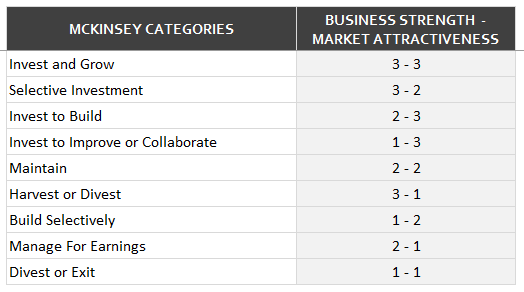
4. Category List:
You’ll find pre-defined categories based on market attractiveness and business strength. So this section facilitates an easy classification for you.
You can modify or add categories to tailor the analysis to your specific industry needs. Also colorful ge/mckinsey nine box matrix will be a perfect fit for your presentations for investor candidates.
GE McKinsey Matrix Template Features Summary:
- Growth matrix template
- Evaluate your investment prospects
- Printable and editable charts
- Sleek-design layout
- Instant Download Excel file
- Ready-to-use
- No VBA or Macro codes
- Compatible with Excel 2010 and later versions
- Works both on Mac and Windows
PRODUCT VIDEO
Watch the video below to see the template in action! Presentation also includes usage notes, explanations and tips & tricks about the template.
USER REVIEWS & COMMENTS
2 reviews for GE McKinsey Matrix Excel Template
You must be logged in to post a review.
RELATED TEMPLATES
-
 This product has multiple variants. The options may be chosen on the product page
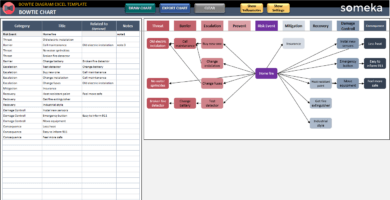
Bowtie Diagram Excel Template
$0.00 – $69.95Bowtie analysis tool in Excel. Visualize your risk pathways in a clean cause & consequence diagram. Fully printable with various color options.
-
This product has multiple variants. The options may be chosen on the product page
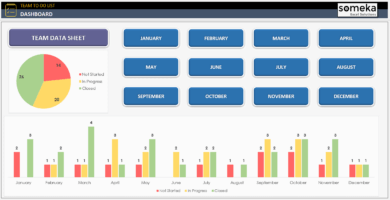
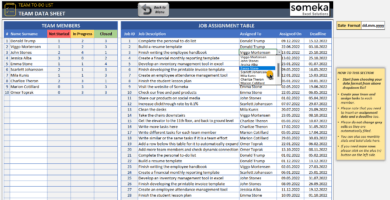
Team To Do List Excel Template
$0.00 – $69.95Excel Team To Do List Template is designed for task management and tracking of employees. Summary dashboard with charts. Editable & printable.
-
This product has multiple variants. The options may be chosen on the product page
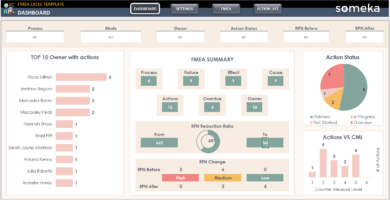
FMEA Excel Template
$0.00 – $69.95Risk analysis tool in Excel. Detect failure modes and plan preventive actions with FMEA model. Dynamic dashboard included. All print-ready.
-
This product has multiple variants. The options may be chosen on the product page
Action Plan Excel Template
$0.00 – $59.95Action Plan Template to organize and track targets in Excel. Input your goals and actions, and measure status and progress. Visual charts are included.
-
This product has multiple variants. The options may be chosen on the product page
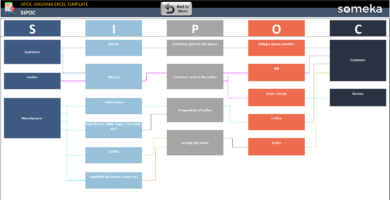
SIPOC Diagram Excel Template
$0.00 – $69.95SIPOC Diagram generator in Excel. Create a high level process map and increase transparency. No installation needed. Ready to use.
-
This product has multiple variants. The options may be chosen on the product page
Hotel Feasibility Study Excel Template
$0.00 – $199.95Hotel Financial Model Excel Template will allow investors or business owners to make financial projections and decide on their investment projects.

Nannie W. Russell –
I definitely like it! But I’m not sure how to change the logo.
Someka –
The full versions are sent with a password, which you can find in your product’s zip file. Once you unlock your template, you can easily change the logo and make other necessary modifications. For more info please check: someka.net/blog/unlock-sheets/ and someka.net/blog/removing-logo/
Ethan M. –
Hi there, I downloaded the trial version but can’t be sure about the max input number of the template. Can I check how many items I can list?
Someka –
Thank you for your interest in our template. You can list up to 500 items in the Business Table sheet. Additionally, you can define 20 industries, 20 responsible parties, and 20 profitability states through the settings page.