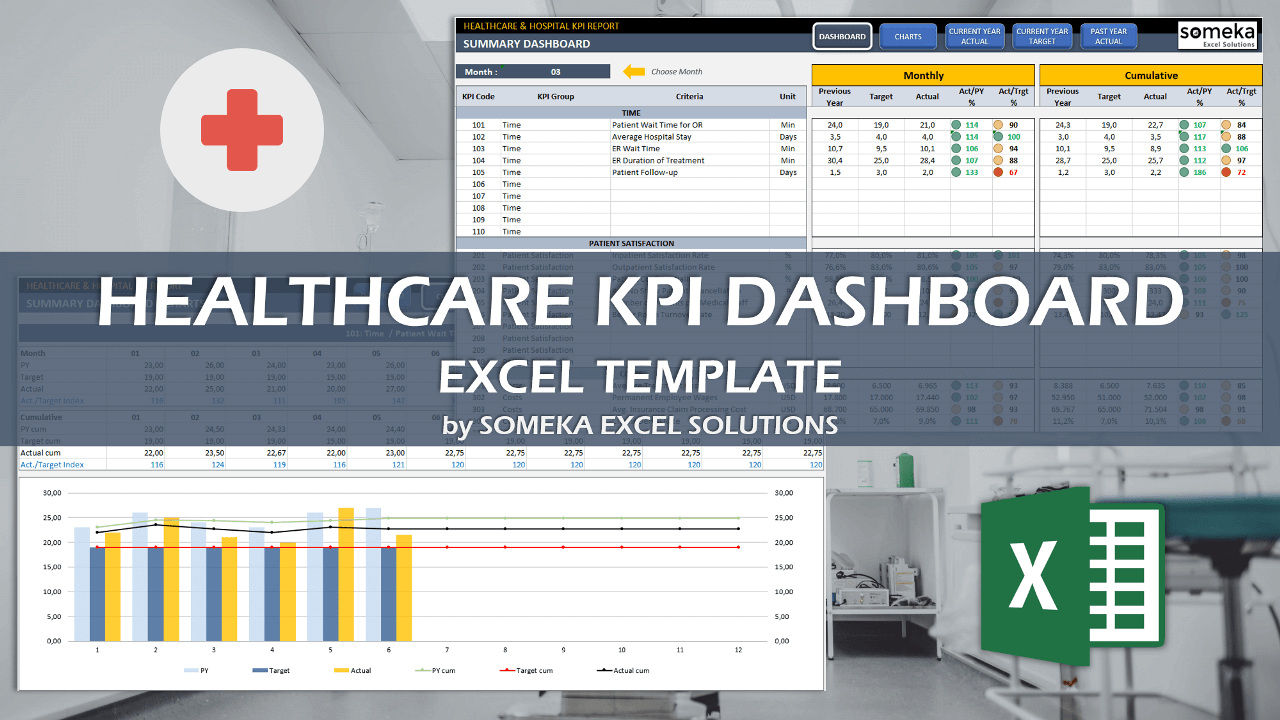
Healthcare KPI Dashboard Excel Template
Excel spreadsheet to track hospital KPIs. Printable dashboard with monthly and cumulative trend analysis. No installation needed. Ready to use.
TEMPLATE DESCRIPTION
Are you in the healthcare industry? And, do you want to track your key performance metrics? Then, this Healthcare KPI Dashboard Excel Template will help you to track what is missing and needs to be improved for measuring patient satisfaction.
In general, by researching some of the most important KPIs, there are 23 commonly used Healthcare KPI Metrics in Excel under 5 categories:
Then, let’s dive into each of them!
Healthcare KPI Dashboard Excel Template Features:
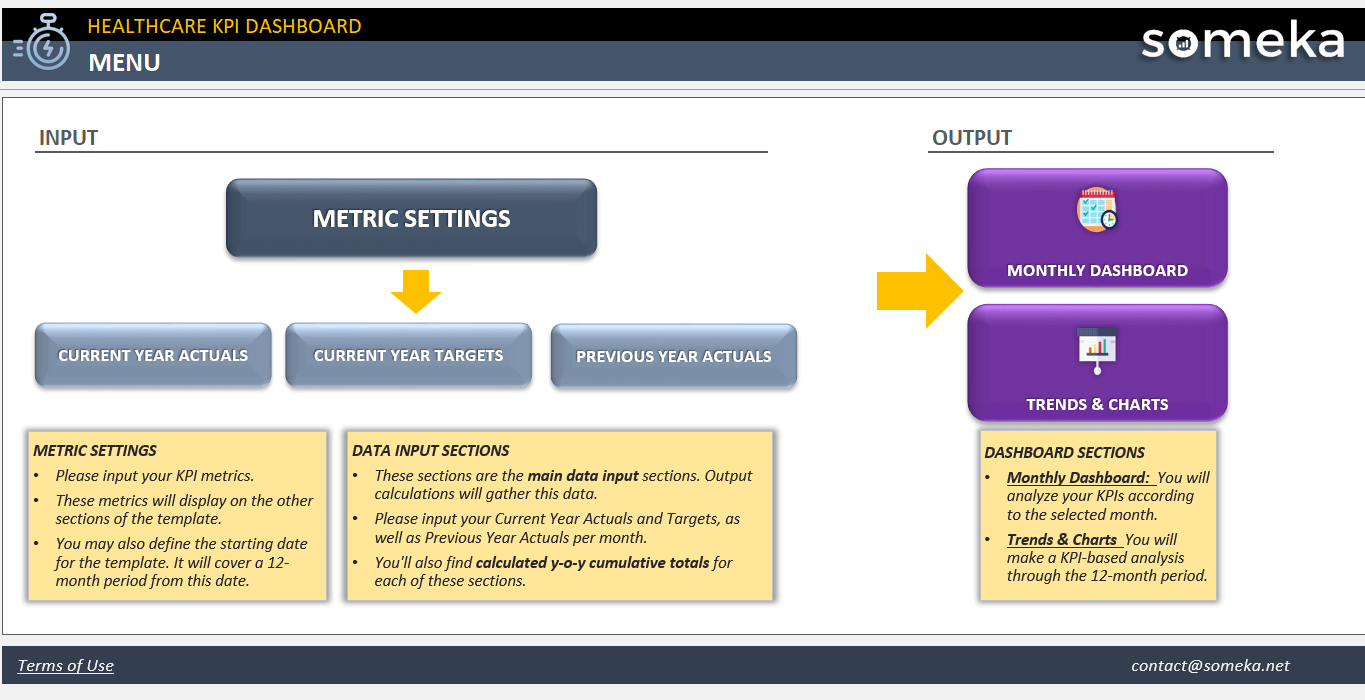
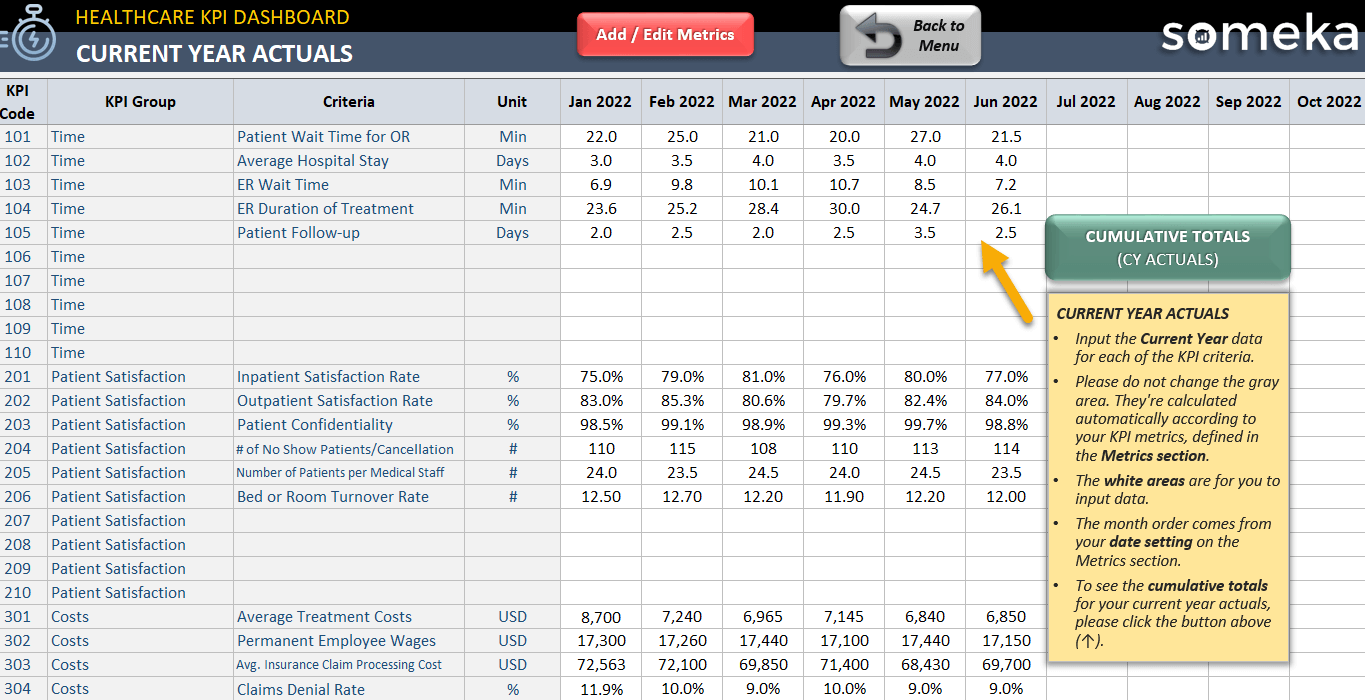
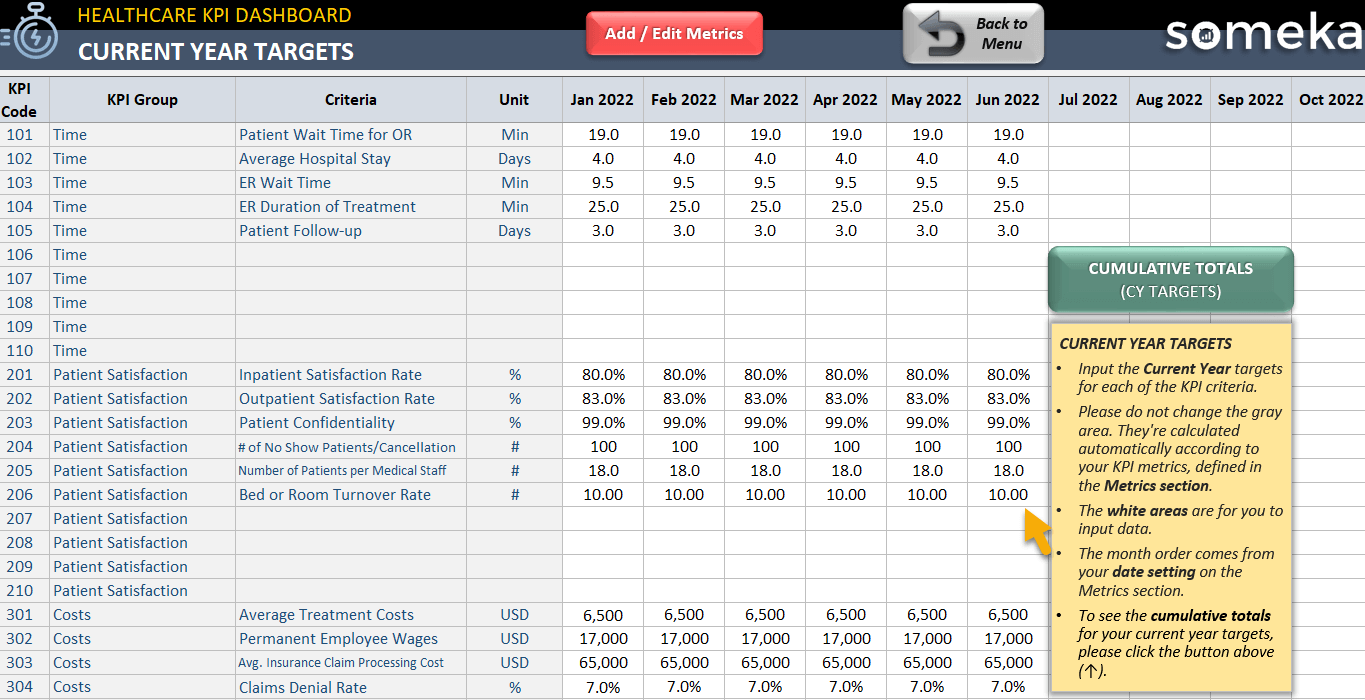
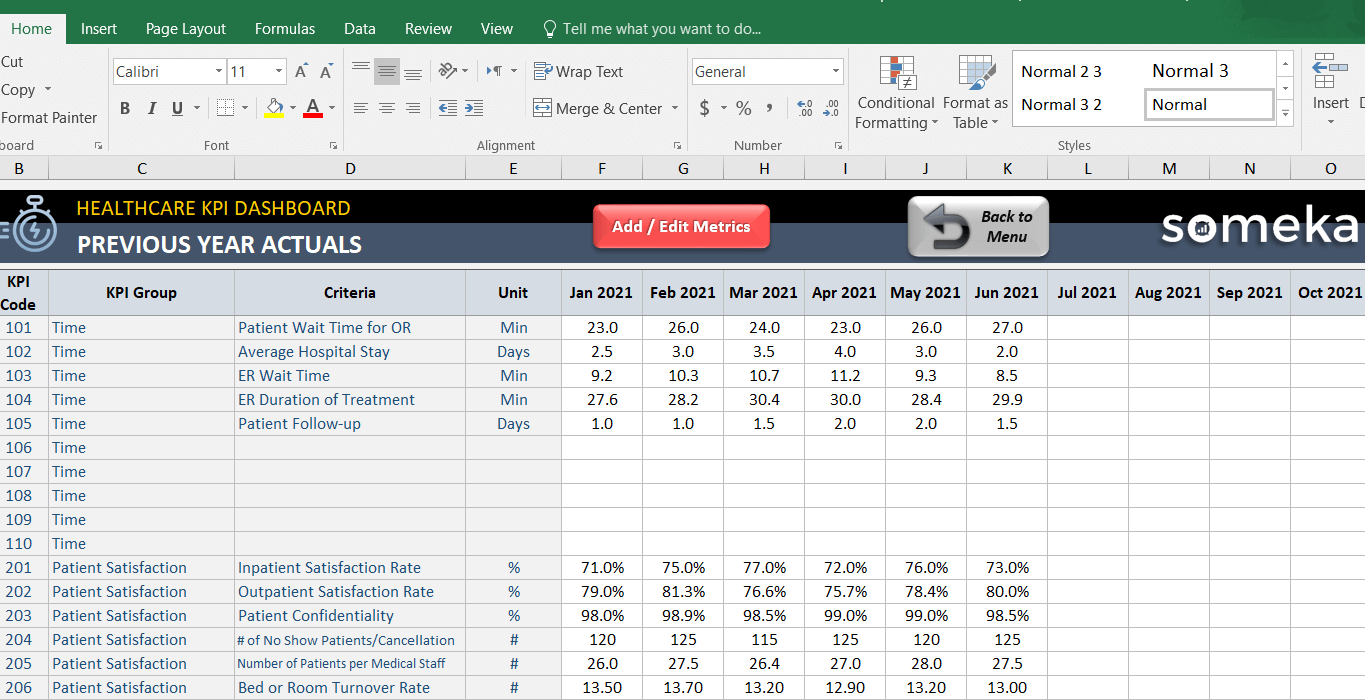
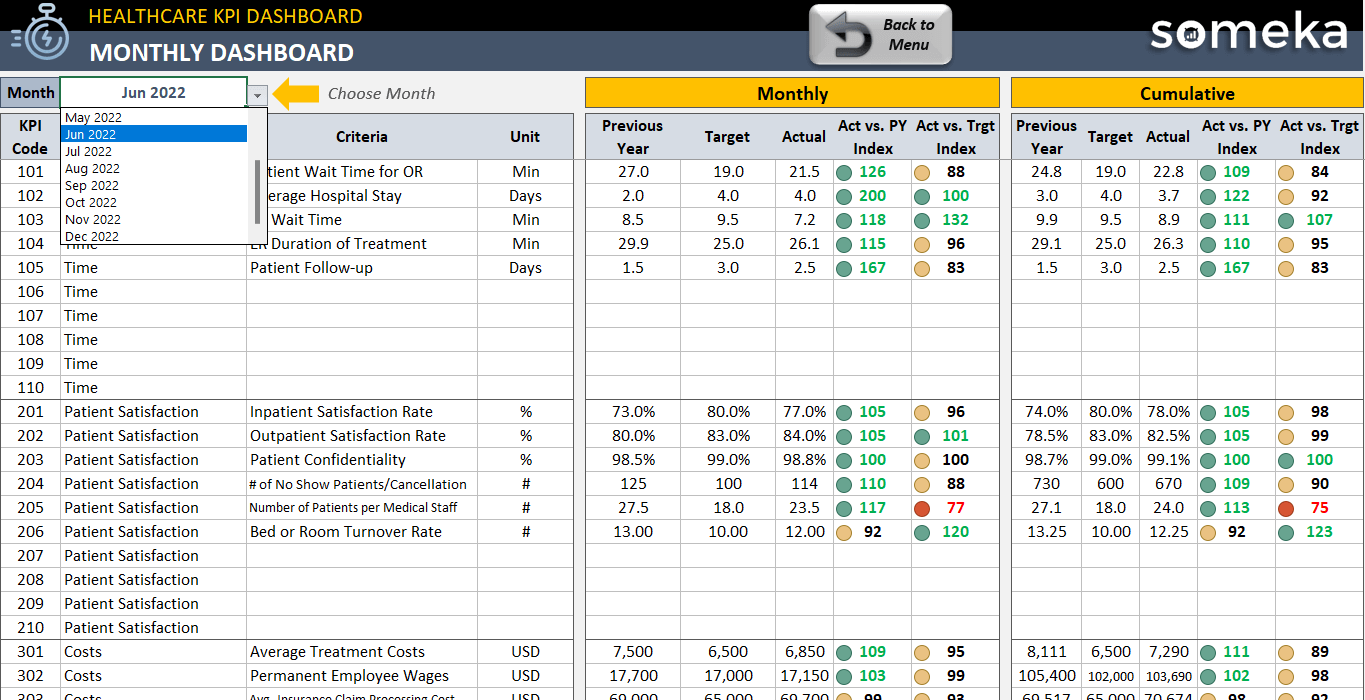
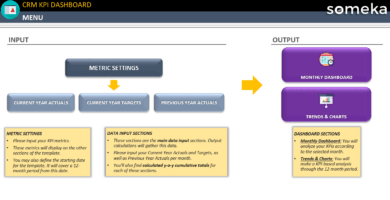
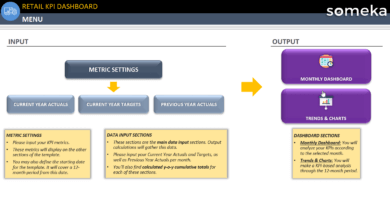
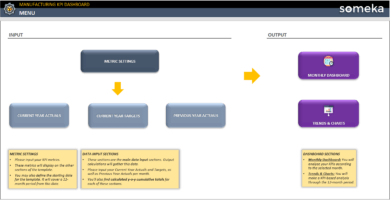
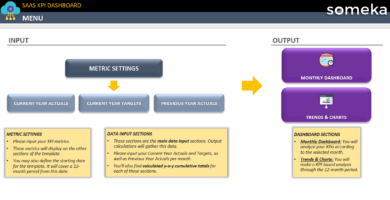
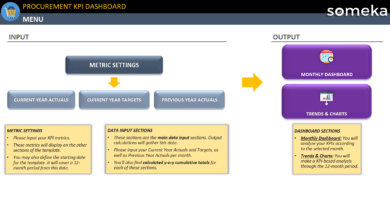
Firstly, the navigation menu enables you to switch between other worksheets and the last three buttons stand for Current Year Actual, Current Year Target, and Past Year Actual which you can input your values manually in this Excel Template.
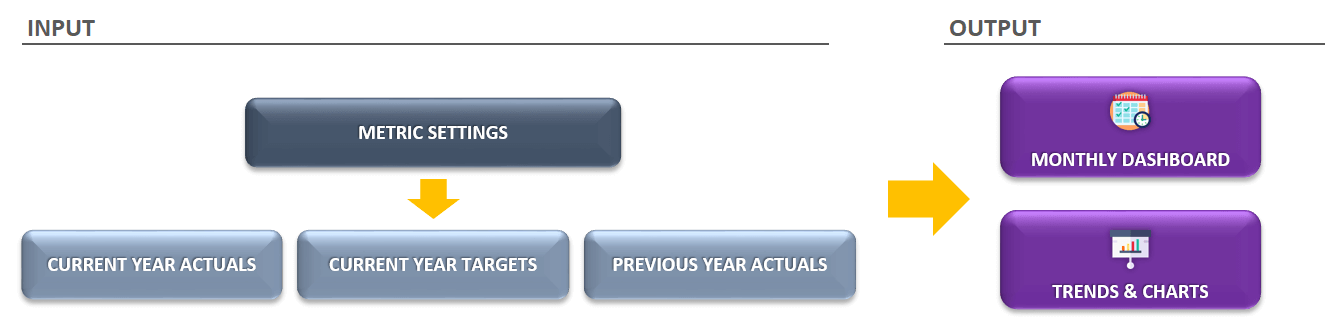

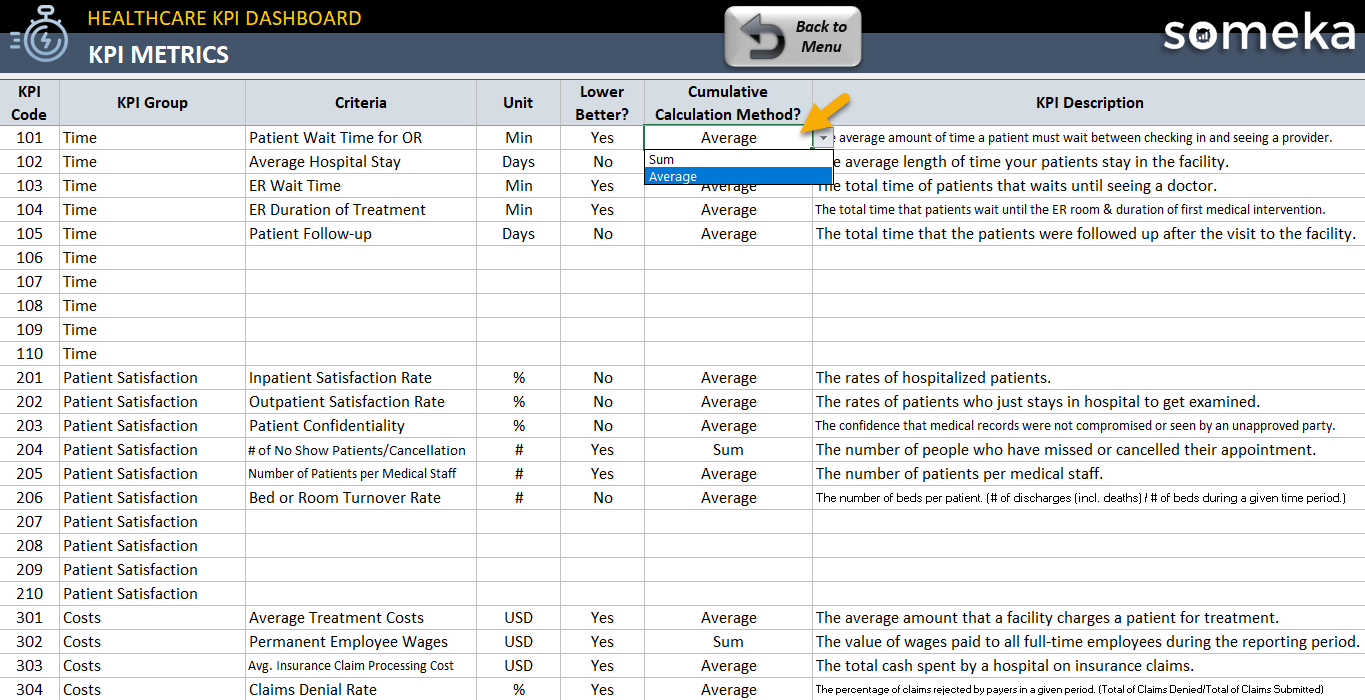
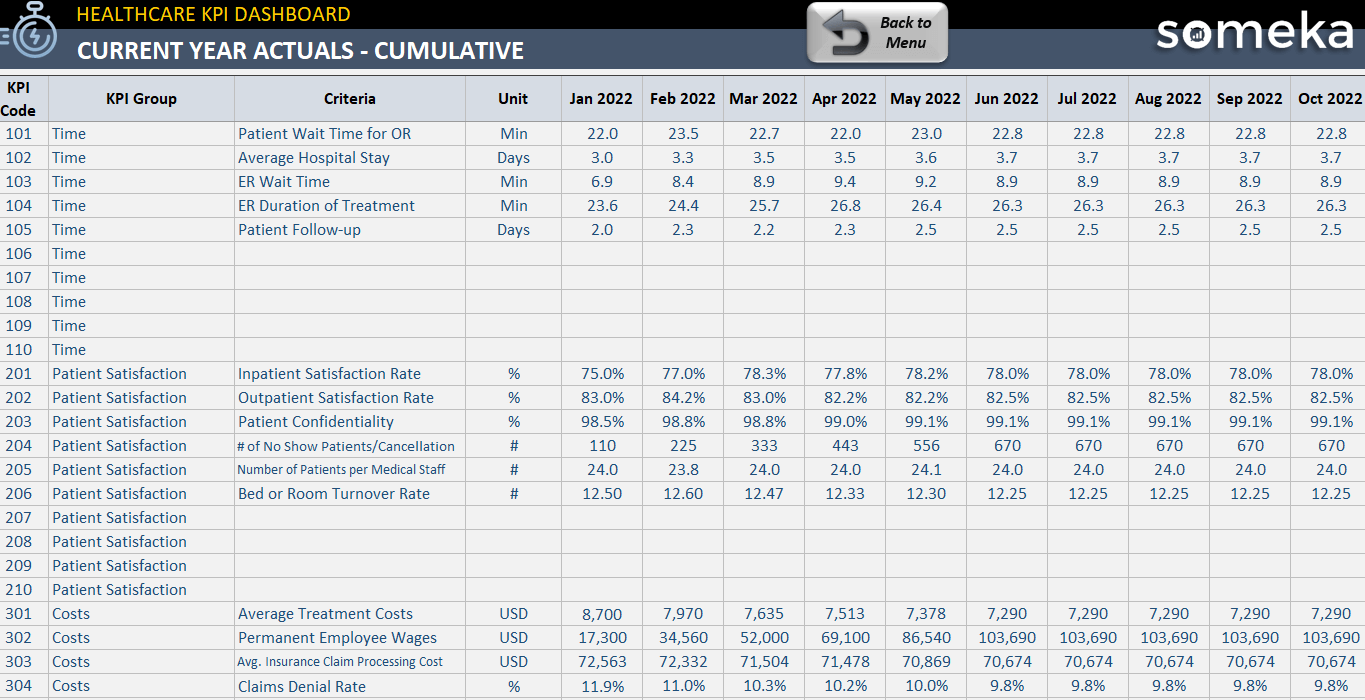
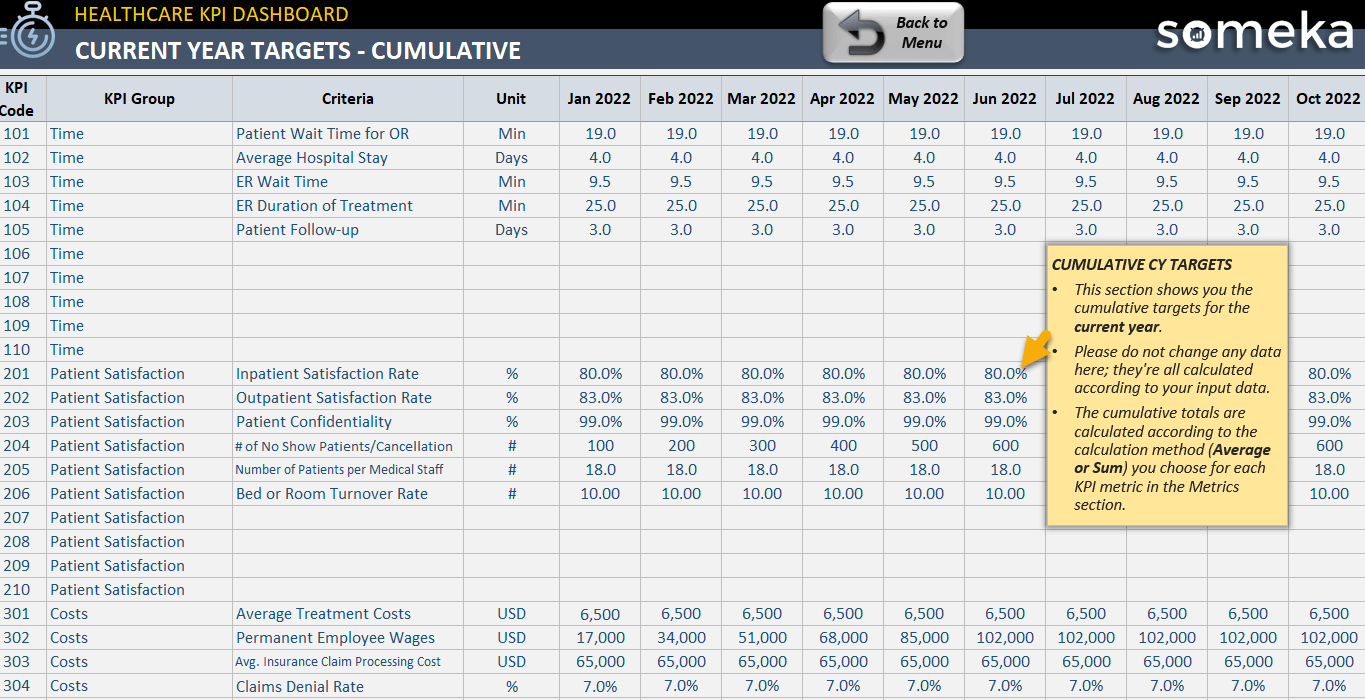
Moreover, the Cumulative Calculation method, as well as the Lower is a Better option, are available to the user. Meanwhile, the Charts section will help you compare your data trends forming with the line chart. Furthermore, we aim to give you a clear visual representation of your hospital performance dashboard according to the selected metric.
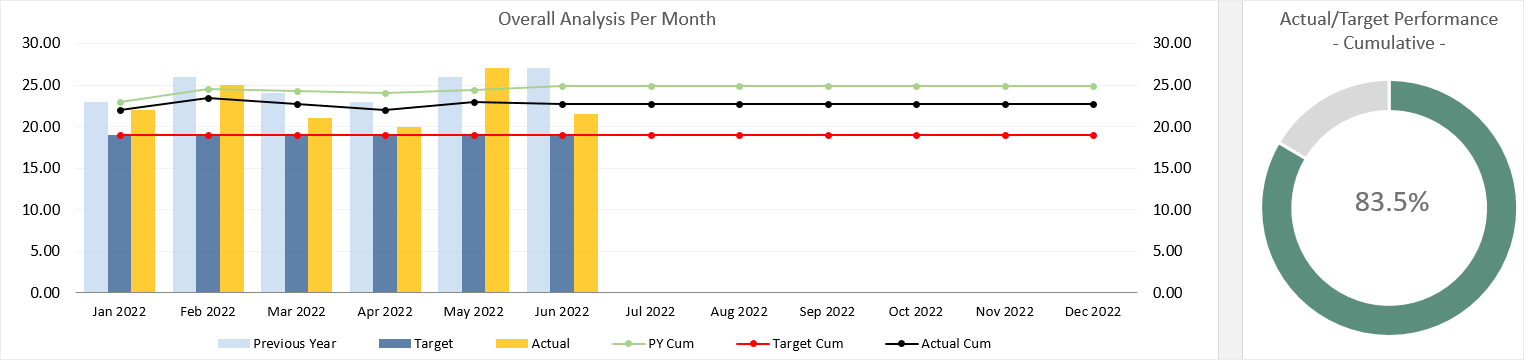
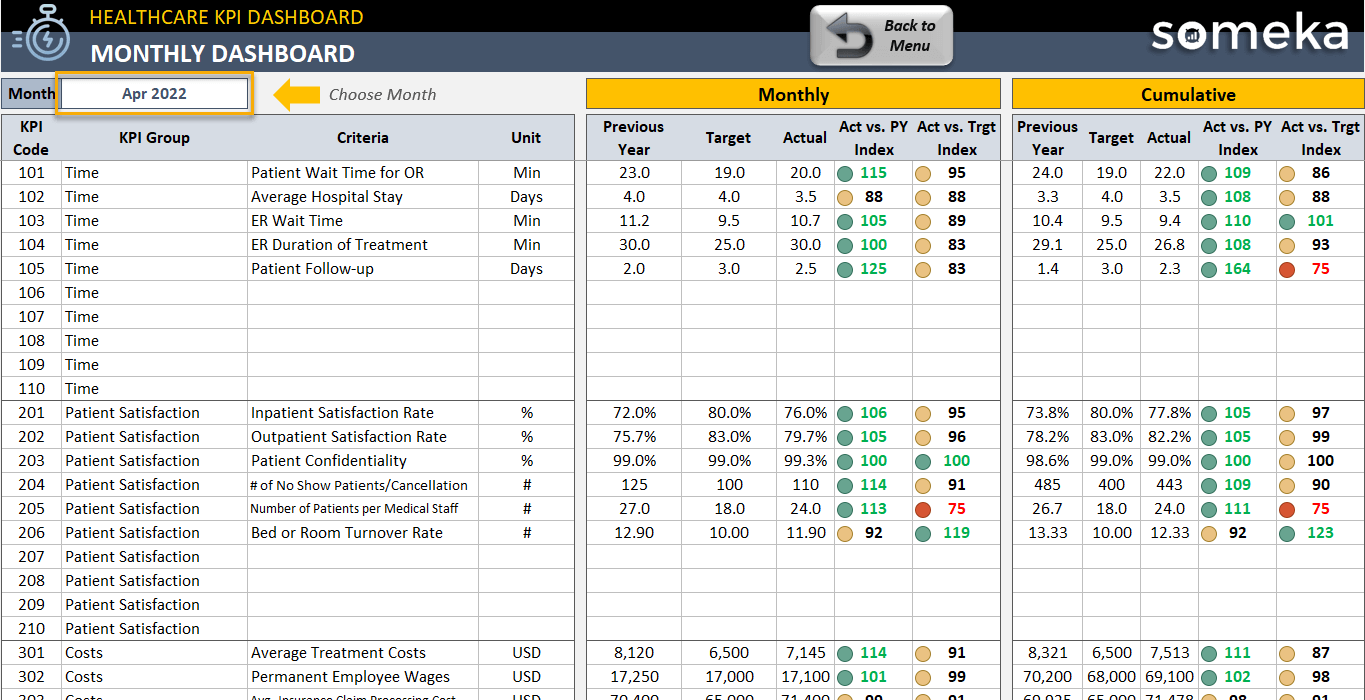
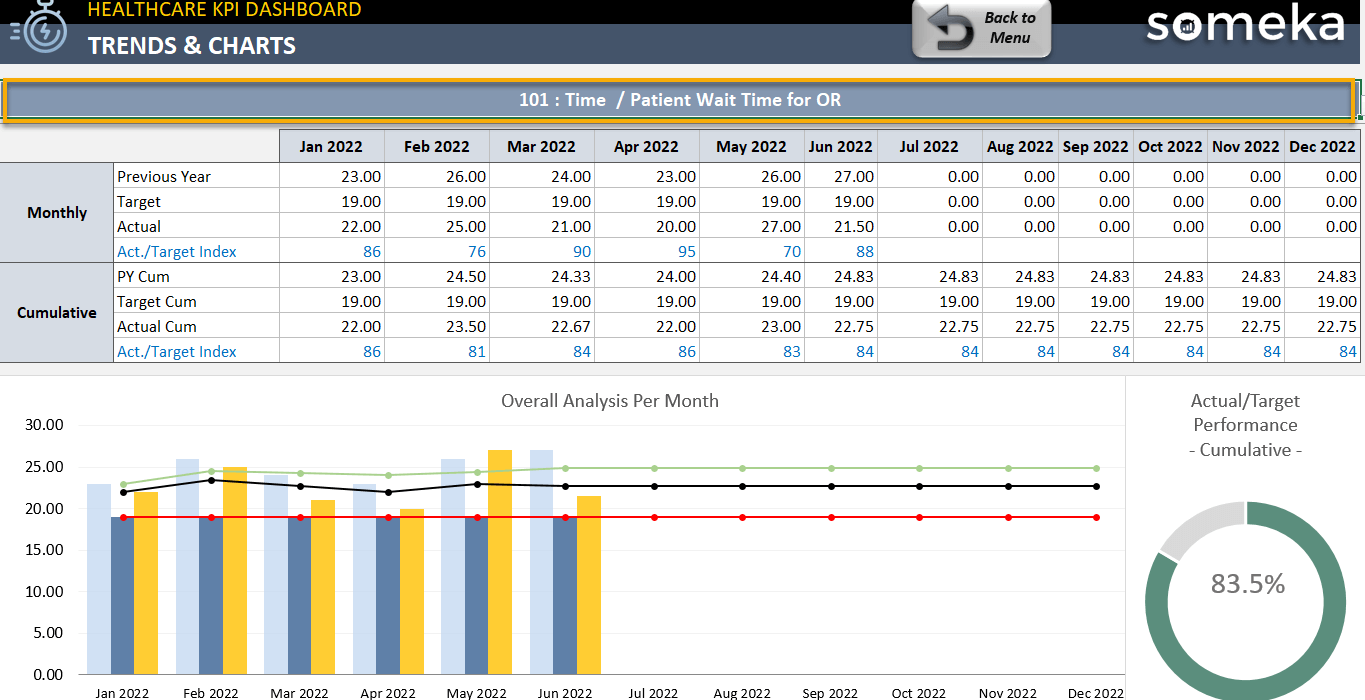
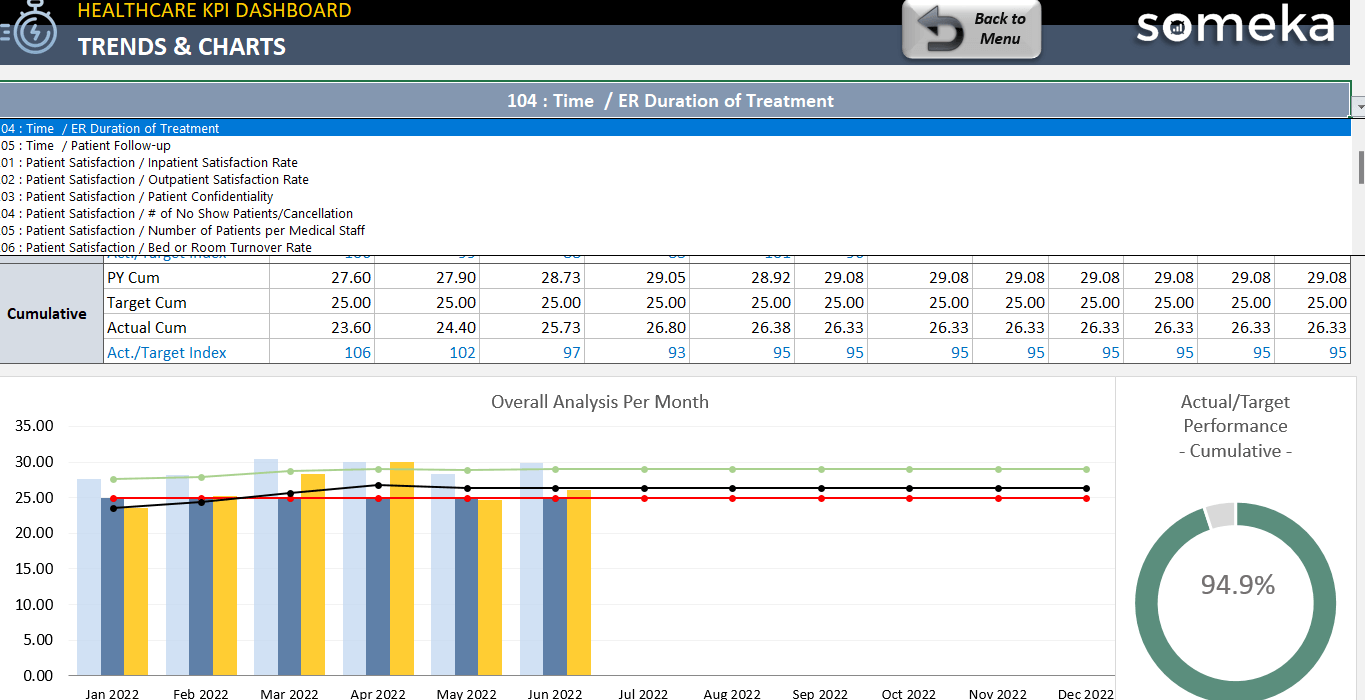
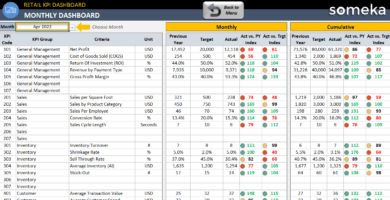
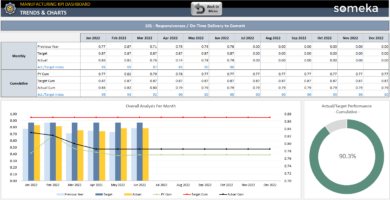
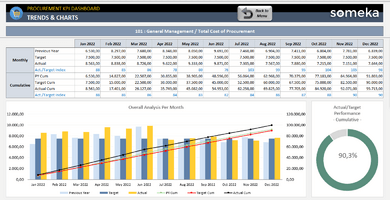
Trends and Charts:
It is possible to track monthly cumulative performance per KPI metric in this section. With a doughnut chart, you can also see cumulative performance against your target.
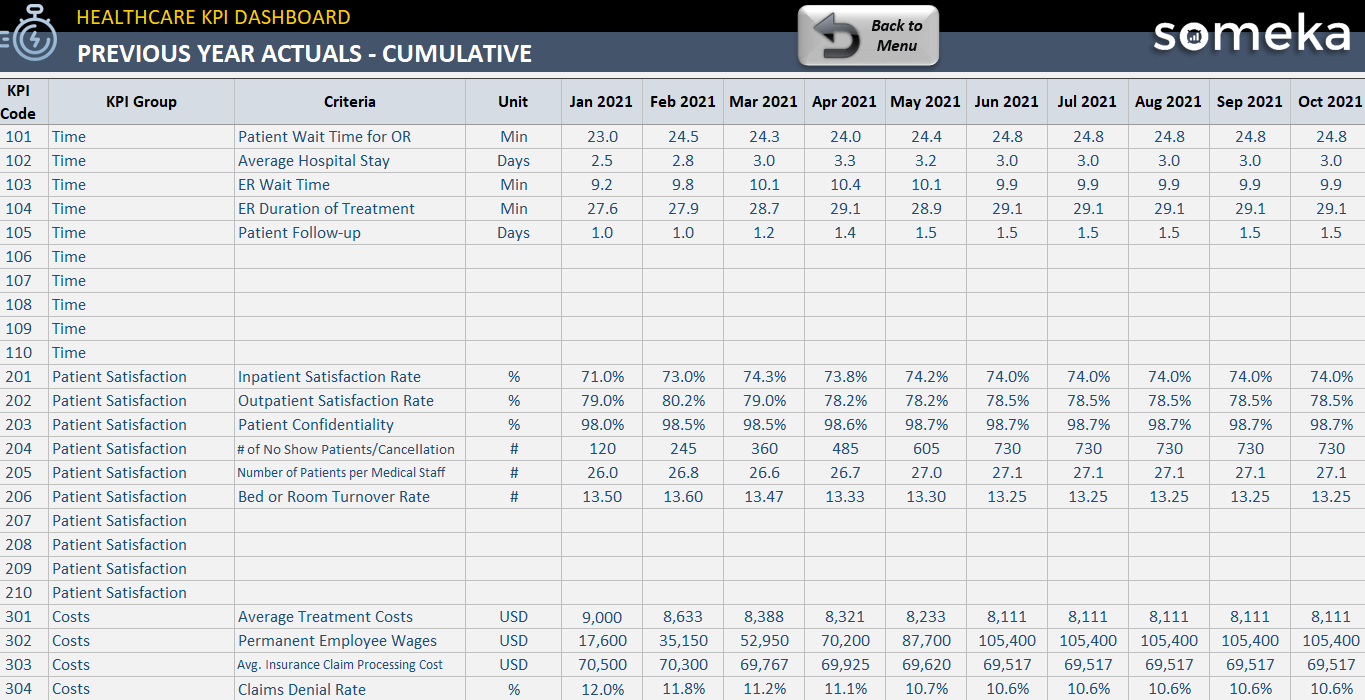
Detailed Description of Healthcare KPI Metrics in Excel Template:
 Time
Time
 Time
TimePatient Wait Time for OR: This metric indicates the average amount of time a patient must wait between after admission and seeing a medical staff.
Average Hospital Stay: The average time period that your patients stay in the medical center.
ER Wait Time: Indicates the total wait time of patients until seeing a doctor.
ER Duration of Treatment: Indicates the total wait time until patients get into the ER room (ER wait time) and the duration of the first medical intervention.
Patient Follow-up: Indicates how long the patients were followed up after their visit to the facility.
Basically, please remember that you can add new KPIs to your dashboard in this Excel template.
 Patient Satisfaction
 Patient Satisfaction
Inpatient Satisfaction Rate: Indicates the rates of hospitalized patients.
Outpatient Satisfaction Rate: Indicates the rates of patients who just stay in the hospital to get examined.
Patient Confidentiality: This is the patient’s confidence ratio that indicates their medical records will be private and not seen by third-party people/organizations.
# of No Show Patients/Cancellation: Indicates the number of people who have not been examined at the hospital, missed or canceled their appointment.
Number of Patients per Medical Staff: Indicates the number of patients per medical staff.
Bed or Room Turnover Rate: An indication of how many beds are available per patient in a hospital. As a result, the hospital bed turnover rate would be equal to the number of discharges (including deaths) in a given time period / the number of beds in the hospital during that time period.
 Costs
Costs
 Costs
CostsAverage Treatment Costs: The average amount that a facility charges a patient for treatment.
Permanent Employee Wages: The value of wages paid to all full-time employees during the reporting period.
Avg. Insurance Claim Processing Cost: The total cash spent by a hospital on insurance claims.
Claims Denial Rate: The percentage of claims rejected by payers in a given period. The formula stands for; Total of Claims Denied/Total of Claims Submitted.
Furthermore, this Excel template lets you add new metrics to your KPI dashboard.
 Hospital Success
 Hospital Success
Hospital Readmission Rate: This shows the number of patients returning to the facility because of incompetent practice.
Patient Safety: Indicates the percentage of patients being safe in the hospital.
A number of Referral Patients: The number of patients referred to different departments.
Medication Error Rate: The percentage of wrong treatment to patients.
Mortality/Death Ratio: The percentage of dead patients. Thus, the formula stands for; The total number of patient death in the facility/(Total number of patients discharged+ Total number of dead patients) *100.
 Hospital Capacity/Properties
 Hospital Capacity/Properties
Bed Occupancy Rate: The proportion of hospital beds in use at any time. So, you can use this formula to calculate it; (utilized bed-days x 100)/available bed-days during the calendar year.
Number of Training for Employees: It shows the total number of training for employees in a facility.
The number of Media Mentions: The total number of news related to the facility.
Lastly, you can add new metrics or change the existing ones in this KPI dashboard template.
You should always track your KPI and also OKR (Objectives and Key Results) metrics for a sustainable healthcare business.
Healthcare KPI Dashboard Excel Template Features Summary:
-
- Both Periodic and Accumulative analysis
- 23 Most-Used Healthcare & Hospital KPI Metrics
- Both Past year and Target Values Comparisons
- Overview dashboard with visual charts as well
- A simple design for presentations
- Straightforward on-sheet directives
- Excel 2010 and later versions compatibility
- Windows and Mac Compatible
- No download/installation is required.
- Print-ready
- No Visual Basic for Applications (VBA) Macros
EXCEL KPI DASHBOARDS COLLECTION
PRODUCT VIDEO
Watch the video below to see the template in action! Presentation also includes usage notes, explanations and tips & tricks about the template.
USER REVIEWS & COMMENTS
7 reviews for Healthcare KPI Dashboard Excel Template
You must be logged in to post a review.
RELATED TEMPLATES
-
 This product has multiple variants. The options may be chosen on the product page
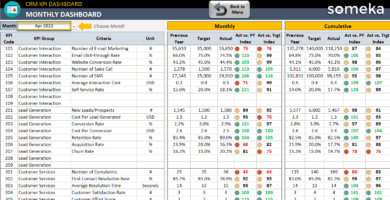
CRM KPI Dashboard Excel Template
$0.00 – $79.95KPI spreadsheet for customer relations. Track your key metrics with monthly and cumulative analysis. Printable dashboard with charts. All in Excel.
-
This product has multiple variants. The options may be chosen on the product page
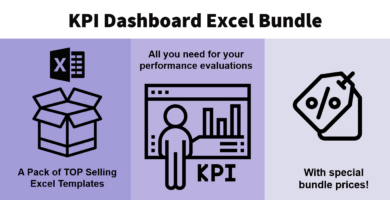
KPI Dashboard Excel Templates Bundle
$199.95 – $399.95Bundle pack for KPI Dashboard templates in Excel. Top selling KPI tools. All uniquely designed, printable, professional spreadsheets. Ready for use.
-
This product has multiple variants. The options may be chosen on the product page
Retail KPI Dashboard Excel Template
$0.00 – $79.95Excel KPI tracker for retail stores. Most used metrics for retail managers. Printable dashboard with cumulative analysis. Ready to use.
-
This product has multiple variants. The options may be chosen on the product page
Manufacturing KPI Dashboard Excel Template
$0.00 – $79.95Manufacturing KPI Dashboard Template in Excel. Includes most used key metrics for production with trending charts, contrast analysis and much more.
-
This product has multiple variants. The options may be chosen on the product page
SaaS KPI Dashboard Excel Template
$0.00 – $79.95Excel KPI tracker for software business. Track your key metrics with monthly and cumulative analysis. Printable, dynamic and nice-looking dashboard.
-
This product has multiple variants. The options may be chosen on the product page
Procurement KPI Dashboard Excel Template
$0.00 – $79.95Excel spreadsheet for procurement metrics. Track your purchasing KPIs with monthly and cumulative analysis. Printable dashboard with on sheet guide.
Foster Hershey –
I had just purchased the dashboard, but how can i use it for multiple areas?
i have 3 wards and an outpatient department and an ICU.
i want it on one dashboard. if i click on ICU, i can see icu data, etc.
I also want to compare data between the areas.
Someka –
Hi Foster,
Healthcare KPI Dashboard is designed to give a general overview of the whole organization.
You may use different files for each of your areas, but if you want to compare the results of each area you need comprehensive customization on the template.
You may self-customize our products after purchasing. But if you need professional assistance for modifications, we recommend you to visit our trusted development partner Excel Rescue’s page from the link below:
https://www.someka.net/custom-services/
After you submit your task, the Excel Rescue team will contact you with an anticipated duration and price quote.
Should you have any questions from our end, please do not hesitate to contact us.
Patty –
thanks guys for support and this excel. It works well. We want to change chart type can yu please help us about his issue? Is there any option for this? we could not found
Someka –
Hello Patty,
Thanks for your interest in our KPI Dashboard Templates!
Regarding the question you asked, as default, we do not add a feature to change chart type but you can do that using the Excel function easily.
Just select the chart -> Go to Design Tab-> Click Change Chart Type. You will see all available charts for the data we’ve visualized and change the chart design as you see fit!
Hope this helps! Otherwise please do not hesitate to contact us with any of your questions.
Silvester –
GREAT
George –
I checked all of the KPI Dashboards you have it looks professional and well designed. Congrats. Do you perhaps have a training KPI template? Or are you planning to prepare?
Someka –
Hi George,
Thank you for your kind words and valuable comment! In fact, we currently don’t have a training kit for our KPI templates, but we can consider bringing this up. Thank you for giving us an idea!
For now, we have a product video to show how you can use the template and all the features. Please click the video section above to watch!
Best wishes,
Del –
I have just purchased HealthCare KPI Dashboard (SU). Purchased was on 12-10-2020. I cannot find any type of tutorial on how the functions of each item works, this is worthless with out you teaching me how to operate its functions. Please tell me were I can get the instructions. Del
Someka –
Hi Del,
Thanks a lot for your interest!
Did you have a look at the product video?: Healthcare KPI Template video
We have prepared it for explaining all the features of the template. Additionally, there is a help sheet inside the template that we explained all the KPI metrics in detail. You can also have a look at it as well.
For further questions please do not hesitate to contact us!
Del –
Thank you for your assistance in educating me with tutorials to learn how I can operate the functions of the Healthcare KPI Dashboard. Thank you for answering my frustration.
Vincent K –
I am a manager of health institute. I was searching for a tool to track my key metrics which I need to do it regularly. What I love most is the chart section which I can see each of my metrics. Thank you for your work! Besides that, if you would like to create another template related to health industry, it will be great to consider HSE Documentations. I’ll get it with a great pleasure.
Someka –
Hello Vincent, thank you for your suggestions! I would gladly direct it to our developer team. I am sure they will consider your thoughts if they decide to create one more tool related to health field. For further questions please do not hesitate to contact us! Regards.
Jo Sanders –
It’s fairly straightforward. You can have entire dashboards with data pulling from several sheets so you can have all of your info in one, easy-to-read place.