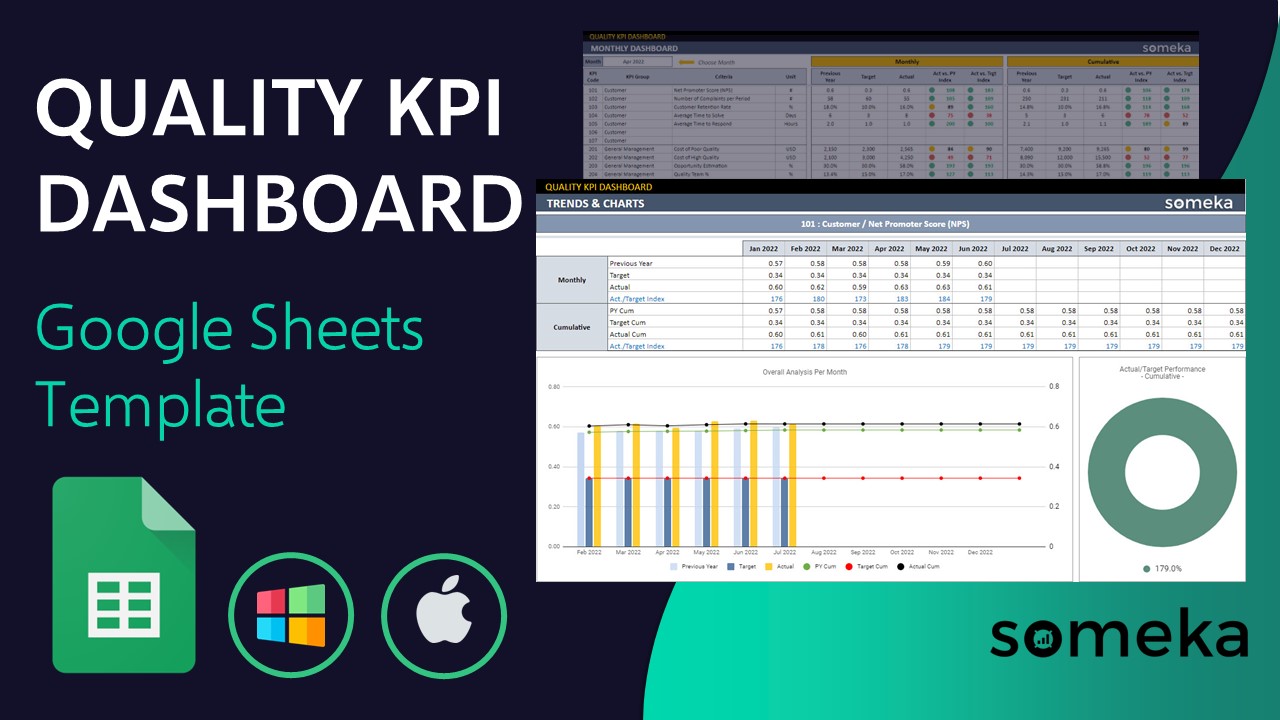
Quality KPI Dashboard Google Sheets Template
QA Dashboard in Google Sheets. Monitor your quality KPIs in all-in-one template. Visual dashboard and trend charts with access from any device.


TEMPLATE DESCRIPTION
Do you have doubts about the quality of your products or quality assurance processes? Then look no further than this Quality KPI Dashboard Google Sheets Template.
As a business owner, you must always keep track of the quality of various things and fields, such as customer service, management, time, and especially products. You should always track your KPI and also OKR (Objectives and Key Results) metrics and you must be cautious about maintaining and exceeding standards.
The Quality KPI Dashboard Google Sheets Template, allows businesses to improve their quality control by collecting data from all departments and establishing specific metrics and milestones to meet concurrently.
This template also greatly helps in monitoring the strengths and weaknesses of teams in order to improve productivity with QA dashboard.
Key Indicators For Quality Control

Here are some key performance indicators for real quality control:
- Customer Satisfaction and Fidelity: Do extensive research on your customers to determine the pros and cons of your product or service in the market. Besides, you can calculate this by creating a satisfaction survey and sending it via email. You can also use NPS methodology in your products by integrating to automated platforms.
- Effectiveness indicator: Ensure that your product or service works properly. Simply conduct market research on how your products perform and run some test groups to calculate this metric.
- Quality Opportunity or Risk: Any organization’s resources are limited. We cannot treat all quality issues equally; some must be resolved immediately, while others will remain in your backlog for a longer period of time.
- Manufacturing Cycle Time: The time between placing an order for a product and receiving finished goods is referred to as the Manufacturing Cycle Time.
Sections of Quality KPI Dashboard Google Sheets Template
Basically, this template is split into two parts, input and output. In the first sheet, you can see the Navigation Menu, which is useful for transferring between sheets and getting an overall view of the template’s foundation. Let’s check other sheets in details:
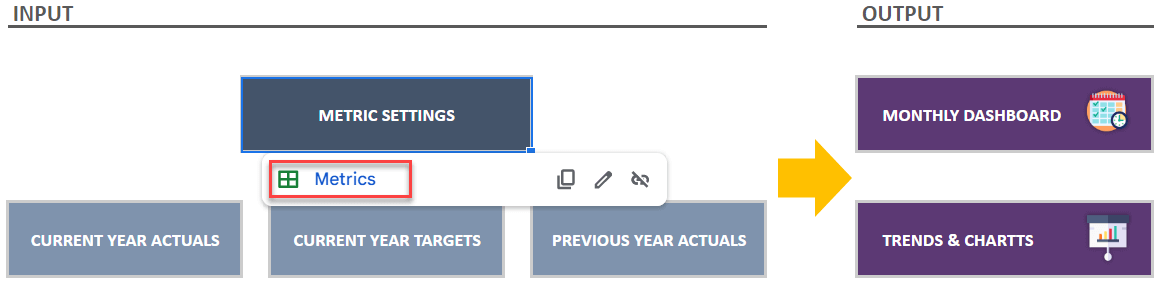
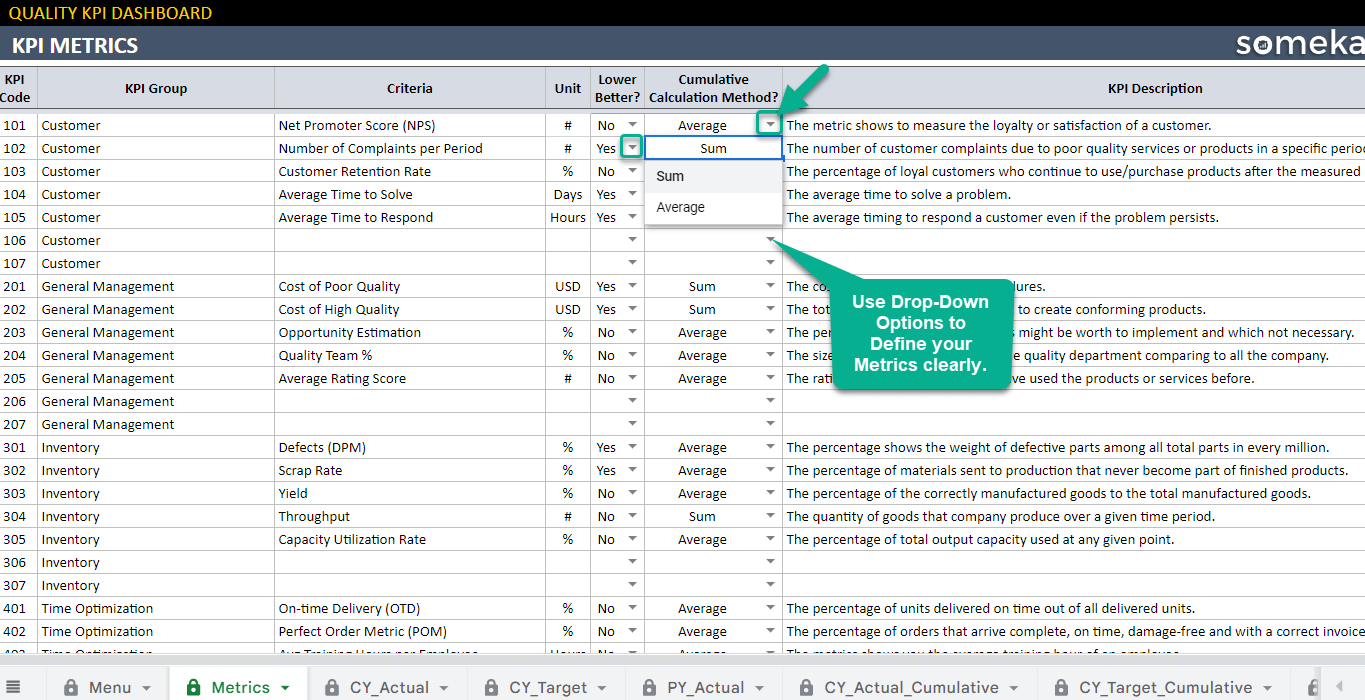
1. Defining Quality KPI Metrics:
Firstly, you can add your metrics here along with their category, unit, and even a brief description of each metric. This serves as the template’s basis. As a result, to more clearly define your objectives, always consult with your team, find out their opinions, and strive for extreme detail in this section.
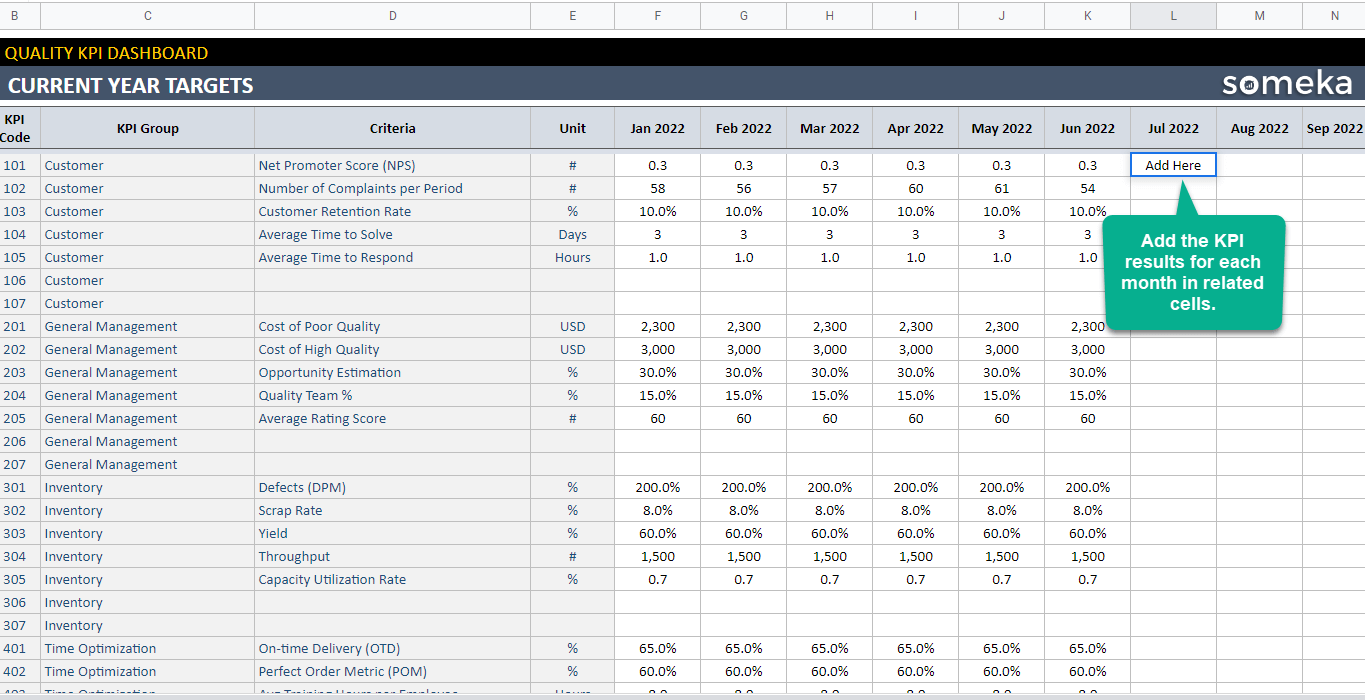
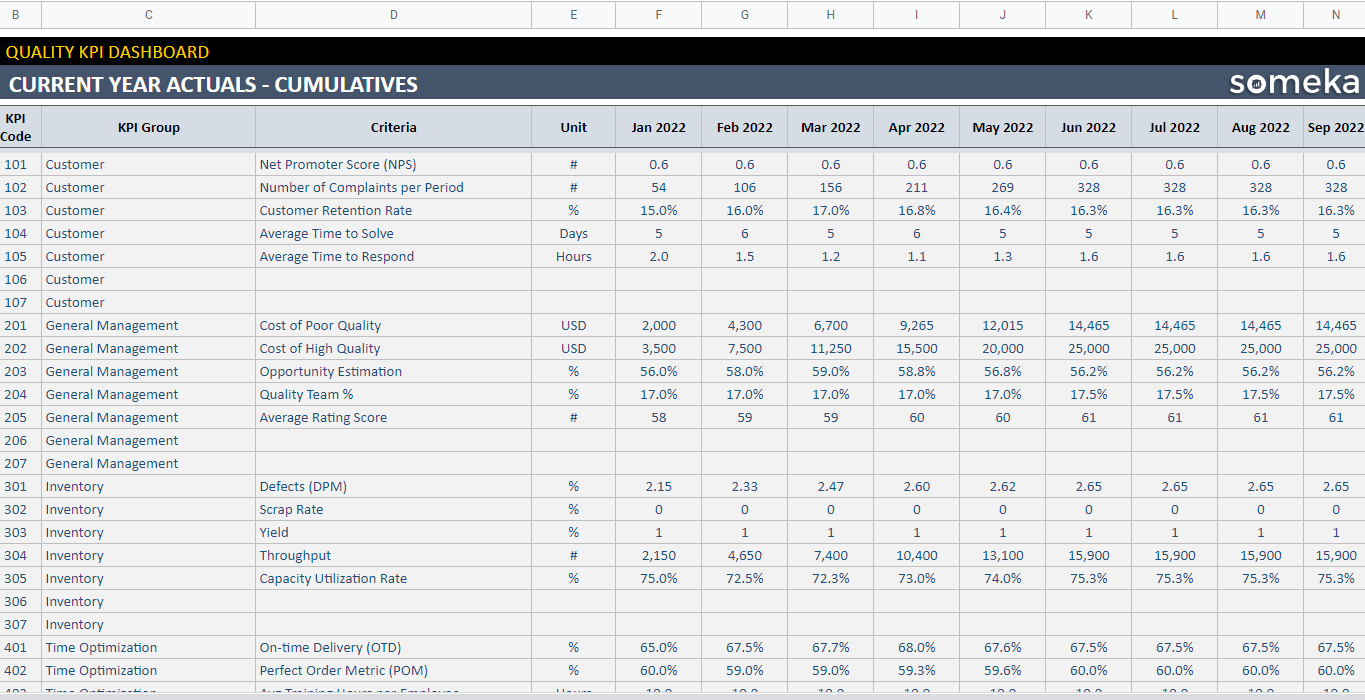
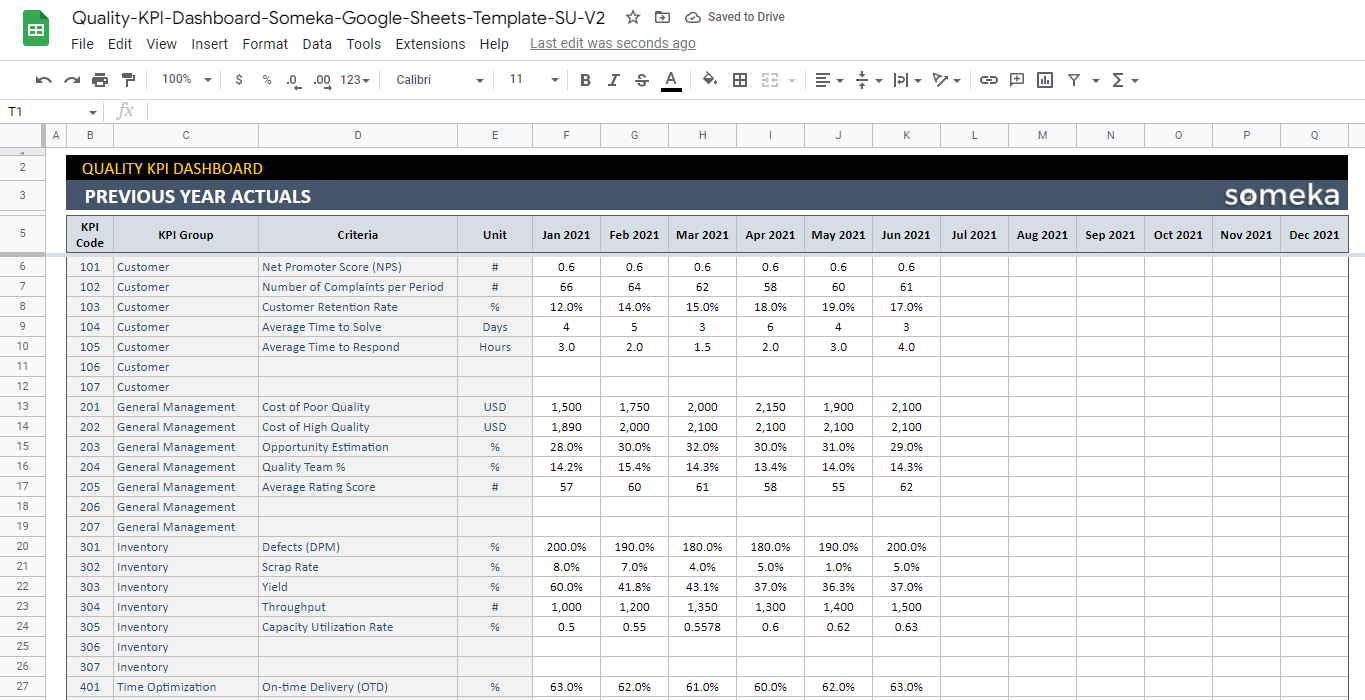
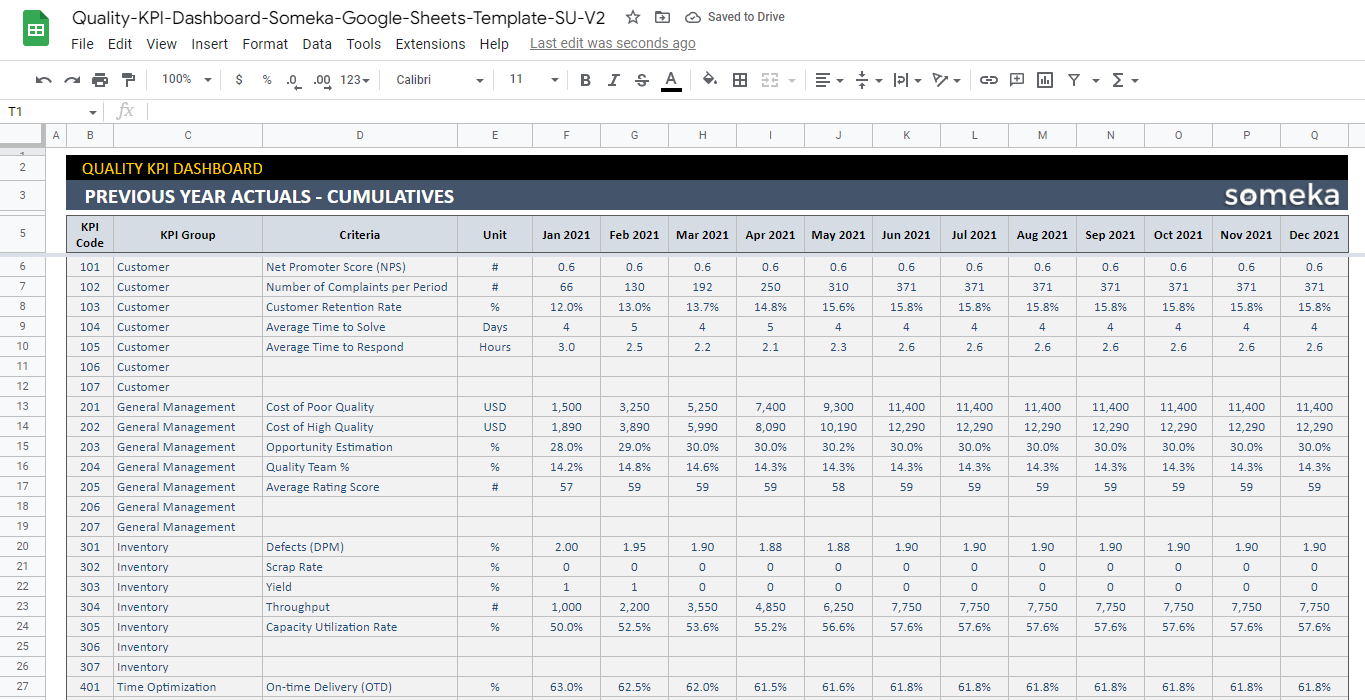
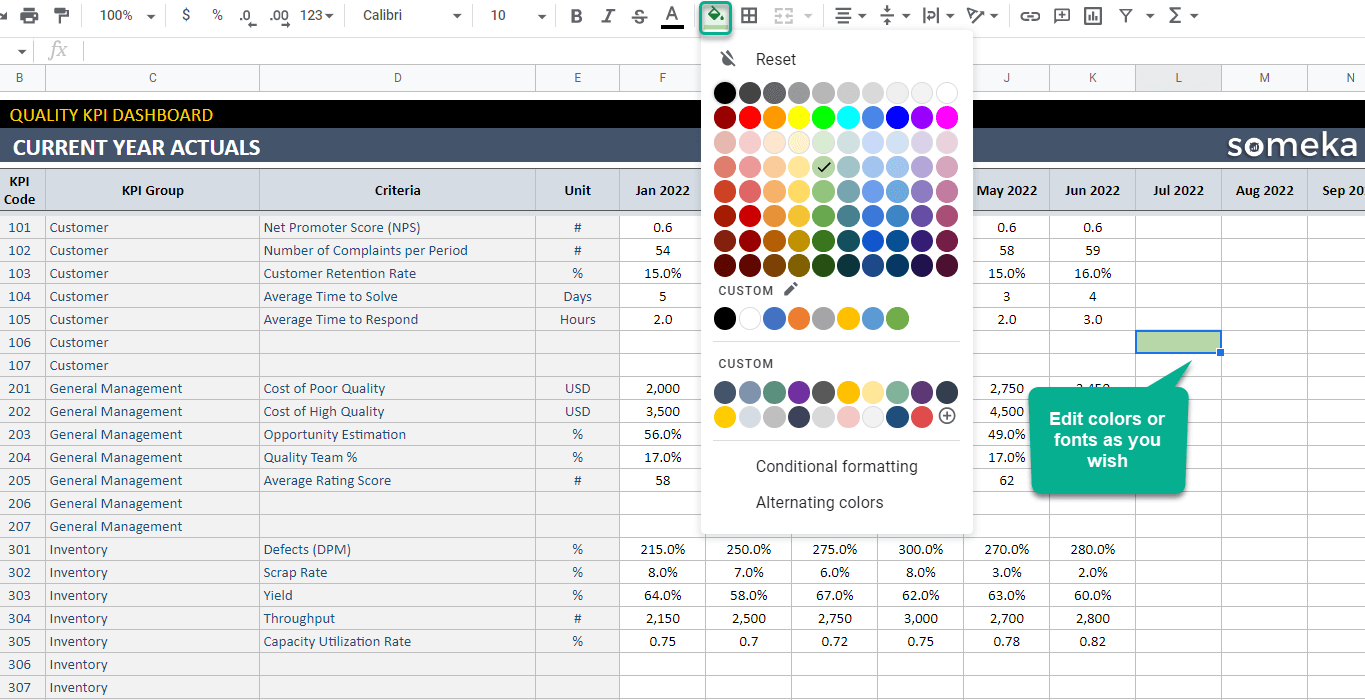
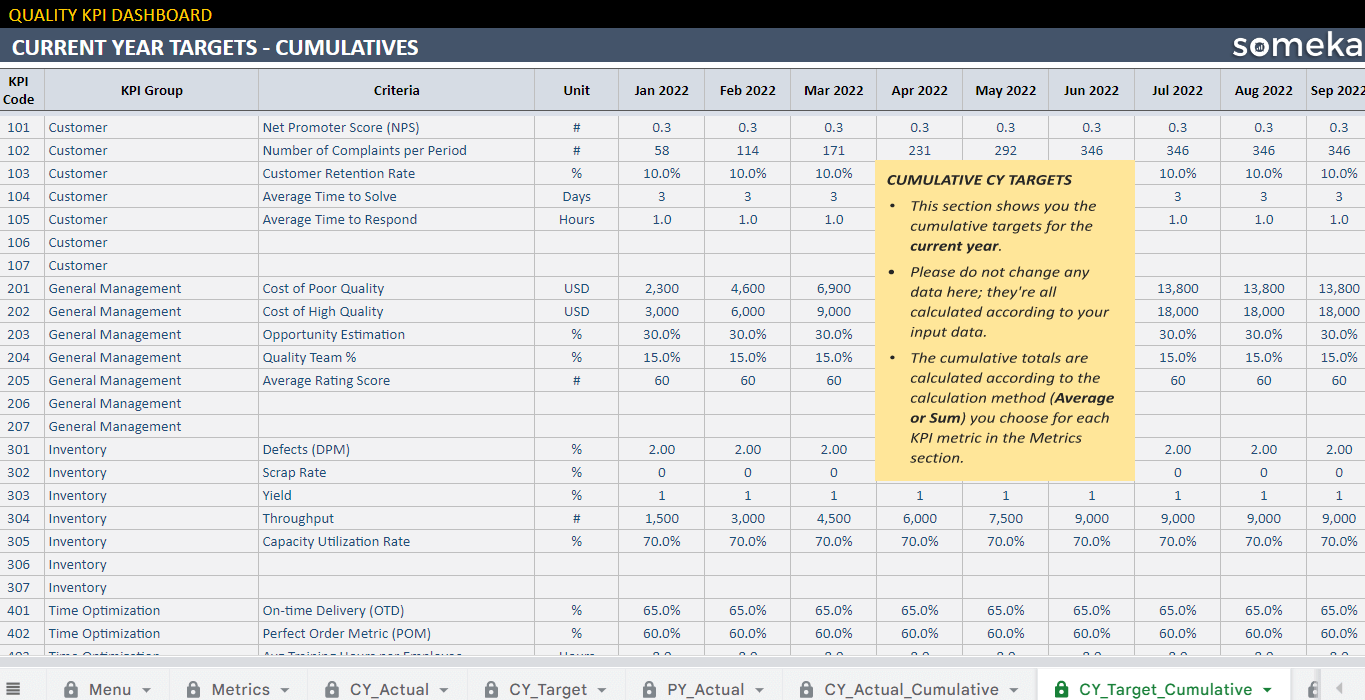
2. Actual and Target KPI Values from the Current and Previous Year’s Actual:
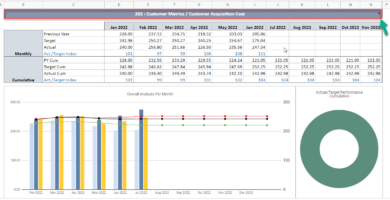
Secondly, the Google Sheets Template calculates the current year actual cumulative, current year target cumulative, and previous year actual cumulative after you add the results for each month to the sheet.
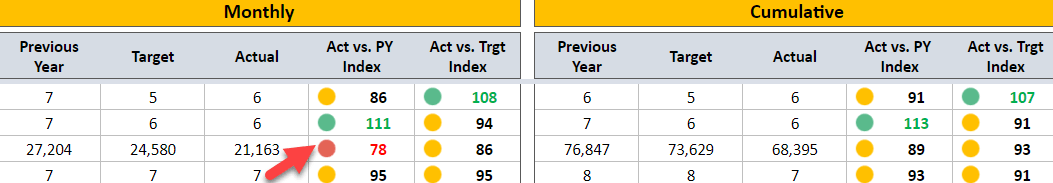
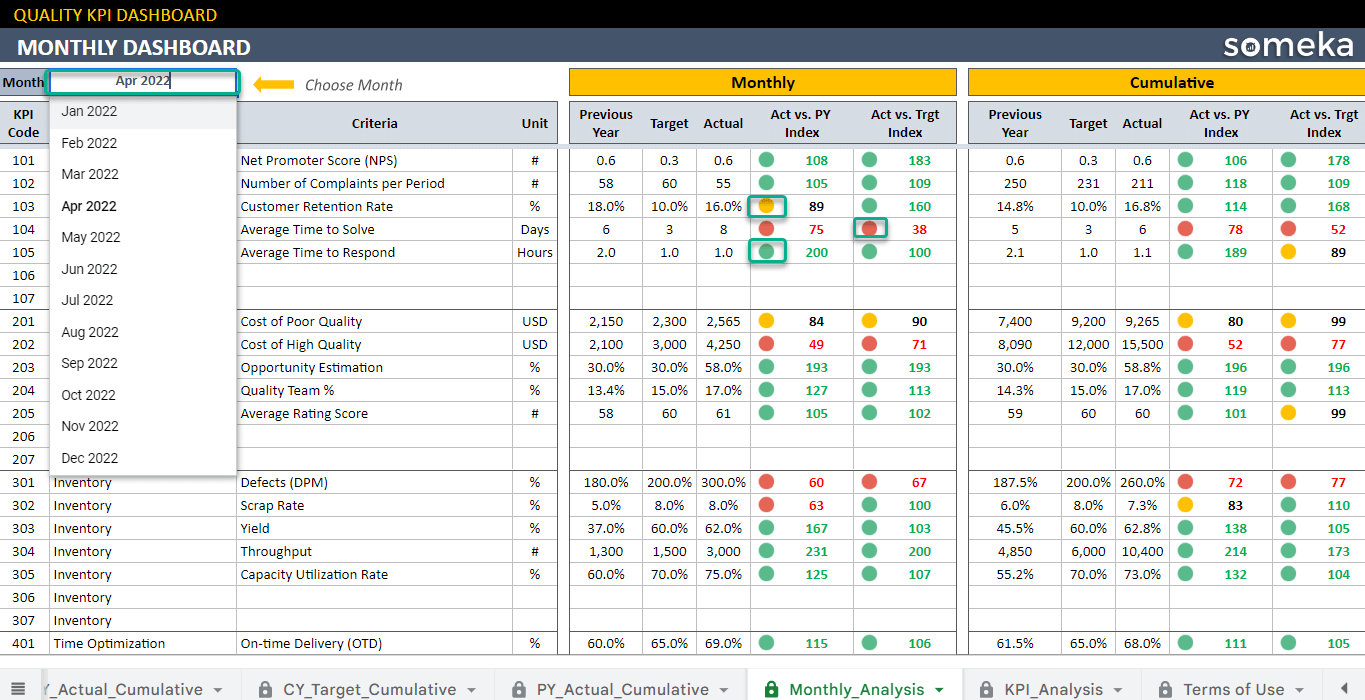
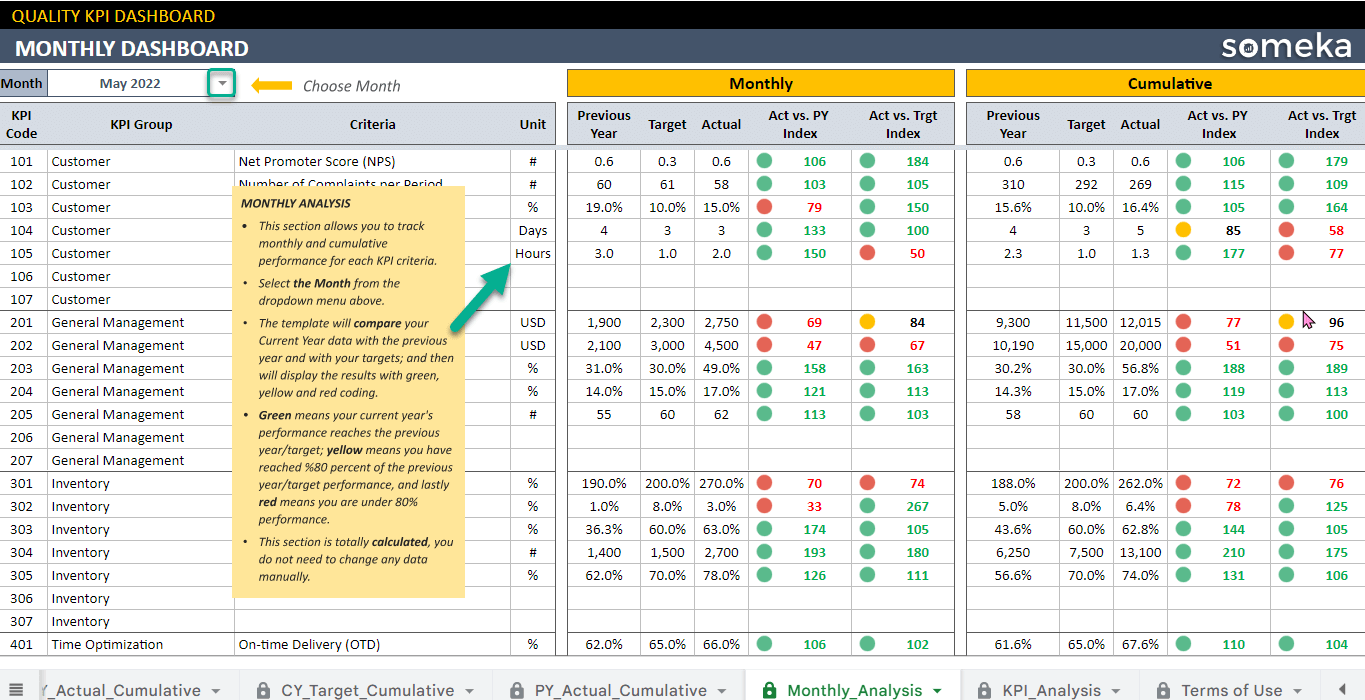
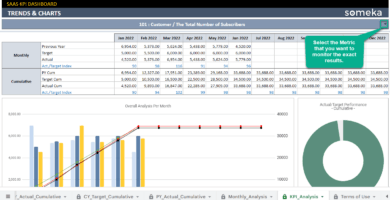
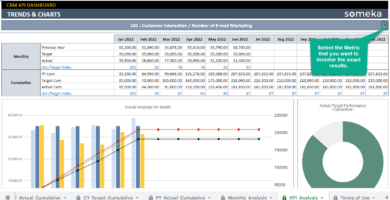
3. Monthly KPI Dashboard:
Select Month in this section to compare monthly and cumulative results altogether. So, make sure to pay attention to the red and yellow lights because they indicate you were not performing well in those metrics.
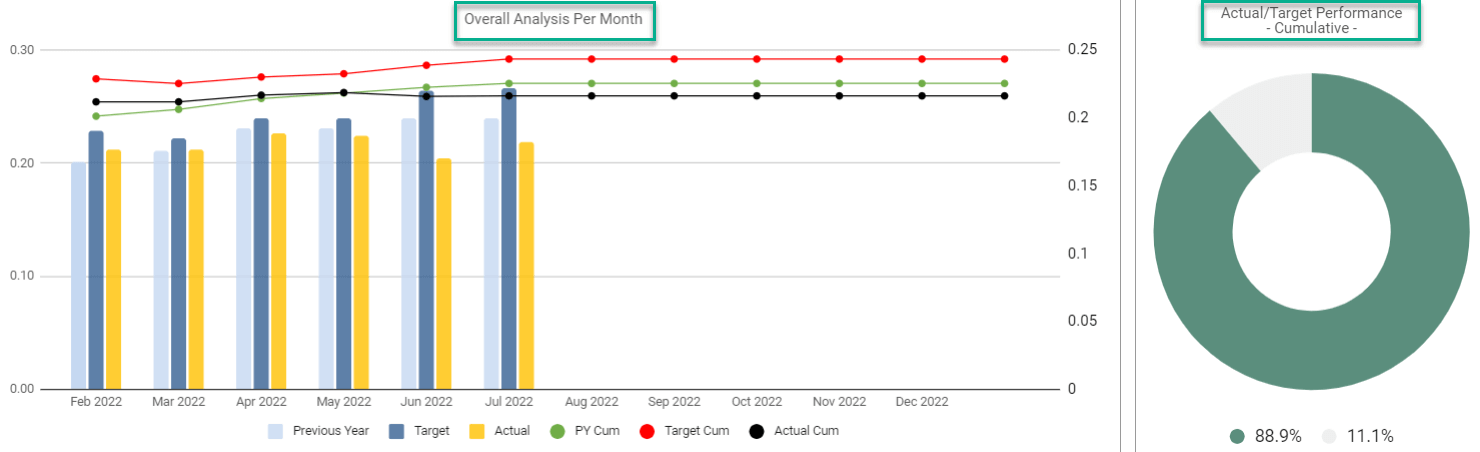
4. Quality KPI Analysis:
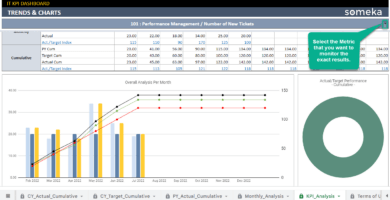
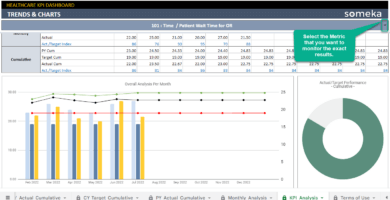
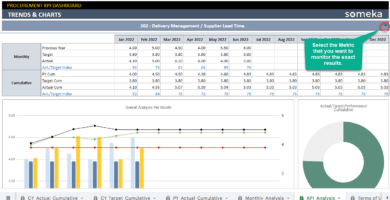
Finally, here is an all-inclusive tool for managers who wish to display KPI and metrics results over time. Simply choose your KPI to gain access to 3 different types of charts.
Meanwhile, all you need is an internet connection and a Google account to get started. And everything will be in sync!
Quality KPI Dashboard Google Sheets Template Features Summary:
- Quality control tool for managers, manufacturing & HR departments
- Monitor each metric separately to assess your performance
- Ready to Print template
- Informational notes included
- Ready to use template
- Works on any operating system
- Suitable for any device including mobile, tablet, desktop
GOOGLE SHEETS KPI DASHBOARDS COLLECTION
PRODUCT VIDEO
Watch the video below to see the template in action! Presentation also includes usage notes, explanations and tips & tricks about the template.
USER REVIEWS & COMMENTS
5 reviews for Quality KPI Dashboard Google Sheets Template
You must be logged in to post a review.
RELATED TEMPLATES
-
 This product has multiple variants. The options may be chosen on the product page
IT KPI Dashboard Google Sheets Template
$0.00 – $79.95IT Department KPI template in Google Sheets. Track key metrics for information technology in all-in-one tool. Printable trend charts included.
-
This product has multiple variants. The options may be chosen on the product page
Healthcare KPI Dashboard Google Sheets Template
$0.00 – $79.95KPI tracker for healthcare facilities. Monitor key hospital metrics with monthly trend charts and analysis. Printable dashboard with online access.
-
This product has multiple variants. The options may be chosen on the product page
Marketing KPI Dashboard Google Sheets Template
$0.00 – $79.95Professional Marketing KPI dashboard in Google Sheets. Track goals and metrics for your marketing efforts. Ready for presentations and reports.
-
This product has multiple variants. The options may be chosen on the product page
Procurement KPI Dashboard Google Sheets Template
$0.00 – $79.95Purchasing KPI Tracker in Google Sheets. Monitor key indicators for procurement department. Printable trend charts with access from any device.
-
This product has multiple variants. The options may be chosen on the product page
SaaS KPI Dashboard Google Sheets Template
$0.00 – $79.95KPI Dashboard for SaaS business. Track your key metrics with monthly comparisons. Ready-to-use Google Sheets template. Access from any device.
-
This product has multiple variants. The options may be chosen on the product page
CRM KPI Dashboard Google Sheets Template
$0.00 – $79.95Online spreadsheet to track CRM KPIs. Monitor your key customer metrics with monthly trend chart analysis. Printable dashboard with on sheet guide.


Christiano Velber –
How can I see on the charts of other KPIs? I can see only one KPI. Help!
Someka –
Hello Christiano
You can choose which related KPIs you want to see. Please watch the video on this page.
Hope this helps!
Aidan B. –
Smart reports at a minimal cost. The chart portion is highly helpful in presenting information about the real issue.
Rana –
I like the template of Googlesheets. I’d want to purchase this template as well, but I have a few questions before I do so. How can I add more KPI metrics to this template?
Someka –
Hello Rana,
To begin, we really would like to say thank you for your nice words!

There are several KPI metrics available at the moment. However, we left some blank rows in each category for our users to fill in with their own KPI metrics. If you have any more questions, please let us know! contact@someka.net
Eduardo T. –
This tooll appealing to me and I would advise it to anyone. Thx so mucg!!
Teddy Shepherd –
Great job, this product is useful and complete. But I am having problems to modify it How can I unlock file?
Someka –
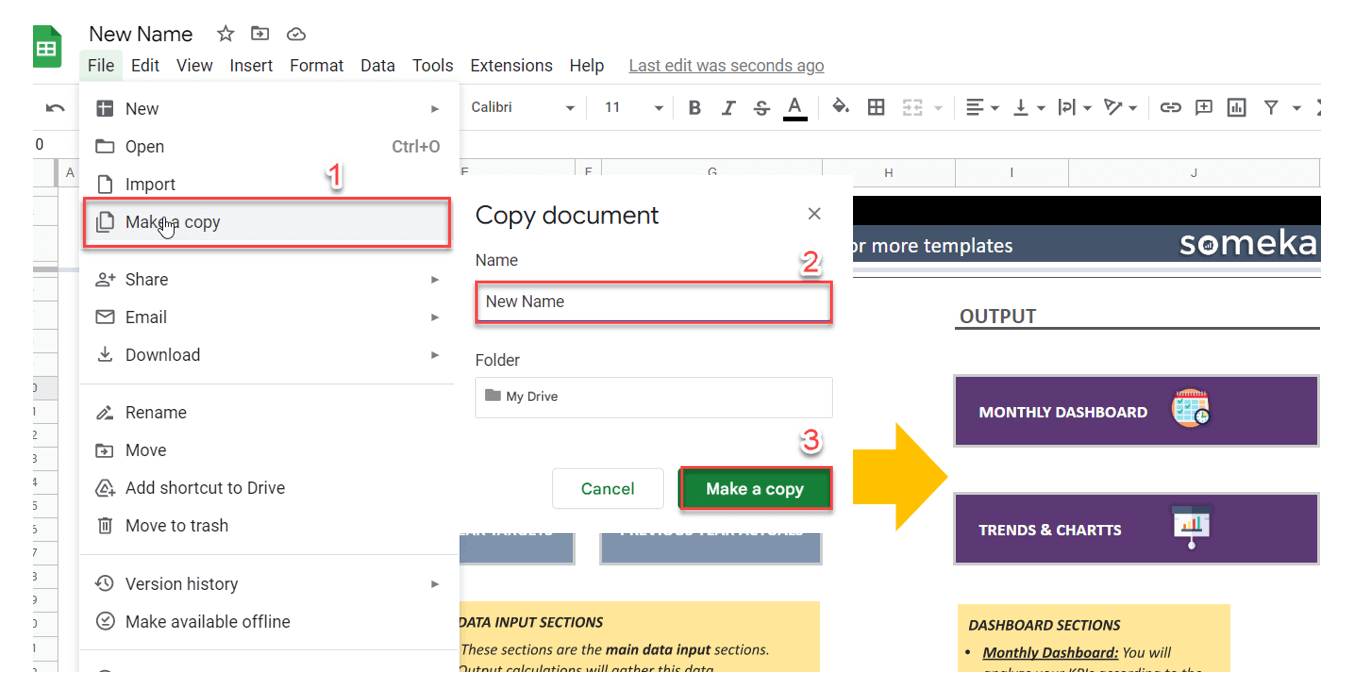
Hello Teddy,

After making your copy of the Google Sheets (or as shown below), you can customize it according to your needs. If you need to customize your template, our development team can help you, contact them via email at contact@someka.net and describe your needs.
Hope this helps!