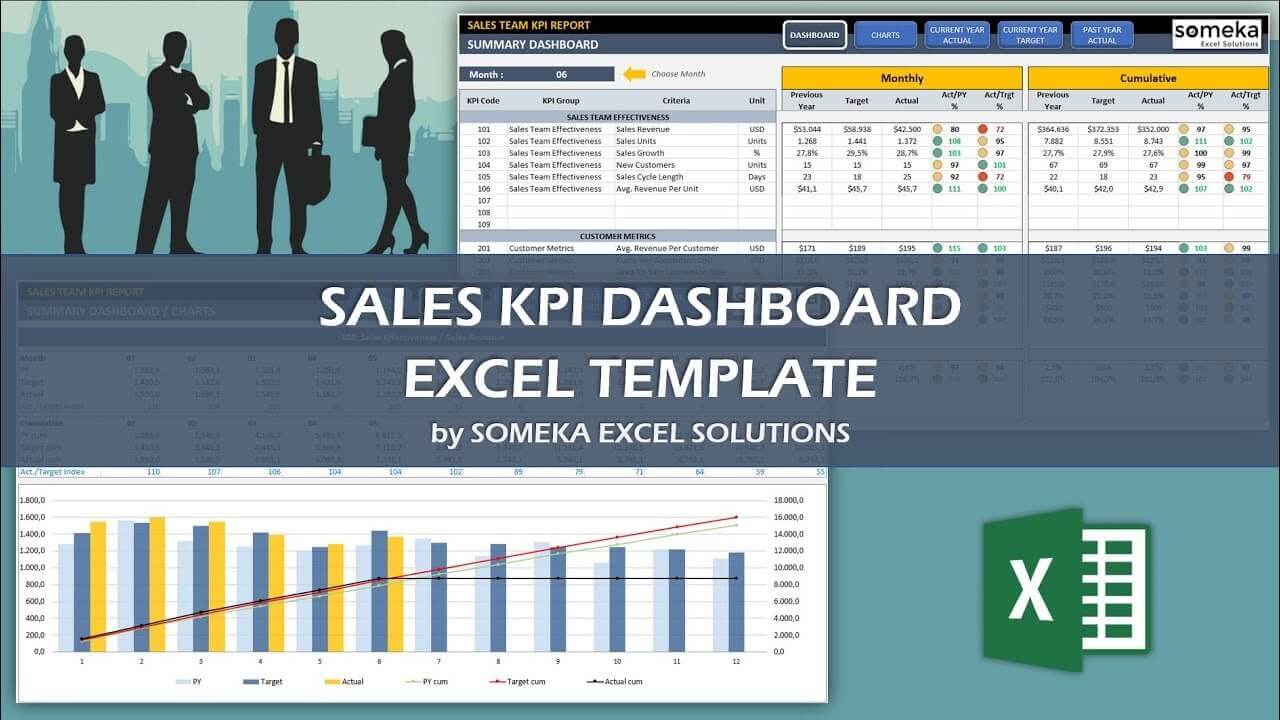
Sales KPI Dashboard Excel Template
Sales KPI Spreadsheet. Track your key metrics on sales team. Dynamic dashboard with trend charts and comparison analysis. All in Excel.
TEMPLATE DESCRIPTION
The Sales KPI Dashboard Excel Template is an important tool for the Sales department with measurable metrics inside that help to evaluate achieving the company’s goals and maintaining growth. For example, you want to present successful results and prove the effectiveness of your sales team.
So, some common questions: What numbers should I give? Also, which Key Performance Indicators should I consider? How should I compare results in order to show current success?

In general, according to KPI dashboard logic, you set the right goals to measure specific performance metrics, you select specific periods to compare and it gives you a quick overview of your company’s performance. You should always track your KPI and also OKR (Objectives and Key Results) metrics for a sustainable sales business.
On the other hand, while preparing a Sales KPI dashboard, the most important thing is to define the right metrics which will differ from department to department. Because it would be meaningless to evaluate sales team performance with performance indicators of the HR department.
How To Create The Most Useful KPI Dashboard For Sales Department?
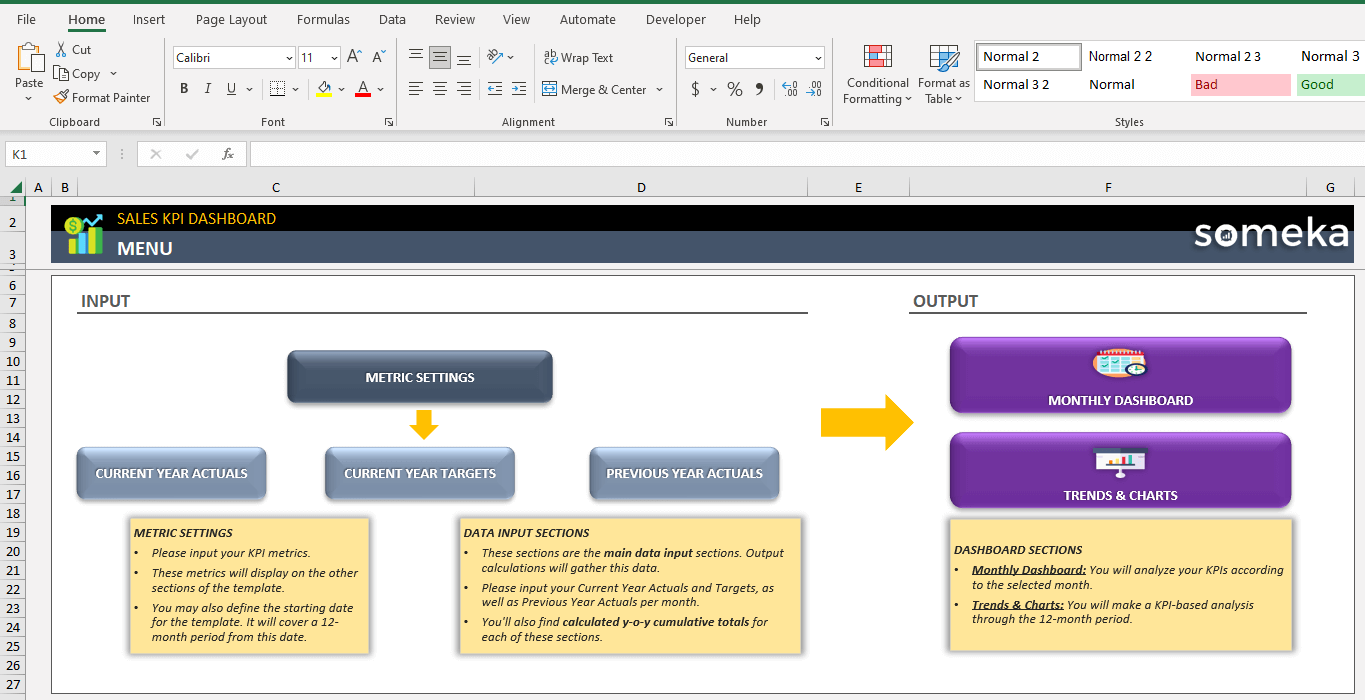
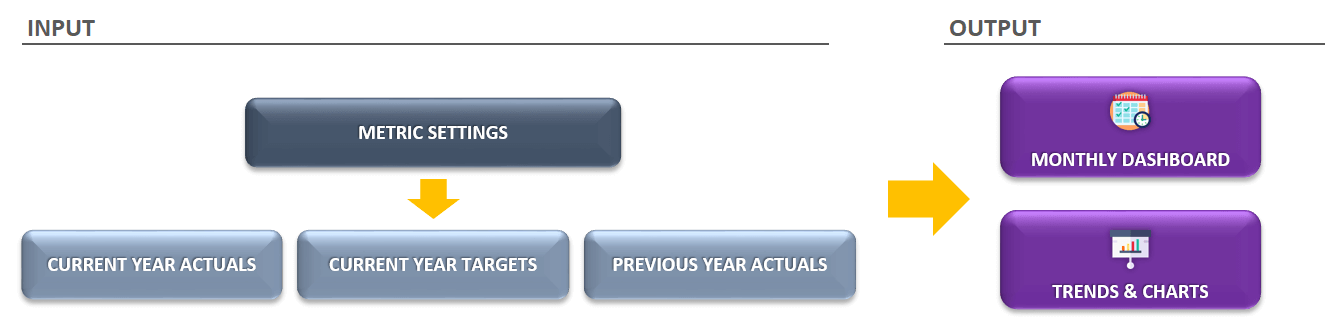
Instead of creating a Sales KPI Dashboard from scratch, we offer you a Ready-to-Use Excel Template which consists of:
- Major Key Sales Performance Indicators
- Trend Charts
- Previous Year and Target Comparisons
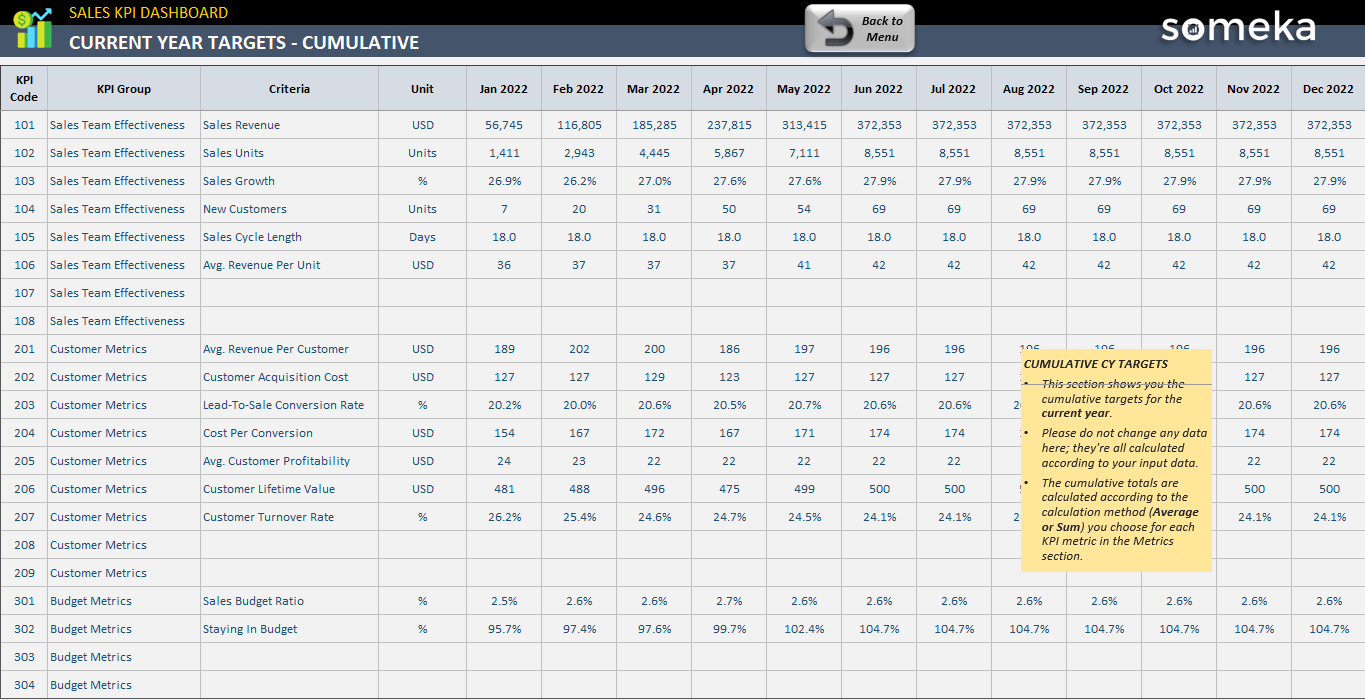
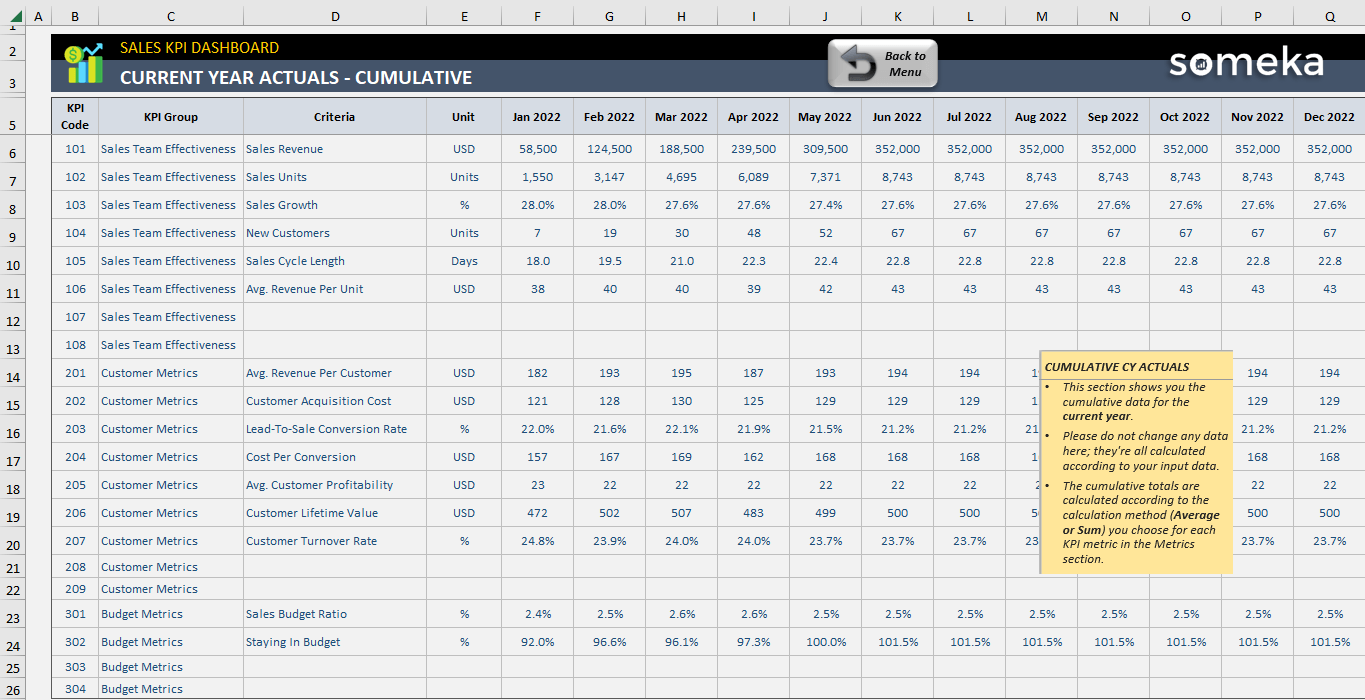
- Monthly and Cumulative Analysis
Sales KPI Dashboard Excel Template Features:
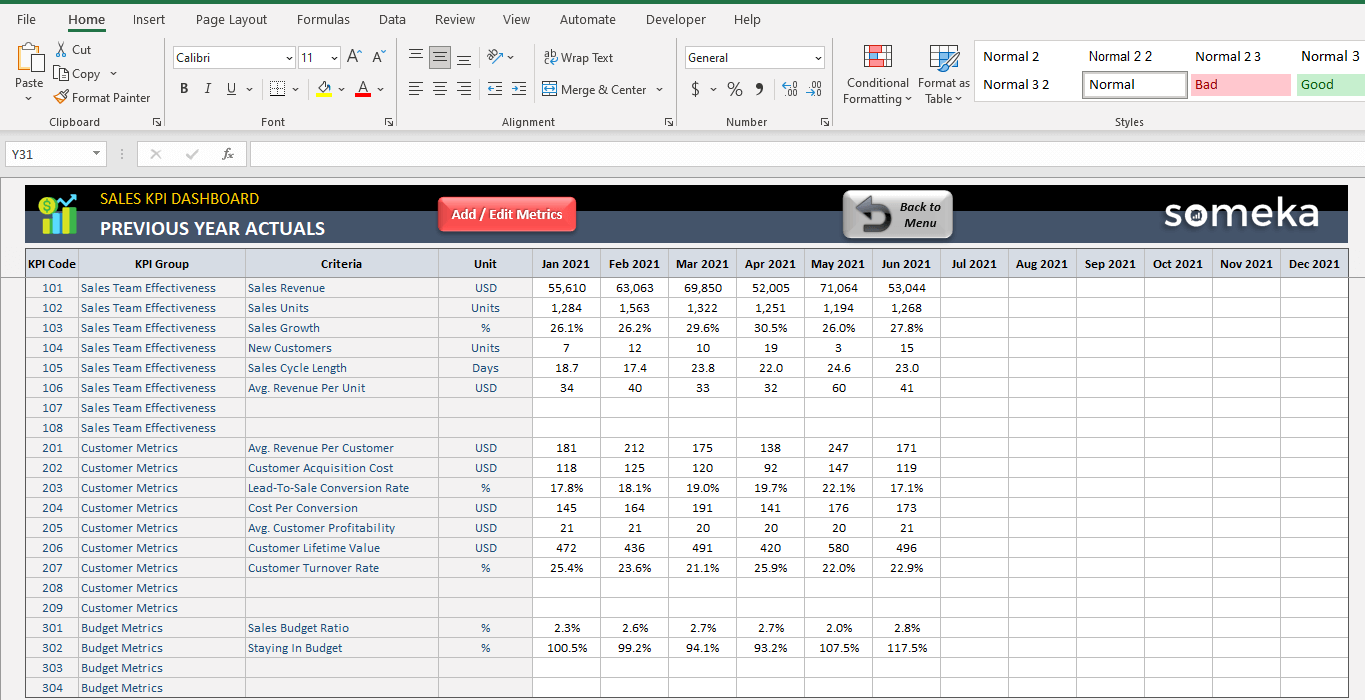
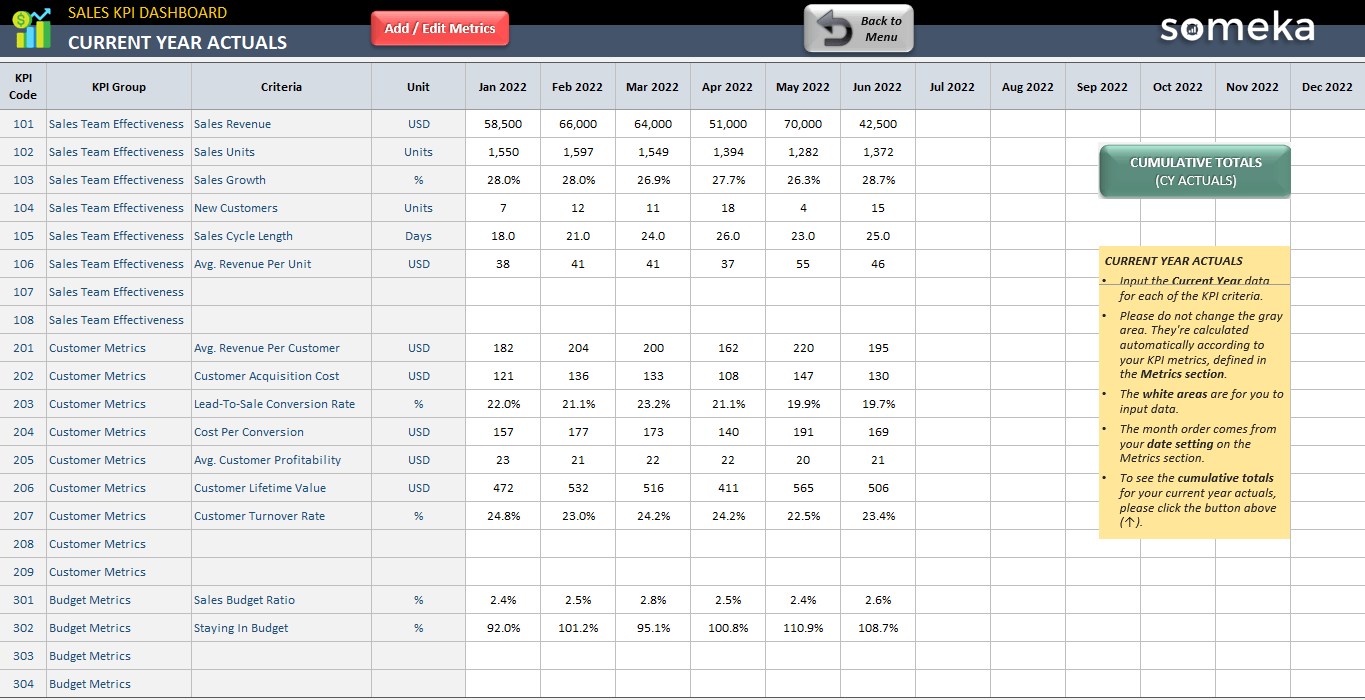
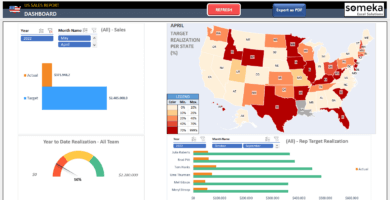
Firstly, the navigation menu enables you to switch between other worksheets and the last three buttons stand for Current Year Actual, Current Year Target, and Past Year Actual which you can input your values manually in this Sales KPI Dashboard Excel Template.

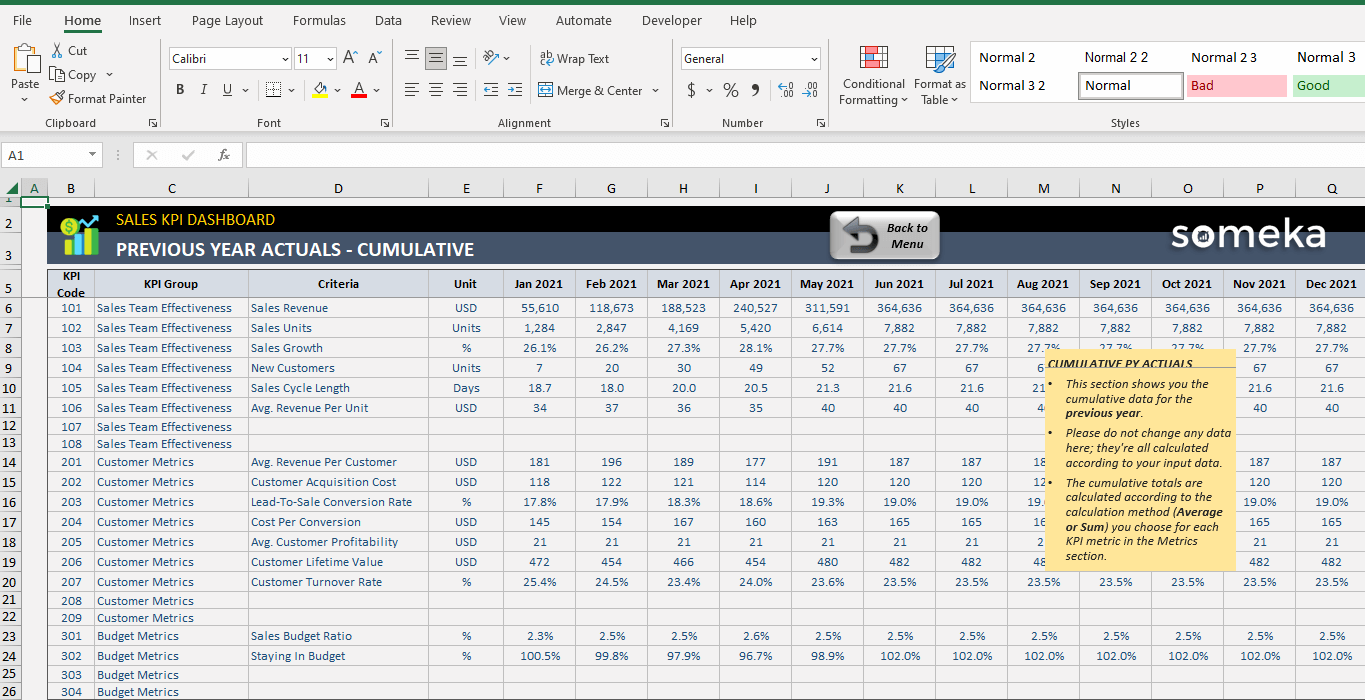
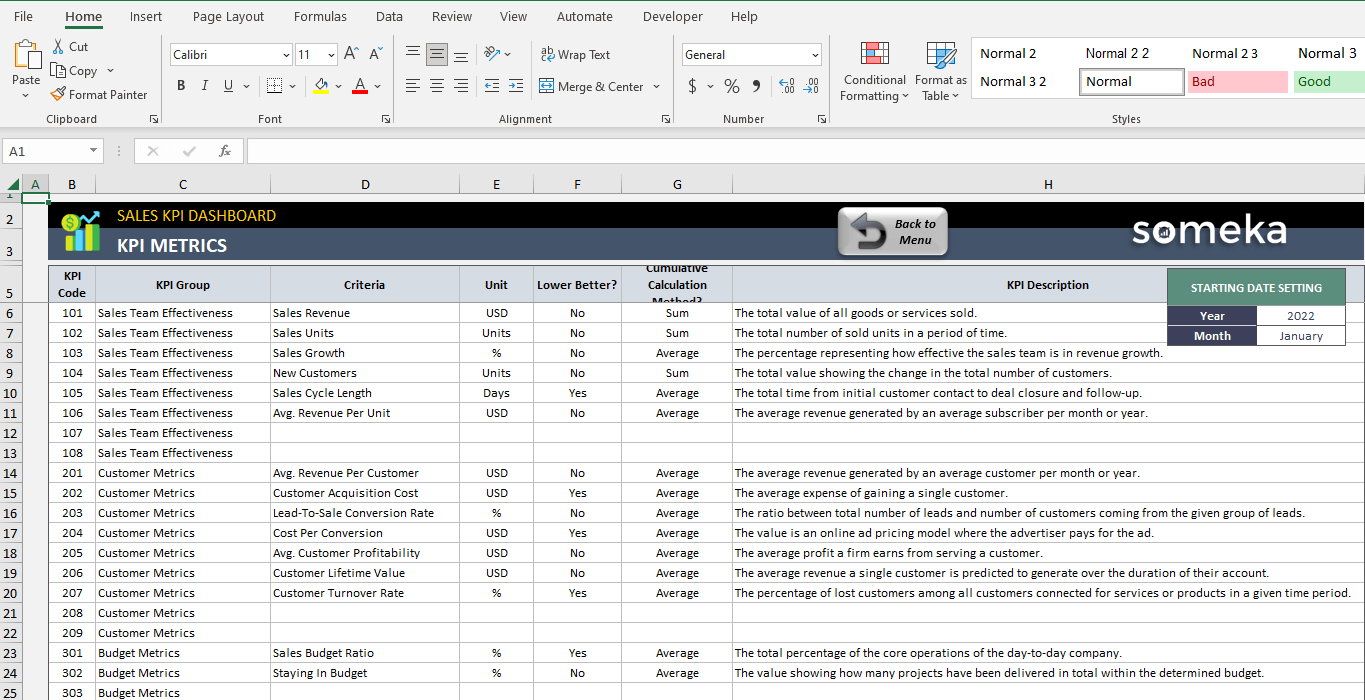
Moreover, the Cumulative Calculation method, as well as the Lower is a Better option, are available to the user. Meanwhile, the Charts section will help you compare your data trends forming with the line chart. Furthermore, we aim to give you a clear visual representation of your hospital performance dashboard according to the selected metric.
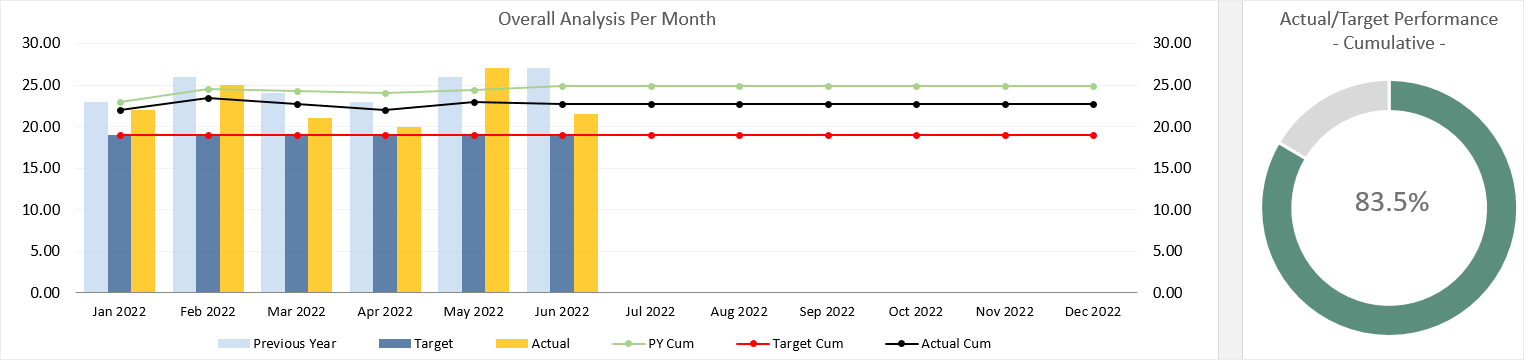
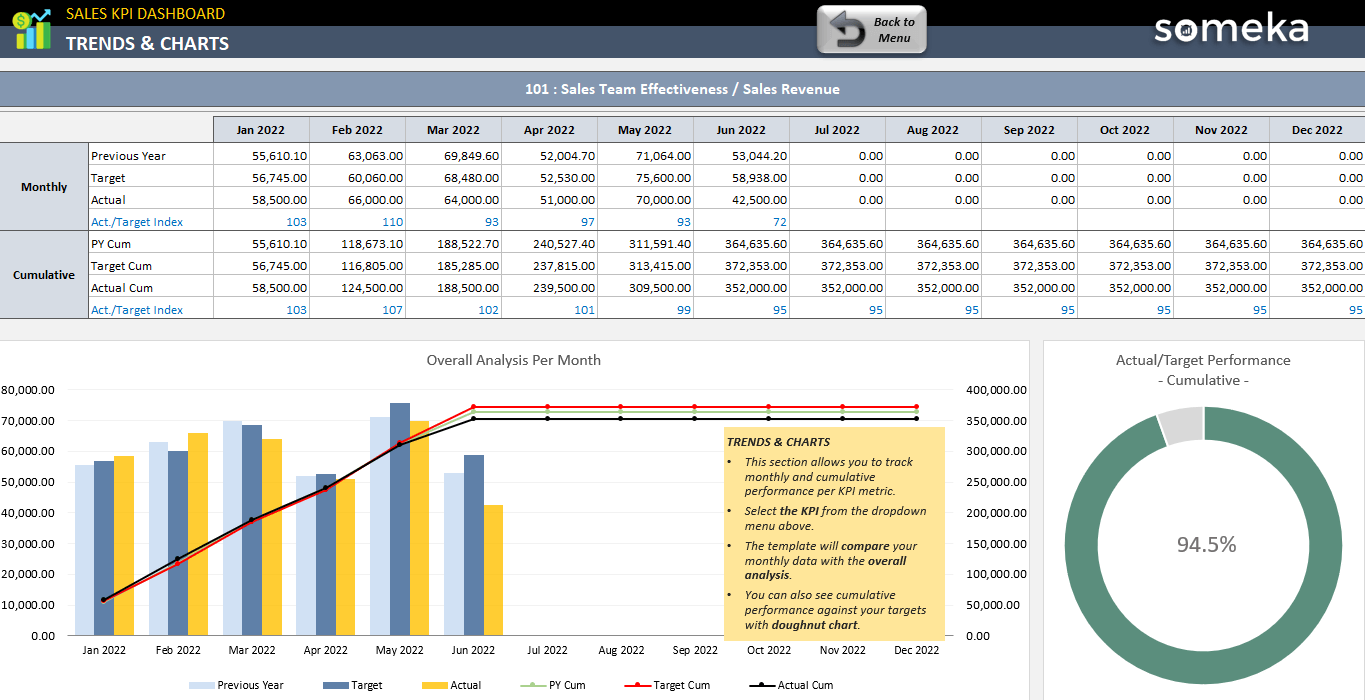
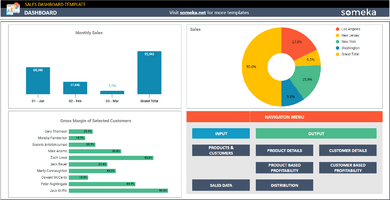
Trends and Charts:
It is possible to track monthly cumulative performance per KPI metric in this section of Sales KPI Dashboard Excel Template . With a doughnut chart, you can also see cumulative performance against your target.
What Are The Right Key Performance Indicators for Sales Team?
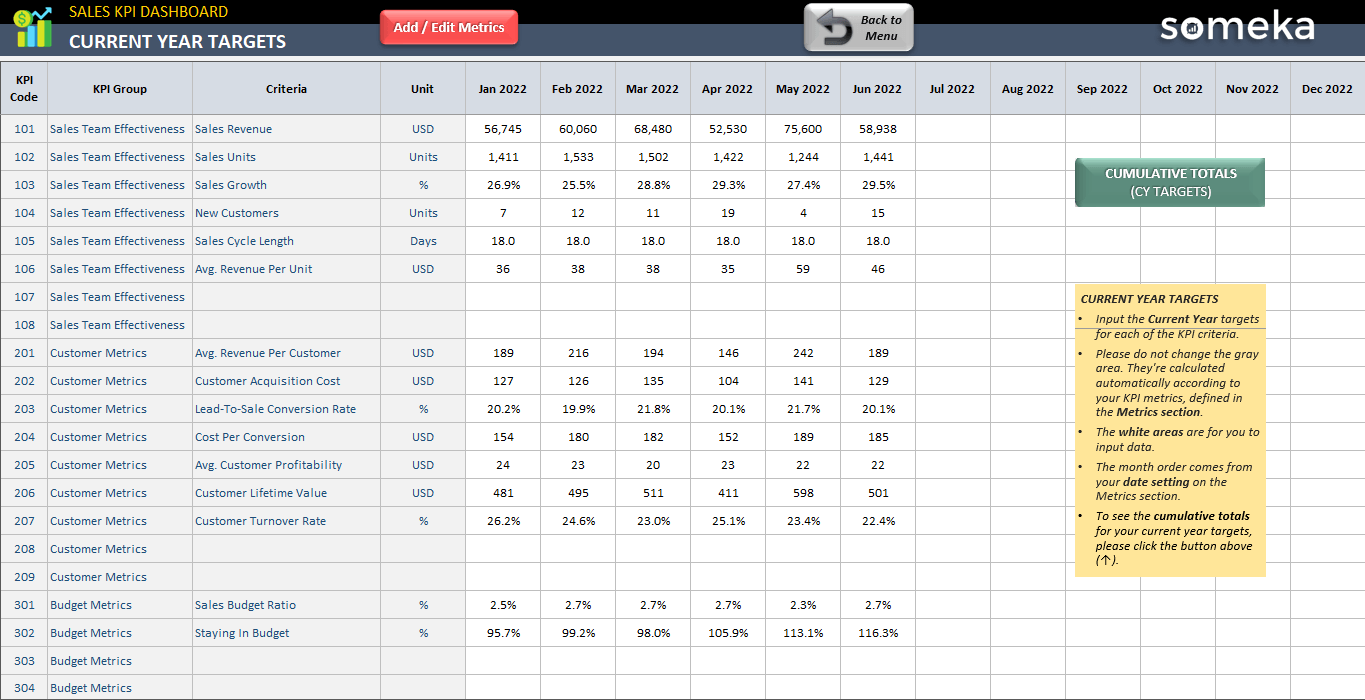
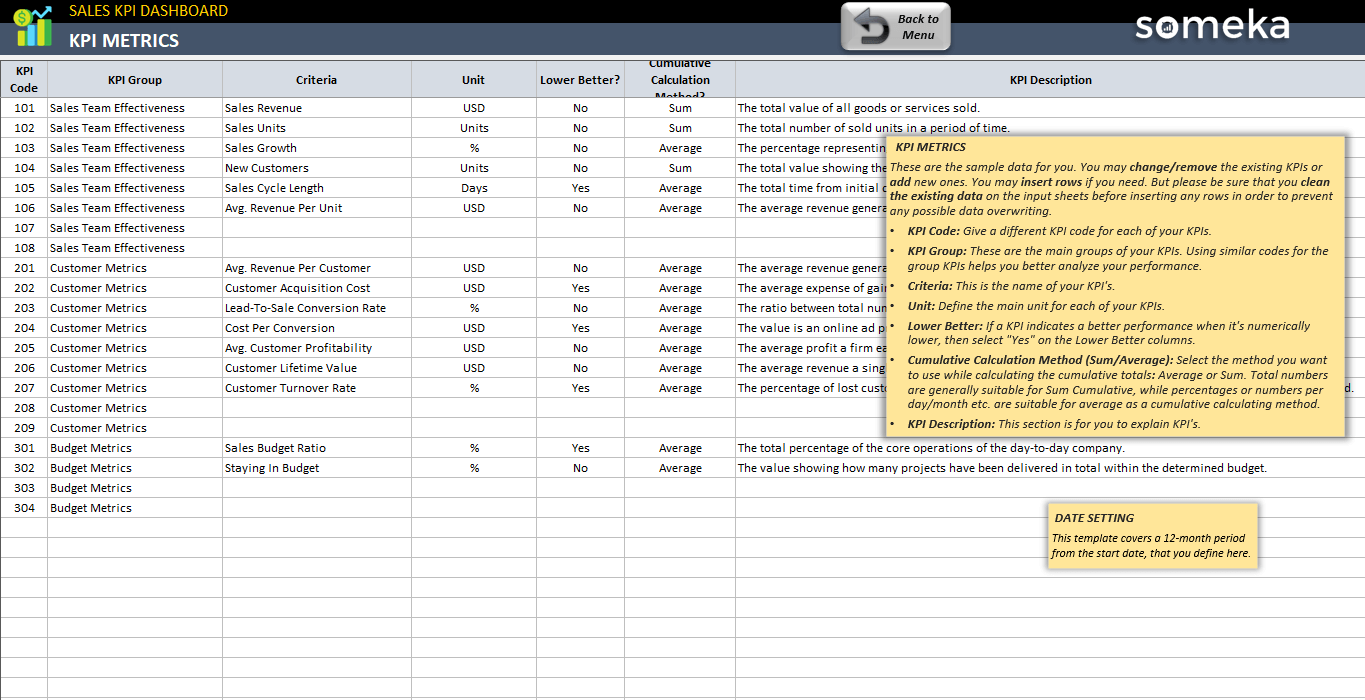
In summary, we’ve collected the most commonly used Sales KPIs under 3 main categories in this template:
- Sales Team Effectiveness: Sales Revenue | Sales Growth | Monthly Sales / New Customers | Sales Target ( Actual Rev vs. Forecasted Rev) | # of Sales Demos | Average Sales Cycle Length/Average Conversion Time
- Customer Metrics: Average Revenue Per Unit (Average Revenue Per Customer) | Customer Acquisition Cost / Cost Per Lead | Lead-To-Sale Conversion Rate | Cost Per Conversion | Customer Profitability | Customer Lifetime Value | Customer Turnover Rate
- Budget Metrics: Sales Budget Ratio (Sales Spendings/Total Revenues) | Staying In Budget Ratio
However, you can add more KPIs if you prefer. Afterward, you input relevant values and analyze the results in a nicely designed dashboard that is supported by charts.
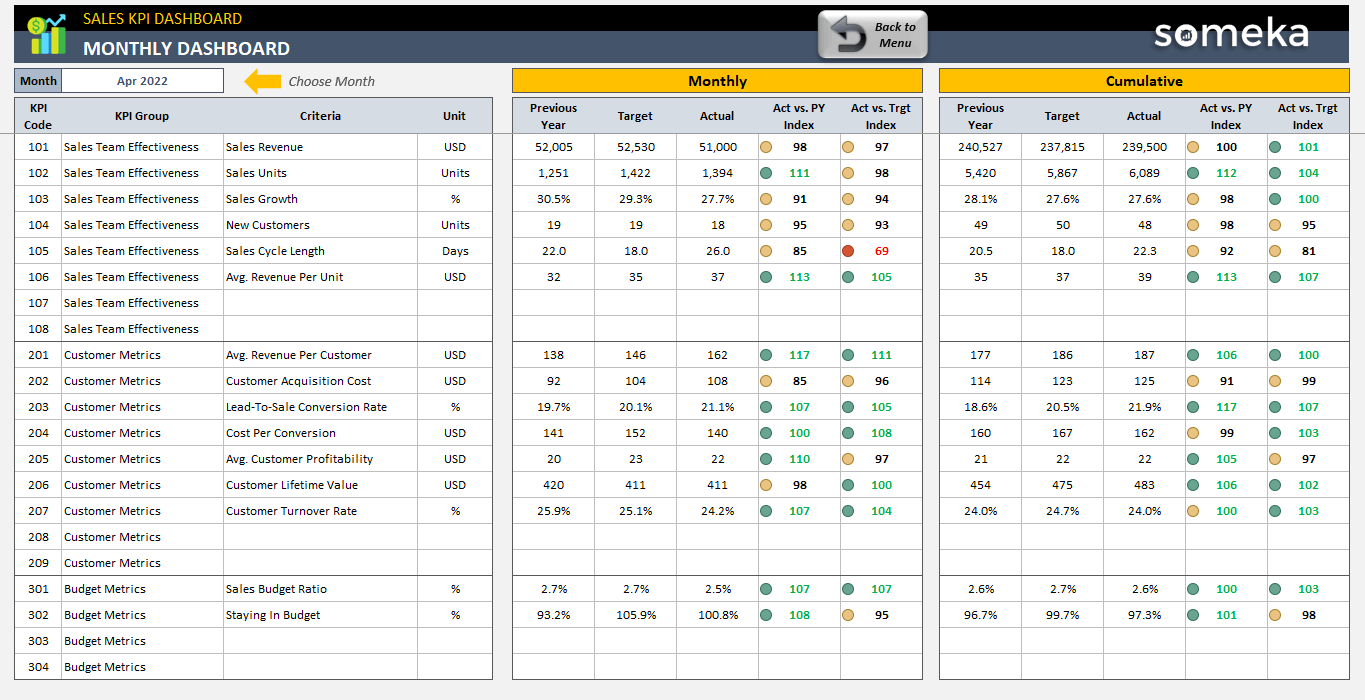
Furthermore, it shows monthly and cumulative results separately. Moreover, you will be able to see the comparison with last year’s figures and company targets. So thanks to this Sales KPI Dashboard, you will easily follow your critical metrics, make comparisons and stay on track!
Sales KPI Dashboard Excel Template Features:
- Both monthly and cumulative analysis
- Comparison with Past Year and Target values
- Summary dashboard as well as interactive charts
- Easy-to-use Sales Team KPI Template included
- Also, clear on-sheet instructions
- Compatible with Excel 2010 and later versions
- Works both on Windows and Mac
- No installation is needed. Ready to use
- Full Print ready
- White Label
- Does not include any VBA macros
EXCEL KPI DASHBOARDS COLLECTION
PRODUCT VIDEO
Watch the video below to see the template in action! Presentation also includes usage notes, explanations and tips & tricks about the template.
USER REVIEWS & COMMENTS
11 reviews for Sales KPI Dashboard Excel Template
You must be logged in to post a review.
RELATED TEMPLATES
-
 This product has multiple variants. The options may be chosen on the product page
Sales Google Sheets Templates Bundle
$199.95 – $399.95Sales Google Sheets Templates Bundle. Boost efficient in your sales team with our premium online templates. No installation, no setup. All ready to use.
-
This product has multiple variants. The options may be chosen on the product page
Excel ERP Template
$0.00 – $199.95ERP spreadsheet template as a mini ERP application in Excel. Simple yet powerful. Manage your processes, see projections and calculate financials.
-
This product has multiple variants. The options may be chosen on the product page
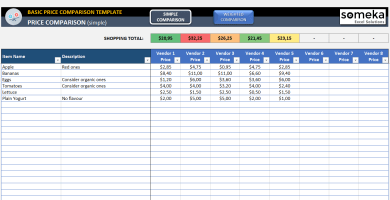
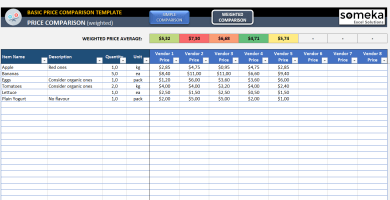
Vendor Comparison Excel Template
$0.00 – $59.95Cost comparison spreadsheet. Compare prices from multiple vendors or suppliers. Printable and ready to use Excel template. No installation needed.
-
This product has multiple variants. The options may be chosen on the product page
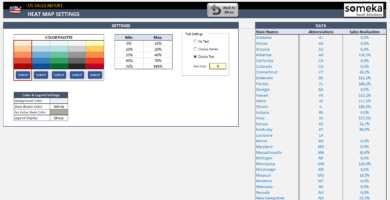
US Sales Map Excel Template
$0.00 – $69.95Sales territory mapping tool for USA. Create printable sales heat map for states with optional settings. No installation needed. All in Excel.
-
This product has multiple variants. The options may be chosen on the product page
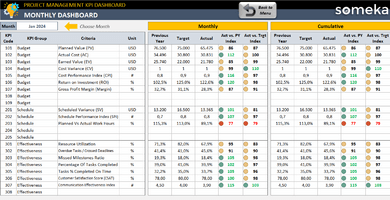
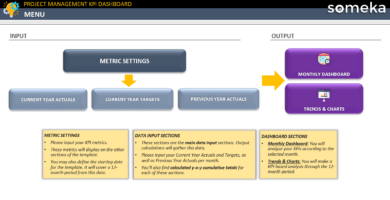
Project Management KPI Dashboard Excel Template
$0.00 – $79.95Excel Project Management KPI Dashboard Template incorporates key metrics such as CPI and SV and provides comparisons with trend charts.
-
This product has multiple variants. The options may be chosen on the product page
Sales Dashboard Google Sheets Template
$0.00 – $69.95Executive report in Google Sheets to track performance of sales departments. Visualize performance, automate analysis, and gain insights for informed strategies. Ready-to-use.


Rajesh –
We are now able to track our performance more effectively and make data-driven decisions. TNX team,
Vanesa. Tang –
does this template come up with an online version too? that would be good to check it on my cell phoen too.
Someka –
Gretting, Thanks for getting in touch.
Yes we have a Sales KPI Google Sheets Template available, please check it from the provided link.
If you need help please be in touch: contact@someka.net
A.Grigorian –
Can I add my company’s logo to this template? It would be great to have our logo displayed on the dashboard.
Someka –
Hello there, yes you are able to cut Someka’s logo and add your own branding instead, if you have problem with removing Someka’s logo from Excel template, please check the link provided.
Monica P. –
This Sales KPI Dashboard is so easy to use! I was able to input my values and analyze the results in no time.
Mohamad –
i think this template is useful i use it at work and it help me follow my sales correctly. but i can’t use it in Google sheets why???
Someka –
Hi Mohamad,
Thank you for your comments.
We develop and test our templates only for Microsoft Excel. If you have a suitable Excel version, most of our templates are compatible with both Windows and Mac.
If you use other software (Like Google Sheets) they may not work properly. However, this is actually on our to-do list. Google Sheets versions of our amazing Excel templates are coming soon 🙂 stay tuned…
Samantha –
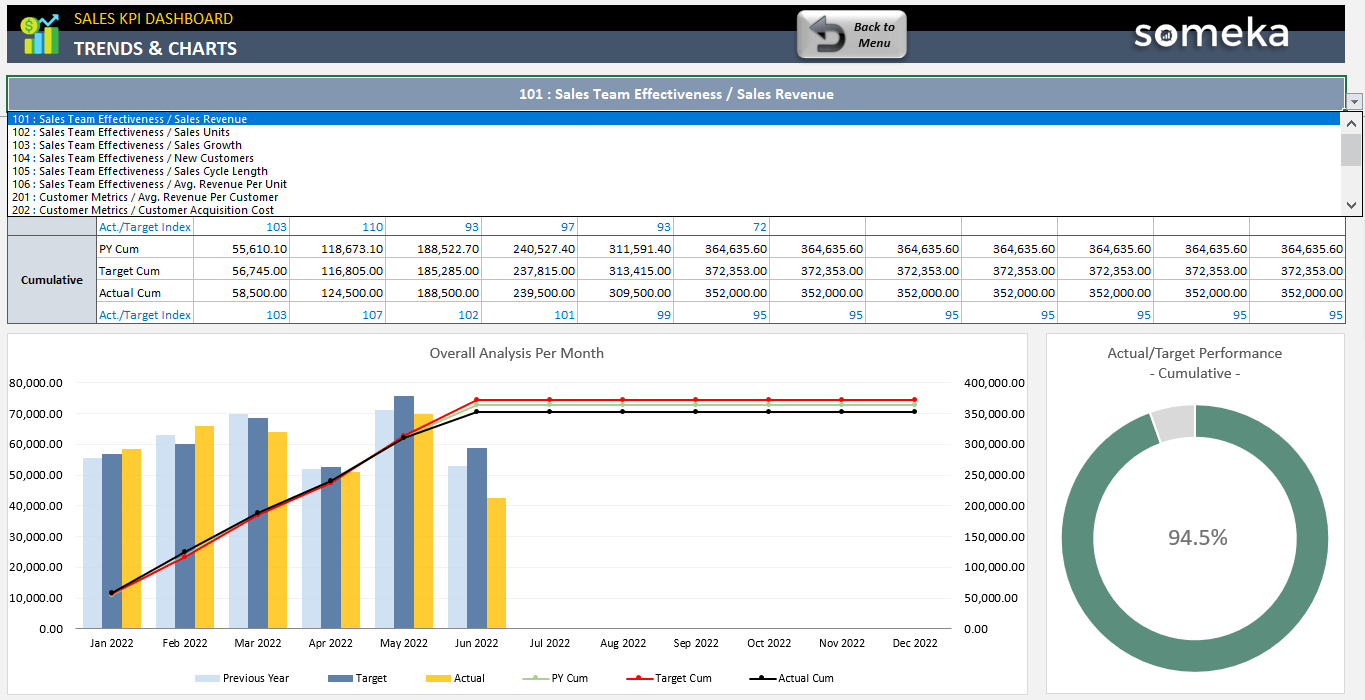
Hello my name is Sam I loved your template. It is very useful and complete but i have a problem i can’t visualize all the metrics it only shows sales/revenues can you help me
Someka –
Hi Sam,
Thank you for your feedback. Have a look at the image below to see how to show all the other metrics in your sheet.
It’s easy, just click on the top dropdown box in the ‘charts’ tab and select the metrics you want to visualize in the tab. Hope it helps
Davey D –
Nice!
team what is the difference between your licenses?
Should I change my su to mu ? because I want to use this with my manager?
Someka –
Hi Davey,
About our license details, our single-user license is for personal use only. With the multi-use license, you will have the right to share the file with your colleagues in the same organization and/or put your file on your company’s network for internal use.
But you will still not be allowed to put it on websites with public access or re-sell them or share them with third parties.
To learn more about our license details, please click here.
Brande Aiken –
Highlight of the changes of act/py and act/trgt with colors (green, yellow, red) was visually satisfied us when we check the changes between them and make analysis. Thank you very much Someka!
Somnath Bankar –
Is work with Google sheet?
Someka –
Hi Somnath,
Thanks a lot for your interest!
You can visit this page to learn it in detail. Do your templates work with Google Sheets or OpenOffice?
Best regards,
Michelle Delane –
Good template but wish you would provide a free trial before the purchase.
Someka –
Hi Michelle! Thank you for your feedback! Since we don’t provide free trials of product, we try to explain all our products in very detailed product descriptions and videos!
Kavisha Tenet –
Support is professional and timely. always does the job as described. clear communication and always goes above and beyond in their work. I highly recommend Someka for everyone