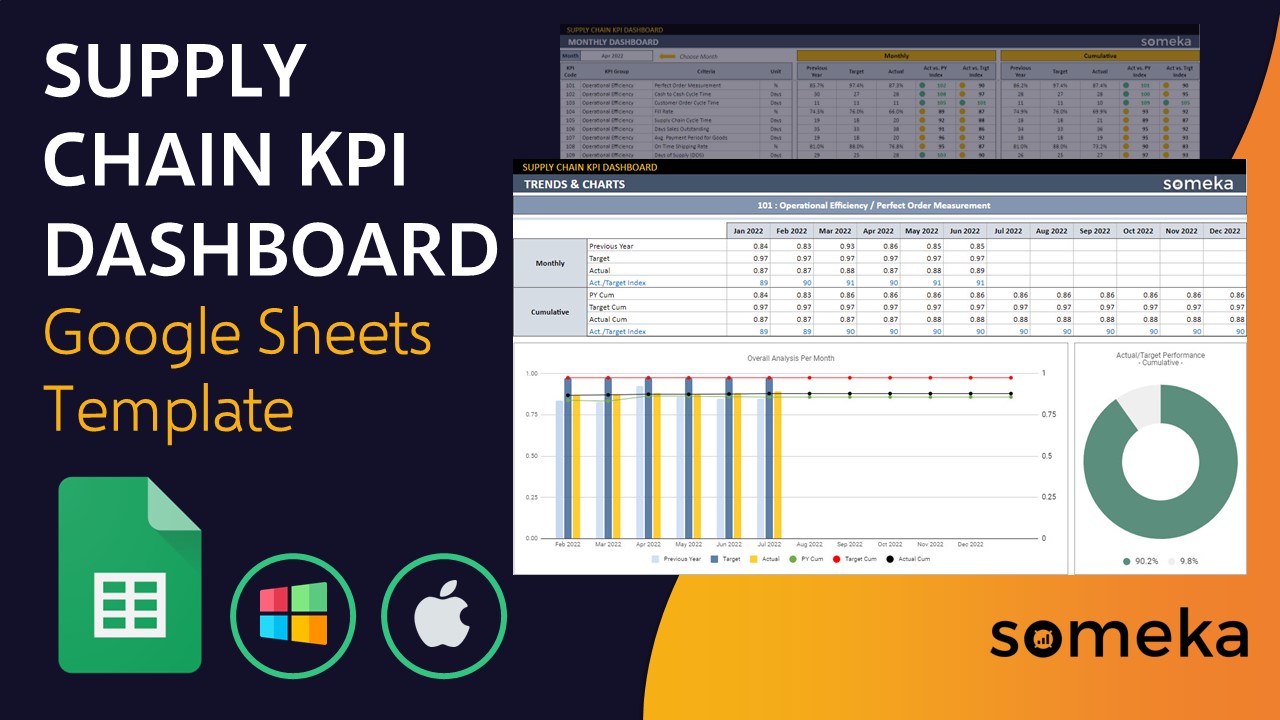
Supply Chain KPI Dashboard Google Sheets Template
Google Sheets KPI Dashboard for logistics. Track and analyze monthly performance metrics of your supply chain operations. Comparison charts included.
TEMPLATE DESCRIPTION
Are you having trouble measuring and monitoring your process in logistics? So, all you need is this Supply Chain KPI Dashboard Google Sheets Template! We designed this template for you to track KPIs in supply chain, logistics, transport and warehouse operations.
You will not have any other problems with goal setting and analyzing results with this all-in-one tool.
So, what advantages does the Supply Chain KPI Dashboard Google Sheets Template offer?
- Check the graphs and charts of each indicator to make better informed decisions
- Improve your relationship with suppliers and logistics businesses
- Have a more agile business by being aware of all critical supply chain process elements
- Reduce inventory and overhead expenses
Key performance indicators for Logistics
You should always track your KPI and also OKR (Objectives and Key Results) metrics for a sustainable business. KPIs are used to maintain operational stability and monitor day-to-day activities, while OKRs are used to drive innovation, set challenging goals, and ensure alignment with strategic objectives.

Here are some examples from preset KPI metrics in the template:
- Rate of on-time delivery: The percentage of orders delivered on or before the original predicted delivery date is known as the on-time delivery rate. In a world where customer happiness is dependent on fast delivery, this KPI shows how effectively you are satisfying your customers’ expectations.
- Order fulfillment rate: The number of successfully filled orders in the initial shipment, without the need for additional shipments, is known as the order fill rate. It’s a critical KPI for monitoring the efficiency of your supply chain activities significantly.
- Cycle Time for Customer Orders: Customer order cycle time provides crucial information on product service and supply chain responsiveness. It illustrates the time between receiving a purchase order from a client and effectively delivering the order to the consumer.
There are also more preset KPIs including but not limited to holding costs, inventory turnover, or lead times. Additionally, you are able to add new KPIs based on your particular needs using this Google Sheets template for the Supply Chain KPI Dashboard.
Sections of Supply Chain KPI Dashboard Google Sheets Template
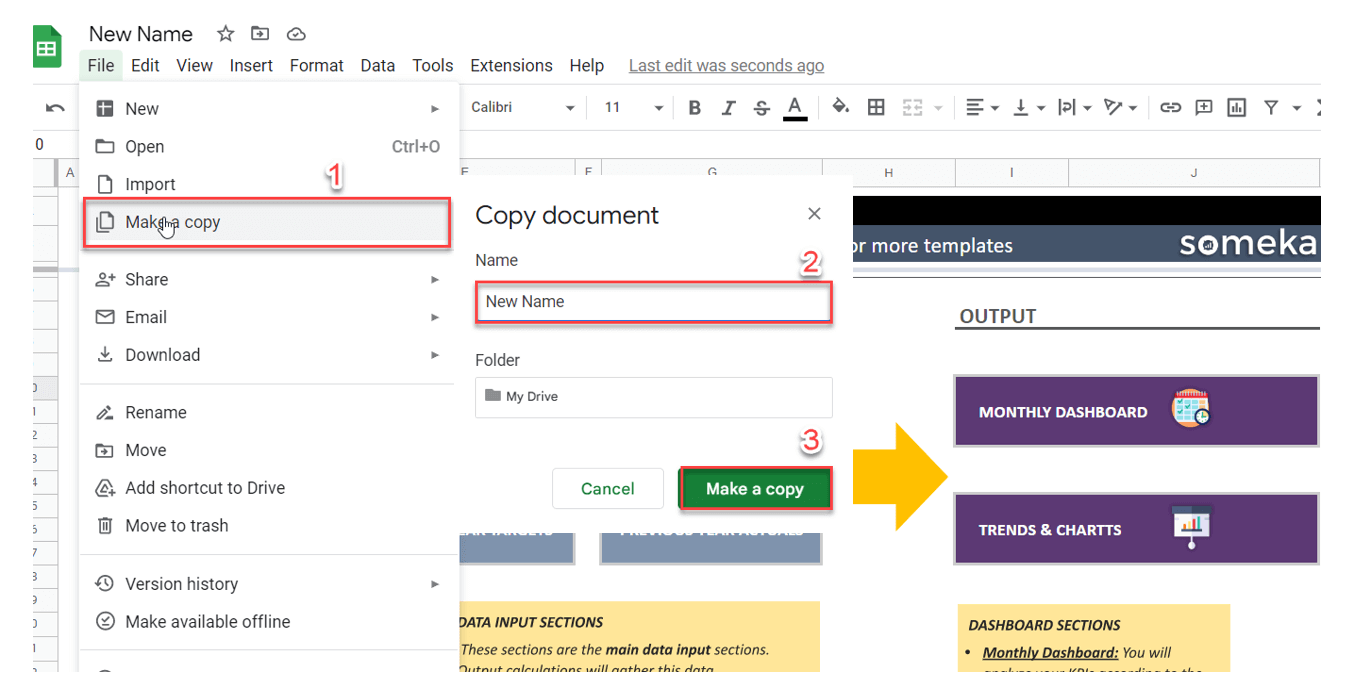
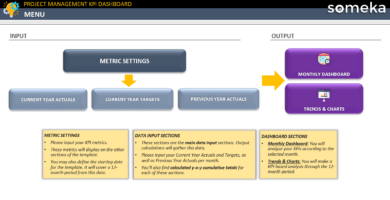
Basically, when you open the template, you’ll notice the dashboard menu, which will take you to various parts. This area allows you to quickly adjust your dashboard. The menu panel is divided into two sections: input and output.
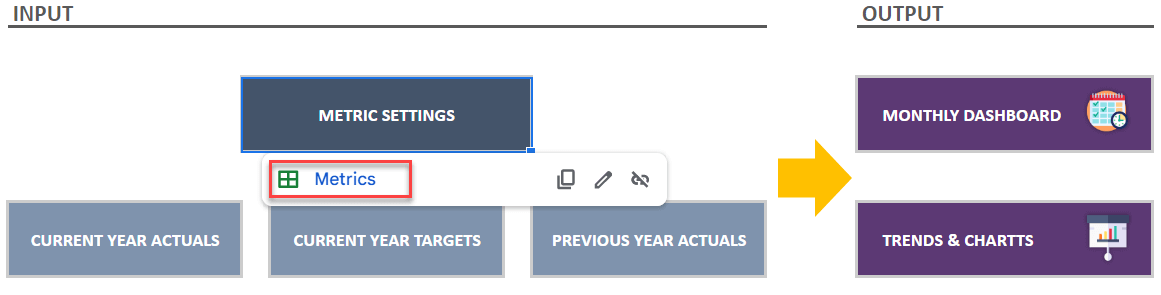
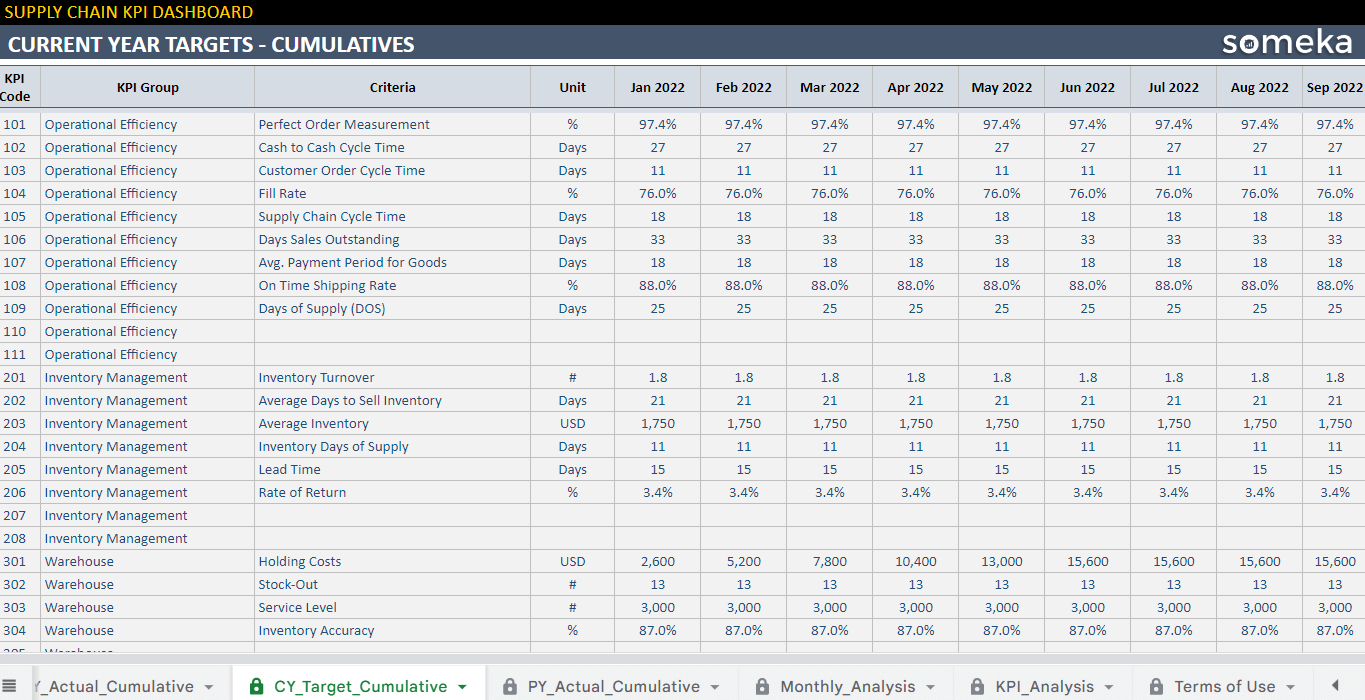
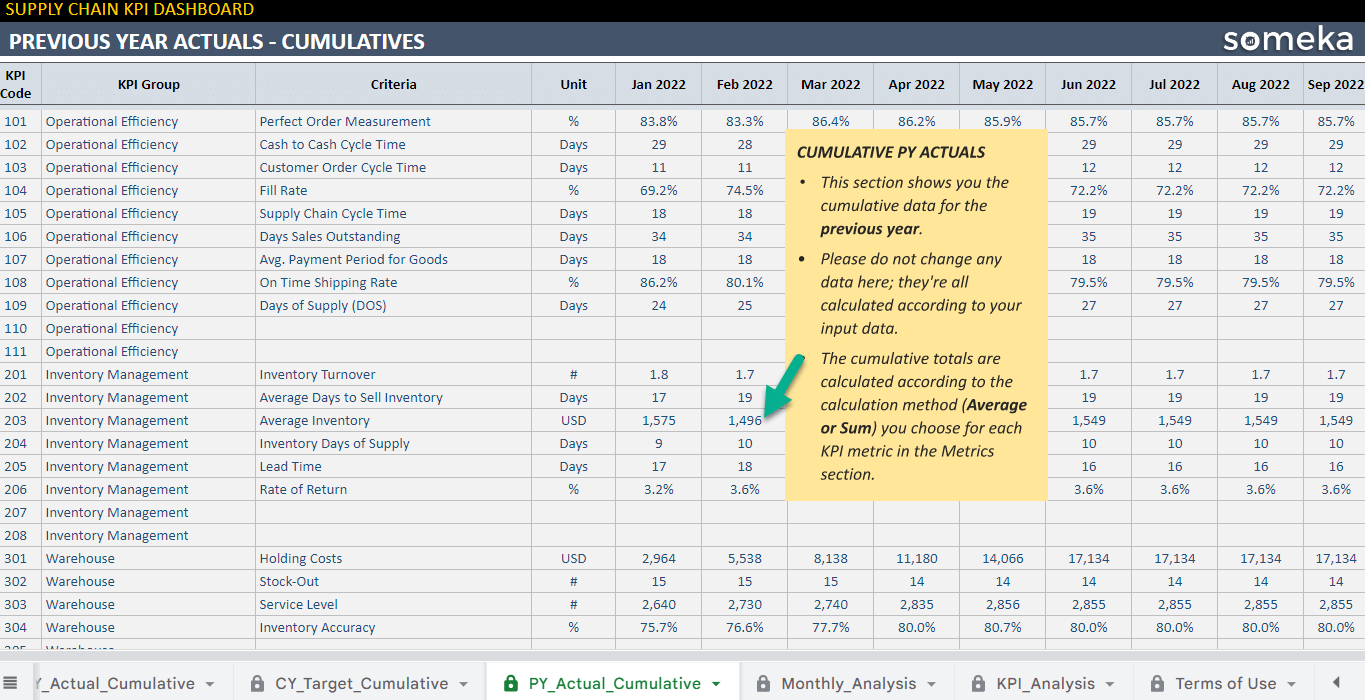
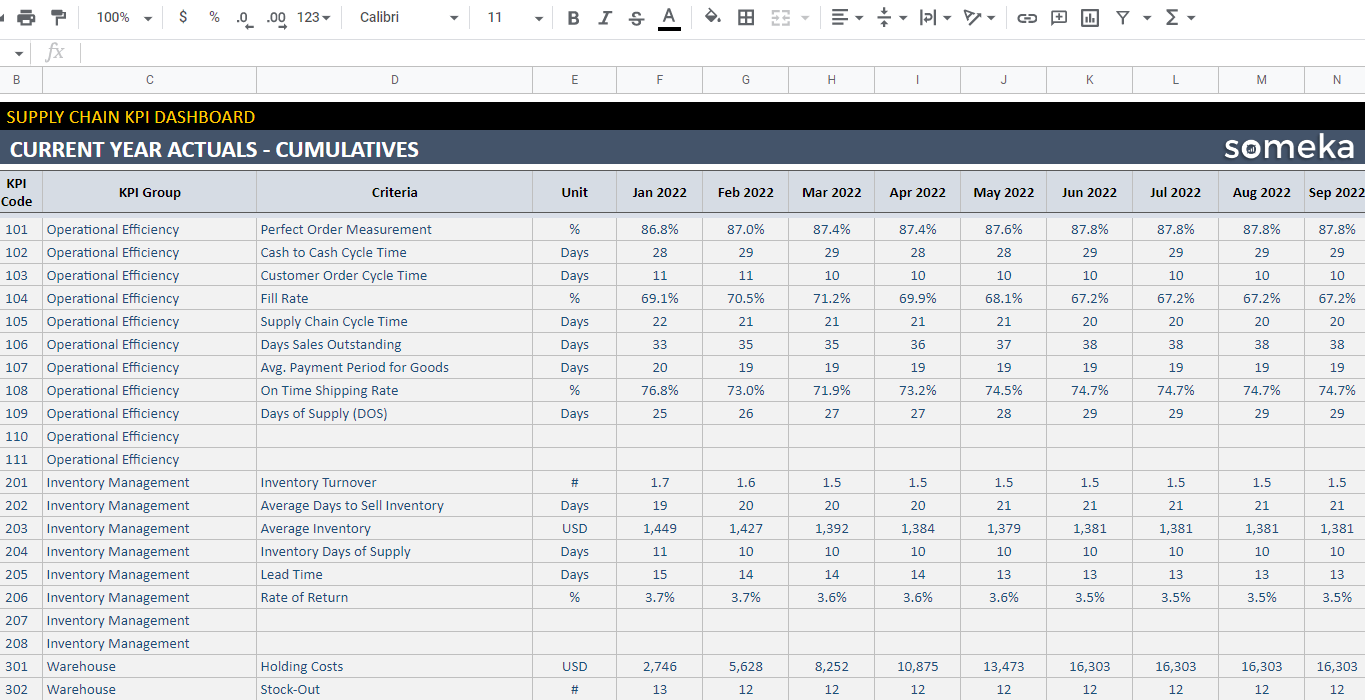
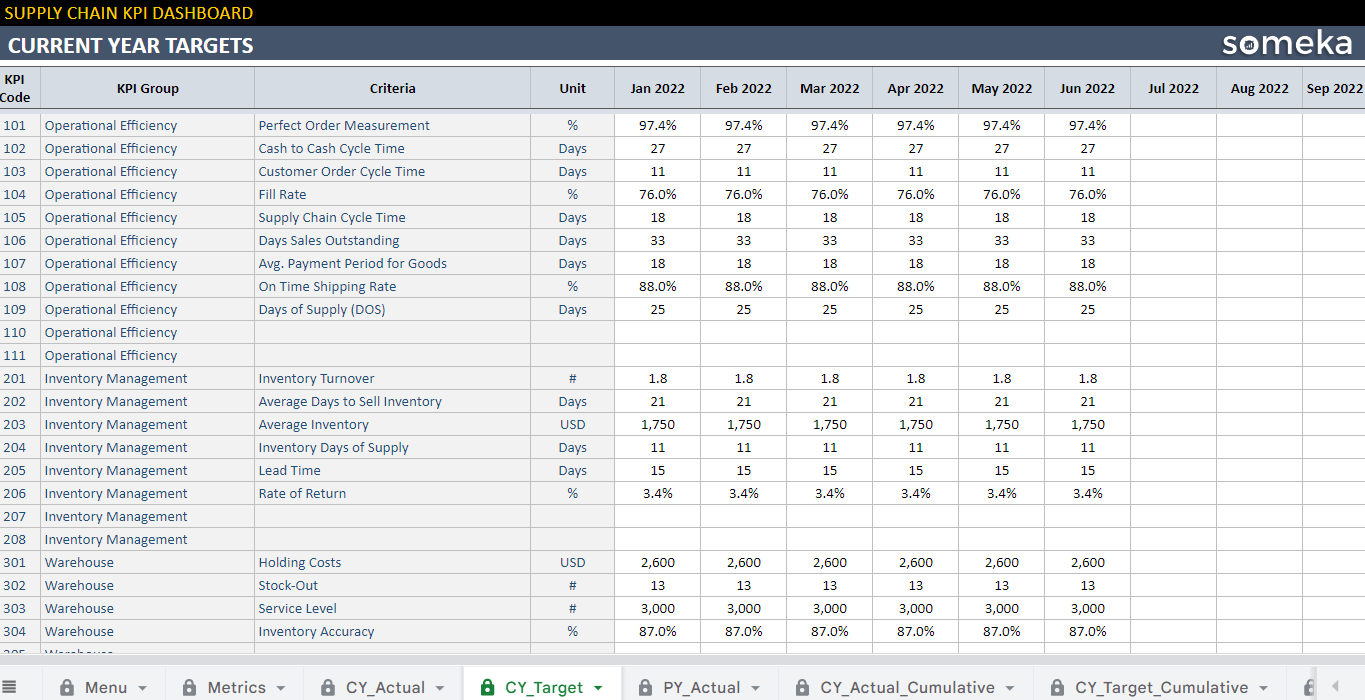
To clarify, the input area directs you to sections for data submission such as current year actuals, current year objectives, and prior year actuals. Also, the output area includes a monthly dashboard as well as trends and charts sections.
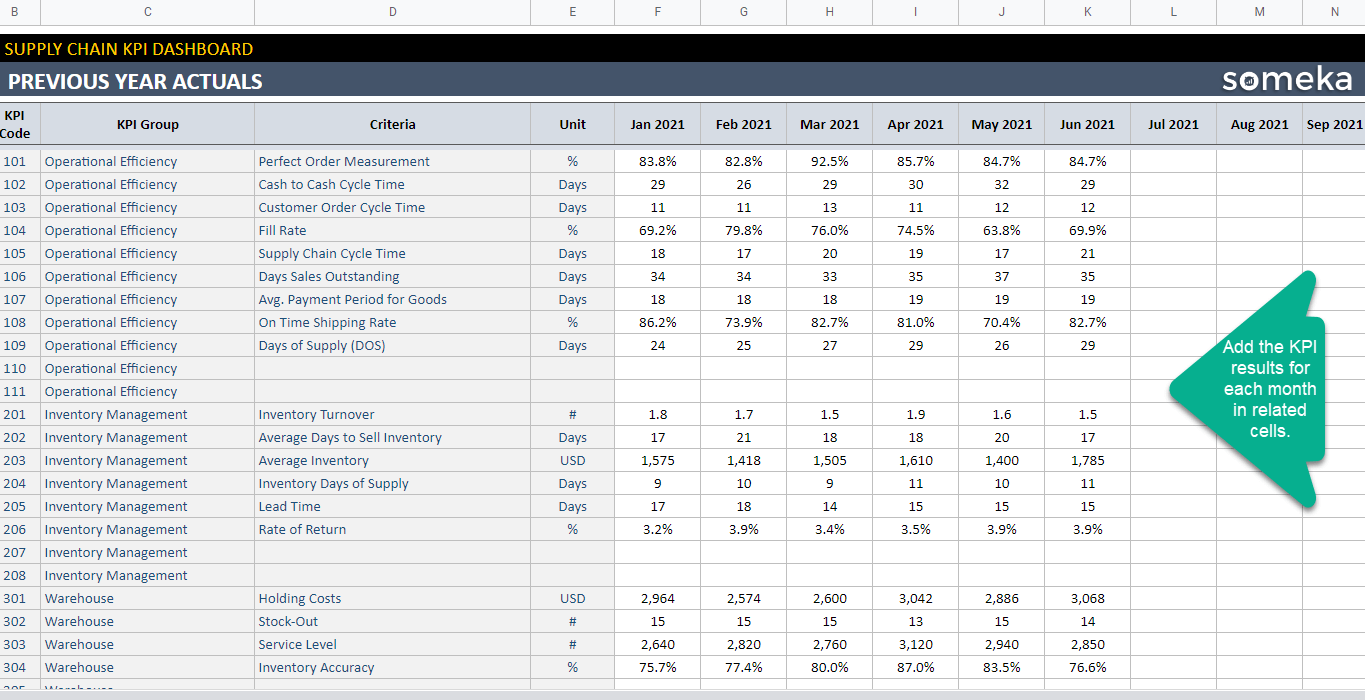
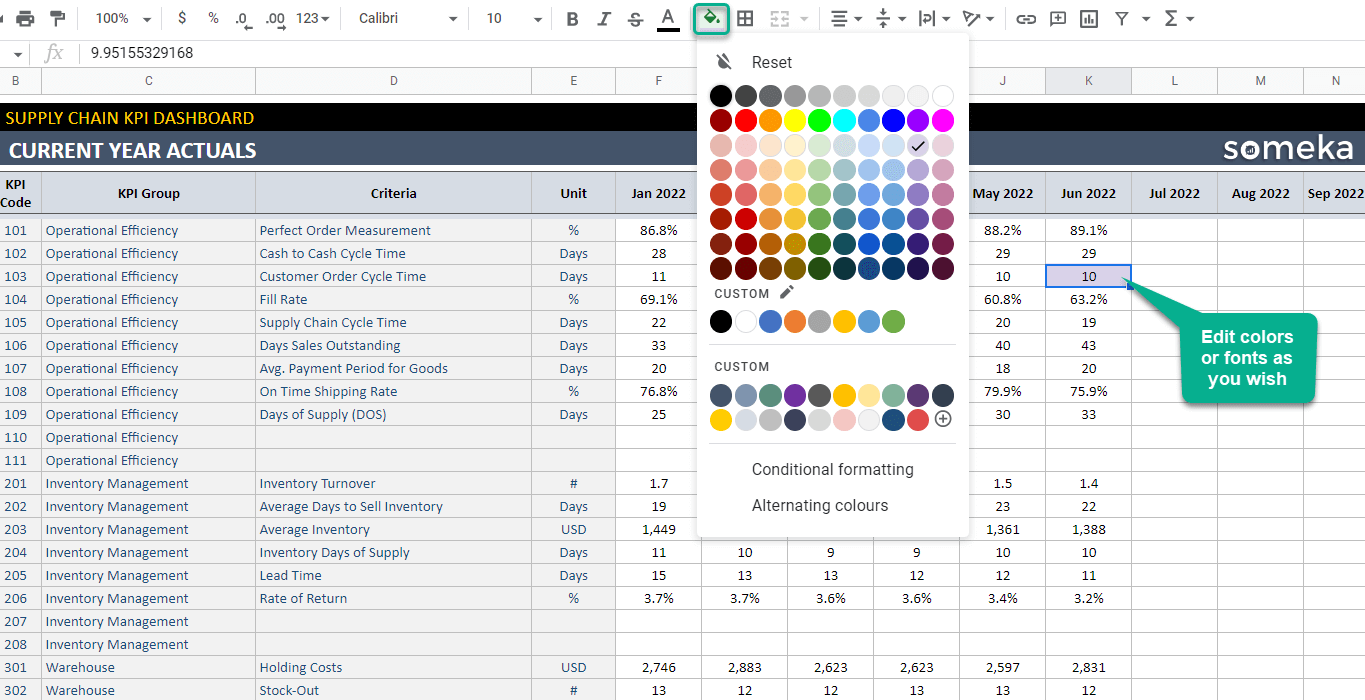
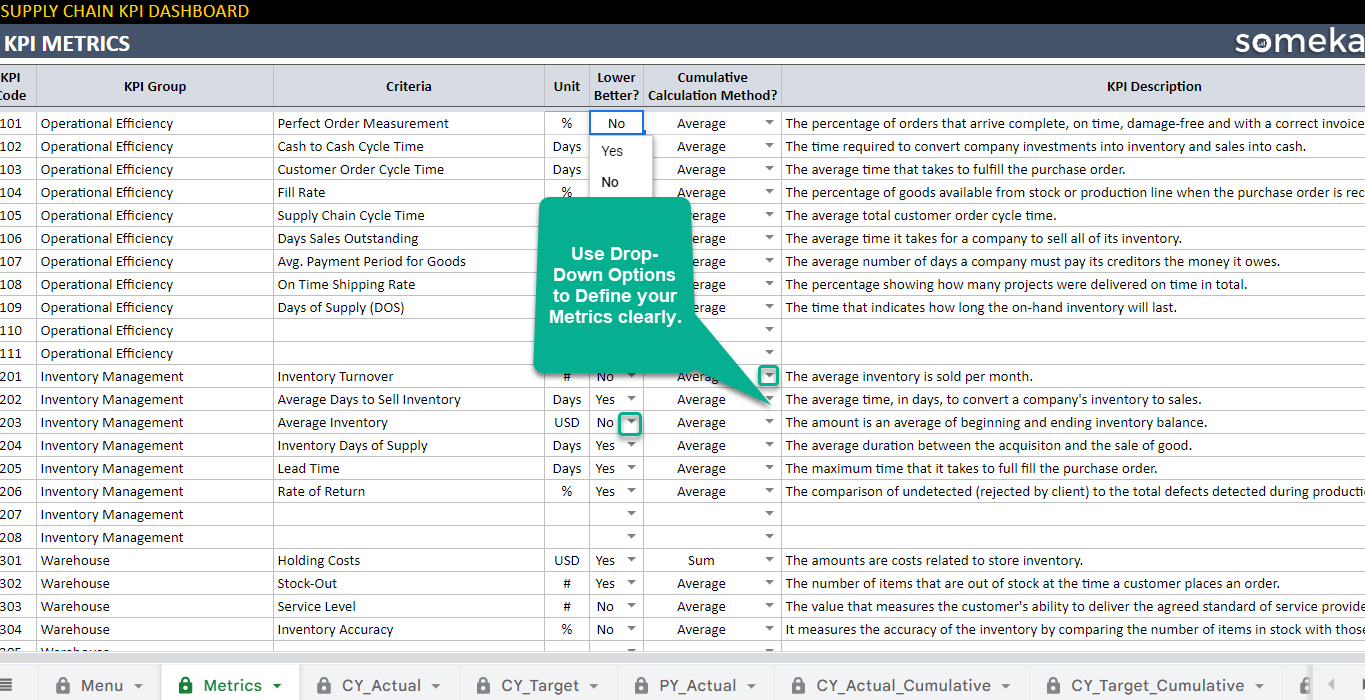
1. Key Performance Indicators sheet
Firstly, when you start inputting data into this Supply Chain KPI Dashboard Google Sheets, you will see some example data. Our developers have included these to assist you understand how everything works altogether. You may now begin collecting your own data and developing your KPI outcomes. You will also be able to include a KPI description for future reference.
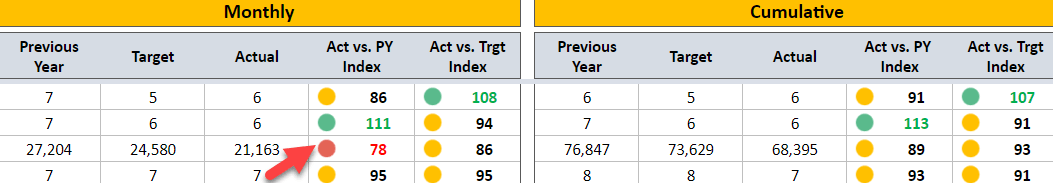
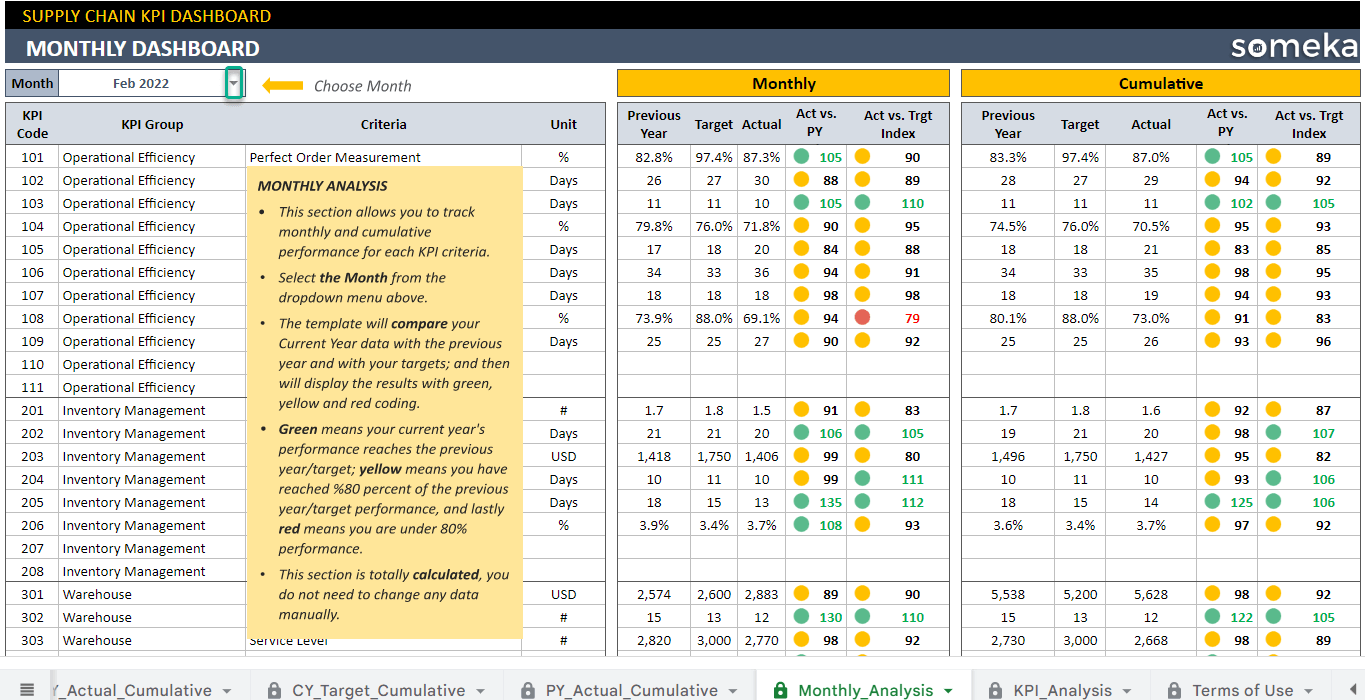
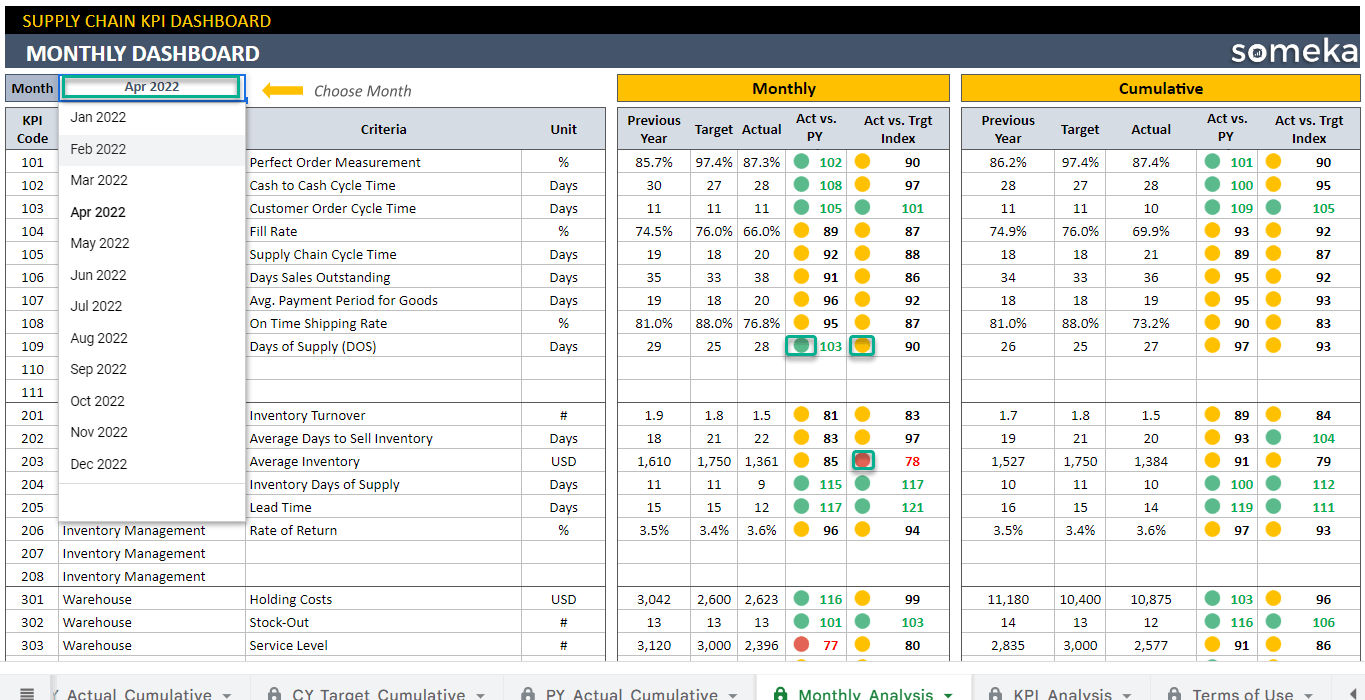
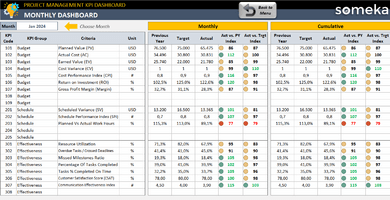
2. Monthly Summary
Secondly, the monthly dashboard area displays your performance and the impact it has on overall actuals and objectives. In addition, they are easily distinguished by three colors: green, yellow, and red.
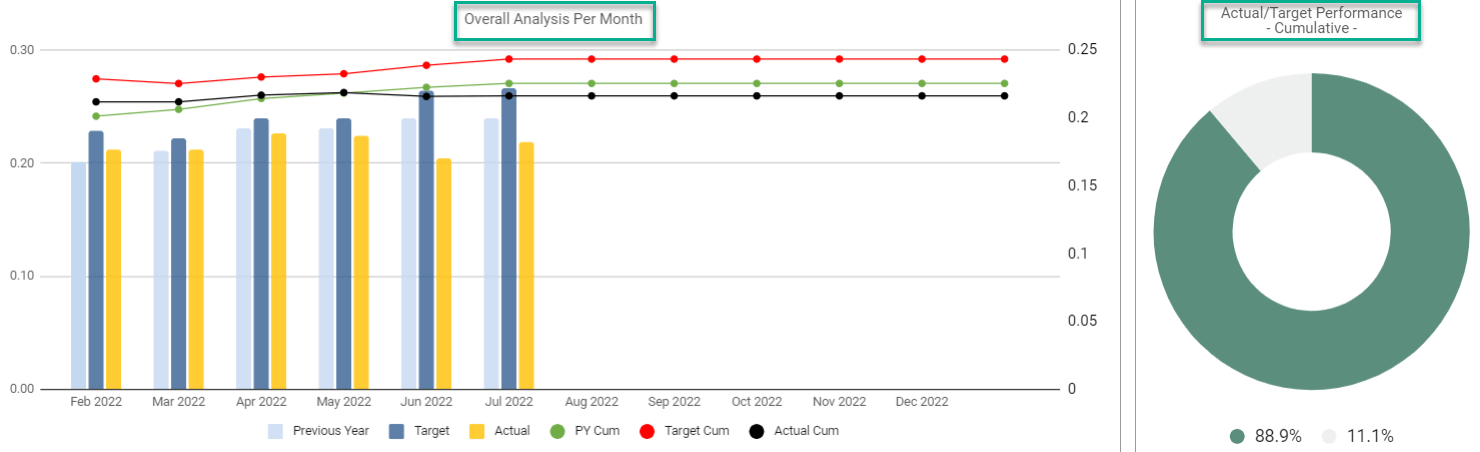
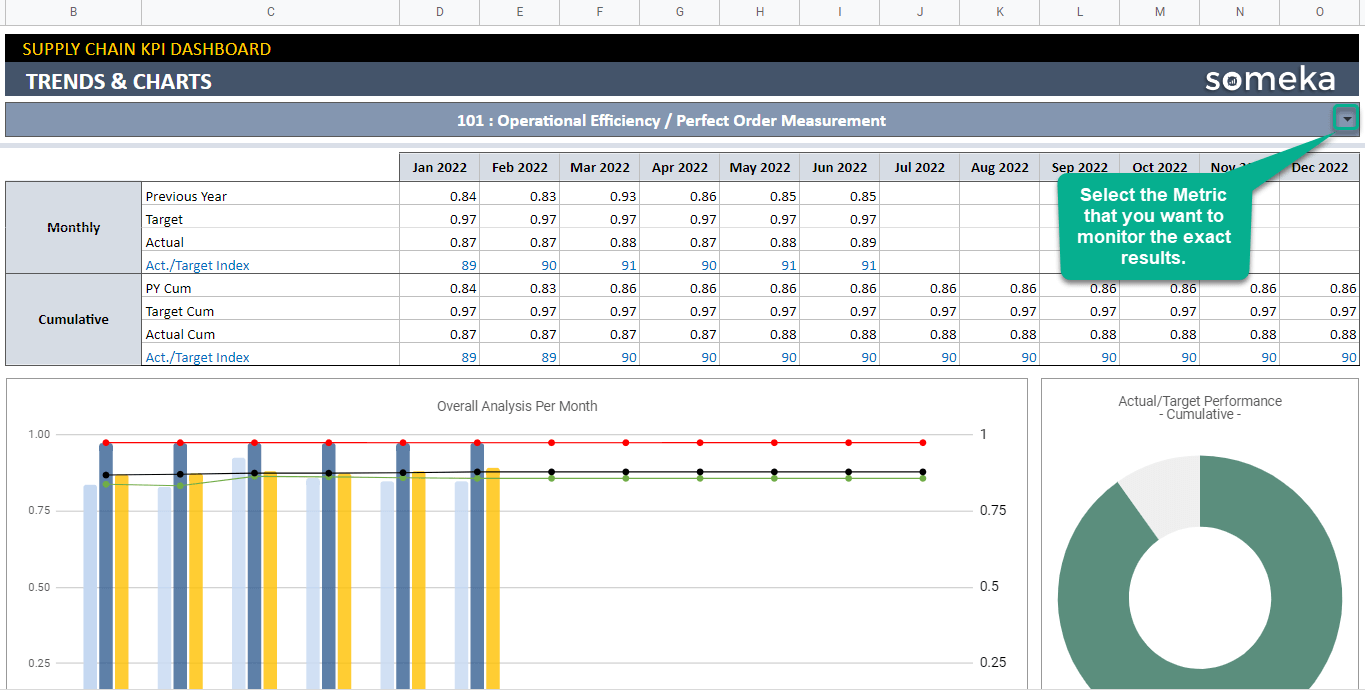
3. Trends and Charts
Finally, in this sheet every KPI’s monthly results are available for review. You can immediately see the results on diagram of the overall analysis. Besides, it is easier for you to comprehend and see your metrics outcomes.
Meanwhile, all you need is an internet connection and a Google account to get started. And everything will be in sync!
Supply Chain KPI Dashboard Google Sheets Template Features Summary:
- Supply Chain KPI Dashboard in Google Sheets
- Defining each metrics based on your Unit
- Check every KPI performance on a monthly basis
- Ready to Print template
- Informational notes included
- Ready to use template
- Works on any operating system
- Suitable for any device including mobile, tablet, desktop
GOOGLE SHEETS KPI DASHBOARDS COLLECTION
PRODUCT VIDEO
Watch the video below to see the template in action! Presentation also includes usage notes, explanations and tips & tricks about the template.
USER REVIEWS & COMMENTS
11 reviews for Supply Chain KPI Dashboard Google Sheets Template
You must be logged in to post a review.
RELATED TEMPLATES
-
 This product has multiple variants. The options may be chosen on the product page
Project Management KPI Dashboard Excel Template
$0.00 – $79.95Excel Project Management KPI Dashboard Template incorporates key metrics such as CPI and SV and provides comparisons with trend charts.
-
This product has multiple variants. The options may be chosen on the product page
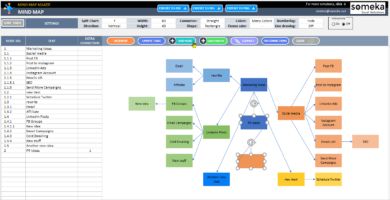
Mind Map Maker in Excel
$0.00 – $69.95Automated spreadsheet to create mind maps from Excel data! Connect and move boxes, add or remove branches. Printable. Works in Mac & Windows.
-
This product has multiple variants. The options may be chosen on the product page
Recruitment Tracker Excel Template
$0.00 – $79.95Recruitment Tracker Template in Excel. Ready-to-use applicant tracking system to help hiring process. Includes HR reports and dashboard. Works in Mac & Windows.
-
This product has multiple variants. The options may be chosen on the product page
Business Model Canvas Excel Template
$0.00 – $59.95Excel spreadsheet to create visual business plans. Summarize your key business factors on a lean canvas within minutes! Detailed guidance included.
-
This product has multiple variants. The options may be chosen on the product page
Sales Dashboard Excel Template
$0.00 – $69.95Interactive Sales Dashboard Template in Excel. Great tool for sales management. Features a dashboard with profitability, sales analysis and charts.
-
This product has multiple variants. The options may be chosen on the product page
Business Plan Excel Template
$0.00 – $69.95Excel spreadsheet to prepare professional design business plans. Present your company with a printable and clear plan. With step-by-step guide.

Jeff D.N. –
Awesome work, rapid customer support!!
Jerry Z. –
I tried to customize it for my bookshop chain, but it became too difficult for me.
Alex Kimmonse –
This template is superb; it’s compact, fast, customizable, and cost effective.
Malcom Humm –
This appears to be very trendy. and direct. Even so, I have a question: Could you please clarify how I can add my company name and logo?
Someka –
Hello Malcom,
Sure! Please check this guide to see how to add your own branding for Google Sheets:
Removing Logo
Hope this helps!
Lizzie Delgado –
Wonderfull!
Maggie J. –
Thanks for the detailed tool. No way witout buy!!
Ronney –
The template seems OK. How can I check it before downloading? Please help!!!
Someka –
Dear Ronney,
Do you want to see the product video? We have already showcased all of the template’s features.
I hope this helps!
Kelsey Ingram –
I purchased the template. I accidently removed some formulas in the “Cumulative” tabs while trying to discover. Is it possible for me to re-download the file?
Someka –
Hello Kelsey
Without a doubt! We have just emailed it to you. If you check your email, you will see a link to download the new file.
Best.
Jimenez –
Is there a way remove KPI’s not necessary ones in the template without affecting the rest???
Someka –
Hello Jimenez
Sure, you may remove unnecessary KPIs from the template.
Keep this in mind! Only the Current Year Actual, Current Year Target, and Previous Year Actual sheets should be deleted. Please avoid trying to delete anything from the dashboard or grey cells.
I hope that helps!
Frida Perron –
We remain in charge of places due to your dashboard. Data analysis is simple for any moment, anytime!!!
Violet Mallory –
Great job!
The dashboard displays our data as montlhy and cumulative, however Id like to compare quarterly montlhy and cumulative data.
We usually analyze our data quartelry when comparing it to montlhy and cumulative statistics. How can I create a new quarterly data sectionn? Could you just do it for me?
Someka –
Hello Violet
Thank you very much!
The current template has been created to show the “monthly” results and analysis.
We’ve considered your suggestions into consideration when making future updates. Or you can contact us for custom needs: contact@someka.net