US Sales Map Excel Template
Sales territory mapping tool for USA. Create printable sales heat map for states with optional settings. No installation needed. All in Excel.

TEMPLATE DESCRIPTION
As a sales professional, you already know the importance of reporting and analytics. Thus, you need to create a clear sales report that gives you all the critical details about your sales team. That’s why US Sales Map Excel Template presents very detailed visualized data that tells you everything you need.
Furthermore, by using this ready-to-use sales report template you will analyze your data correctly and make well-informed decisions.
US Sales Map Excel Template Features:
Basically, this United States sales template consists of 3 main sections:
-
- Sales Summary Dashboard
- Targets
- Sales Data
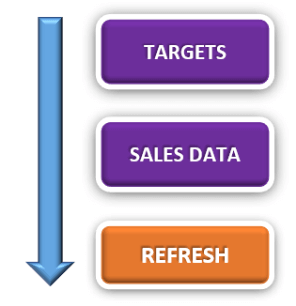
In general, the flow of the template is:
- Firstly, define your targets per salesperson and per state in the “Targets” section.
- Then, simply input your sales/invoices to the “Sales Data” section.
- Lastly, click the “REFRESH” button after you make your inputs and go on your Dashboard!
Then, let’s start with reviewing the Sales Summary Dashboard of the template.
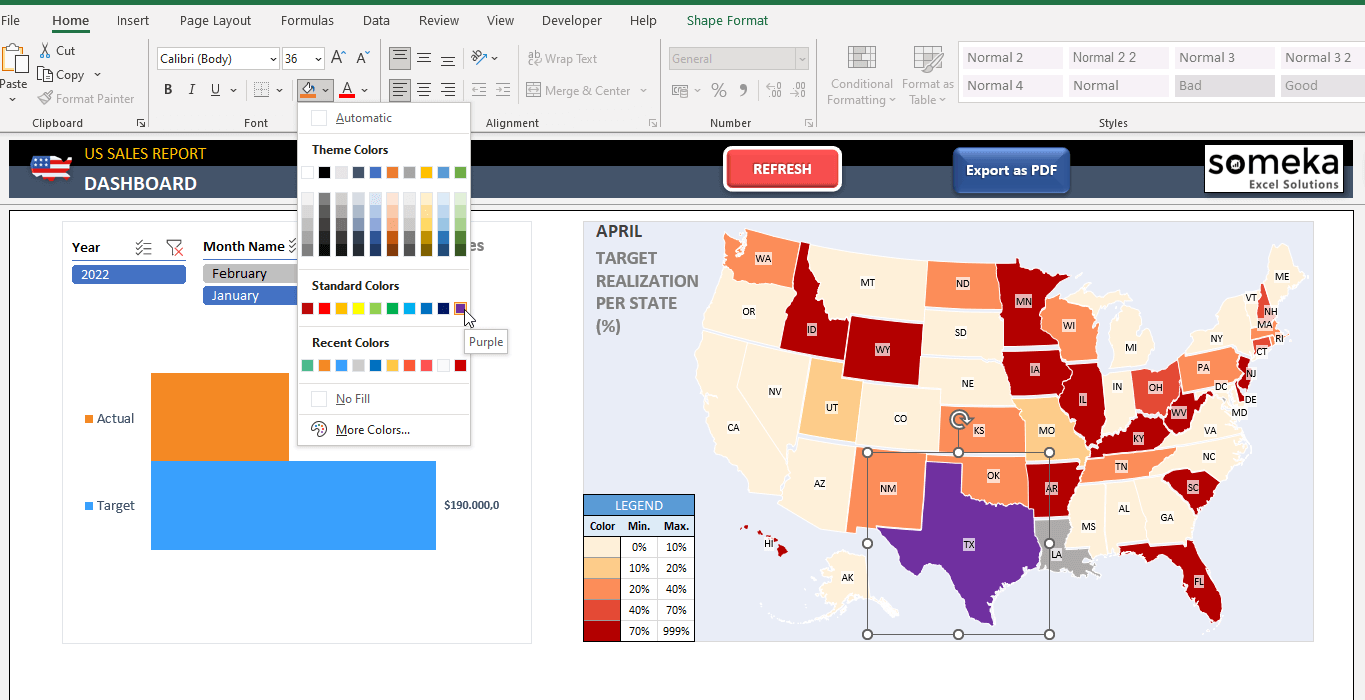
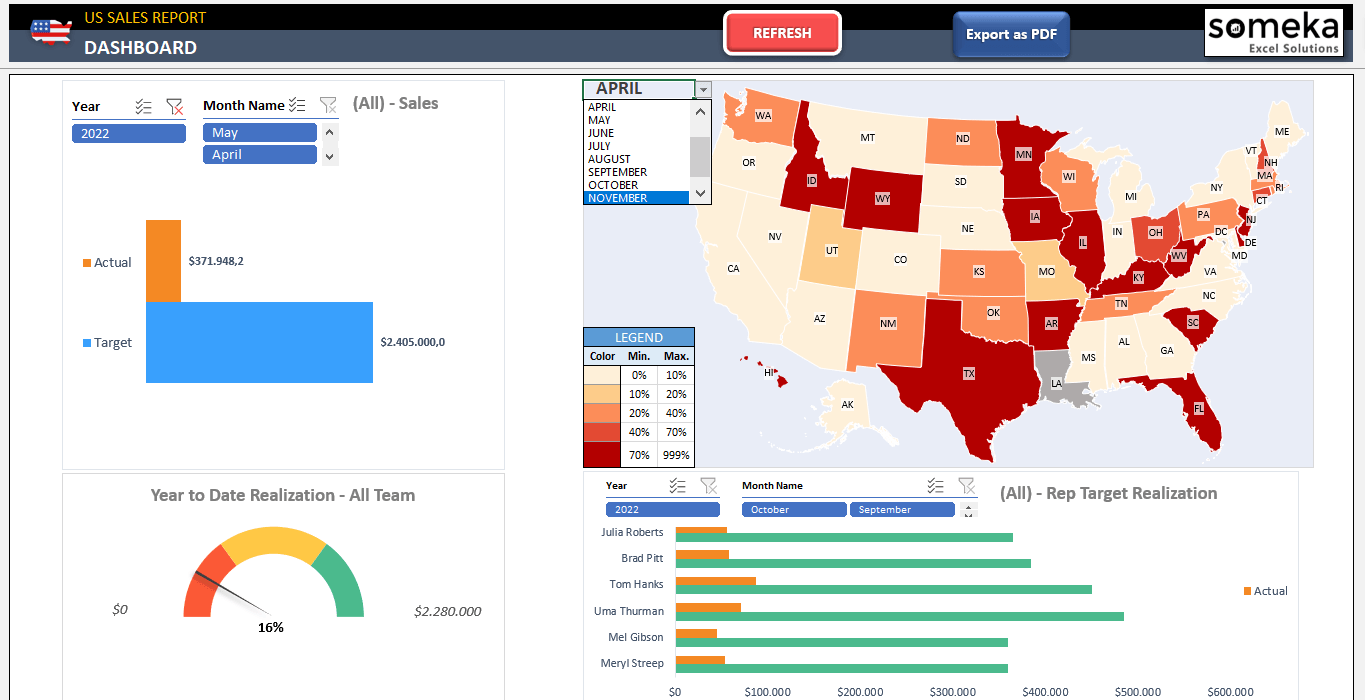
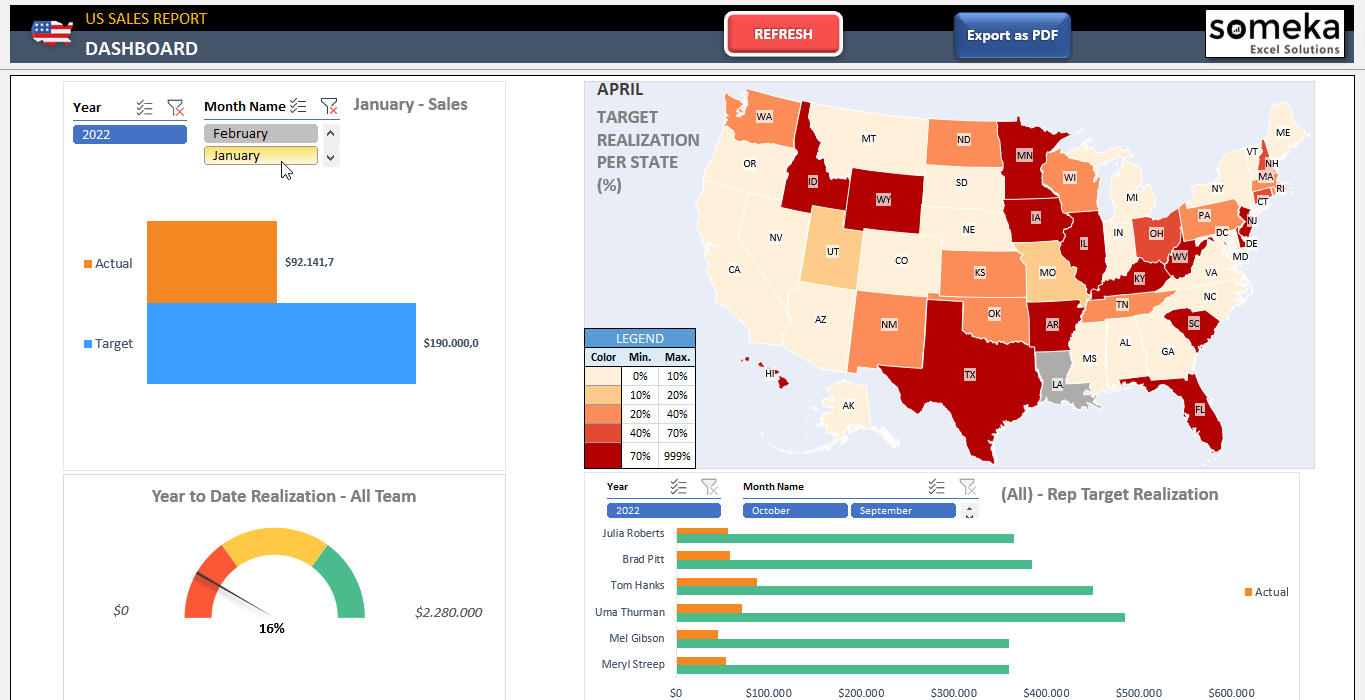
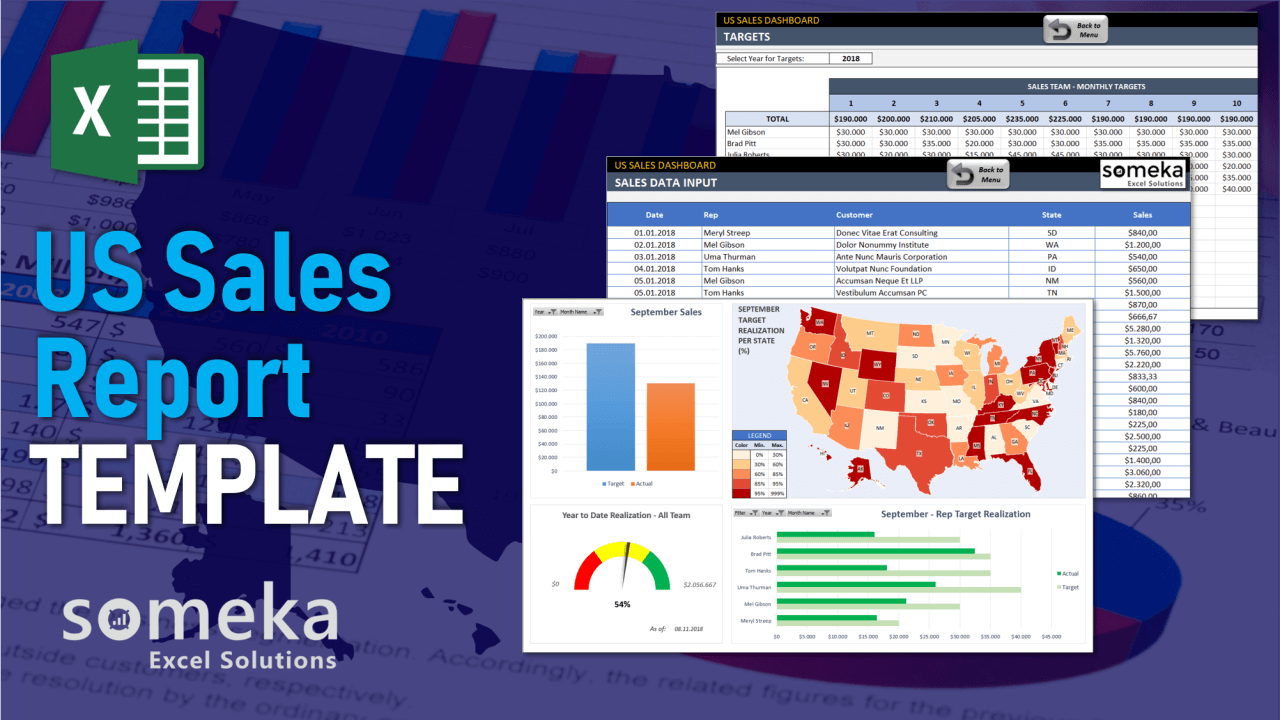
Sales Map Excel Template Summary Dashboard
Above all, you will have 4 different visual graphics that present your sales performance. In addition, after you input your targets and sales data, the dashboard will visualize all your United States realizations with a sales heat map.
By the way, you can customize your dashboard because each chart is provided with a month selector. You can either choose an individual month or multiple months.
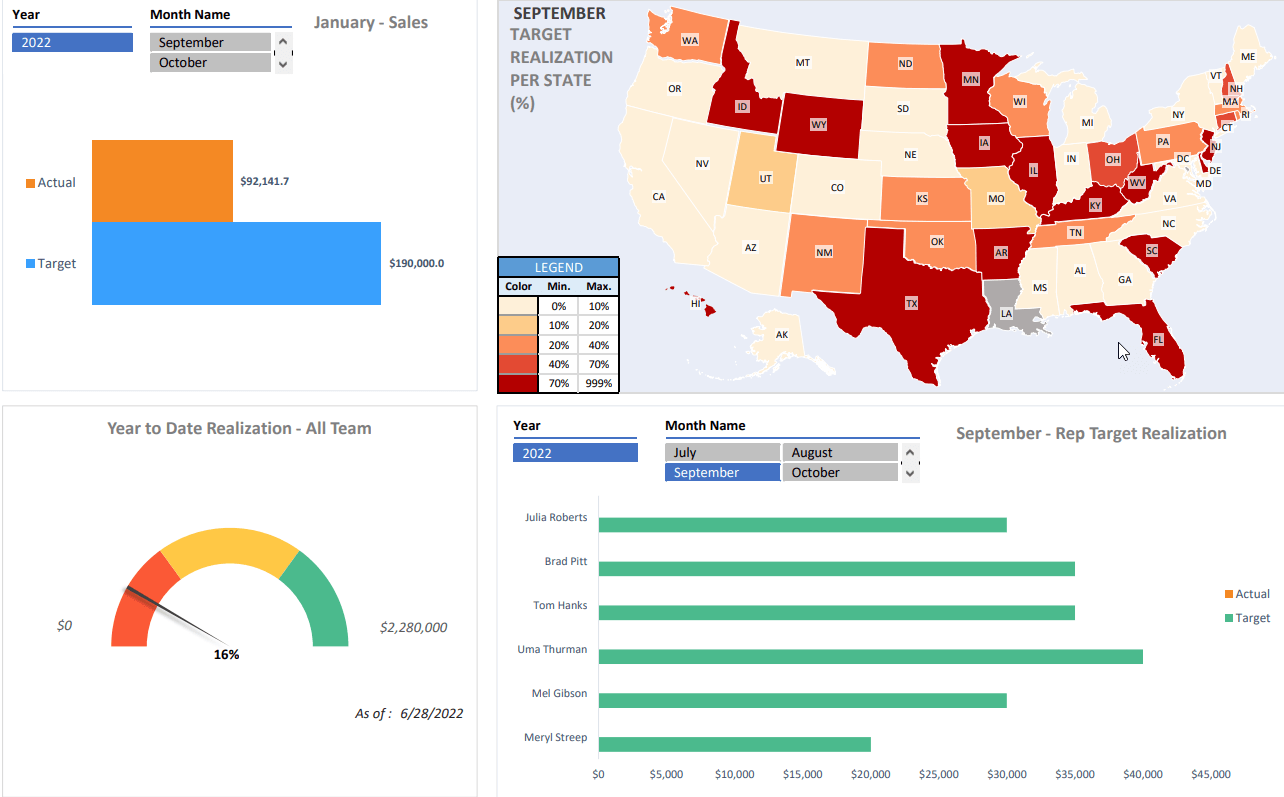
Furthermore, in Year to Date Realization, the “As of”date is designed to measure all team performance until today’s date. But you can select a specific end date to see your performance at a certain time period.
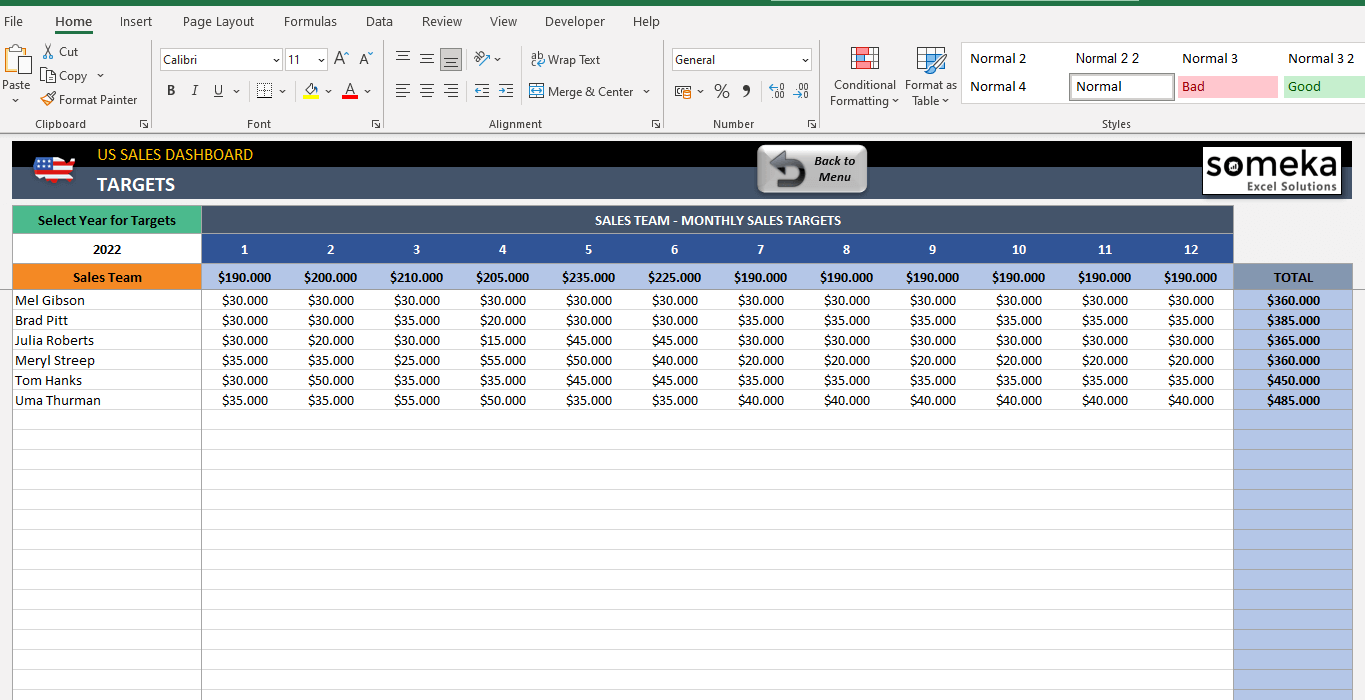
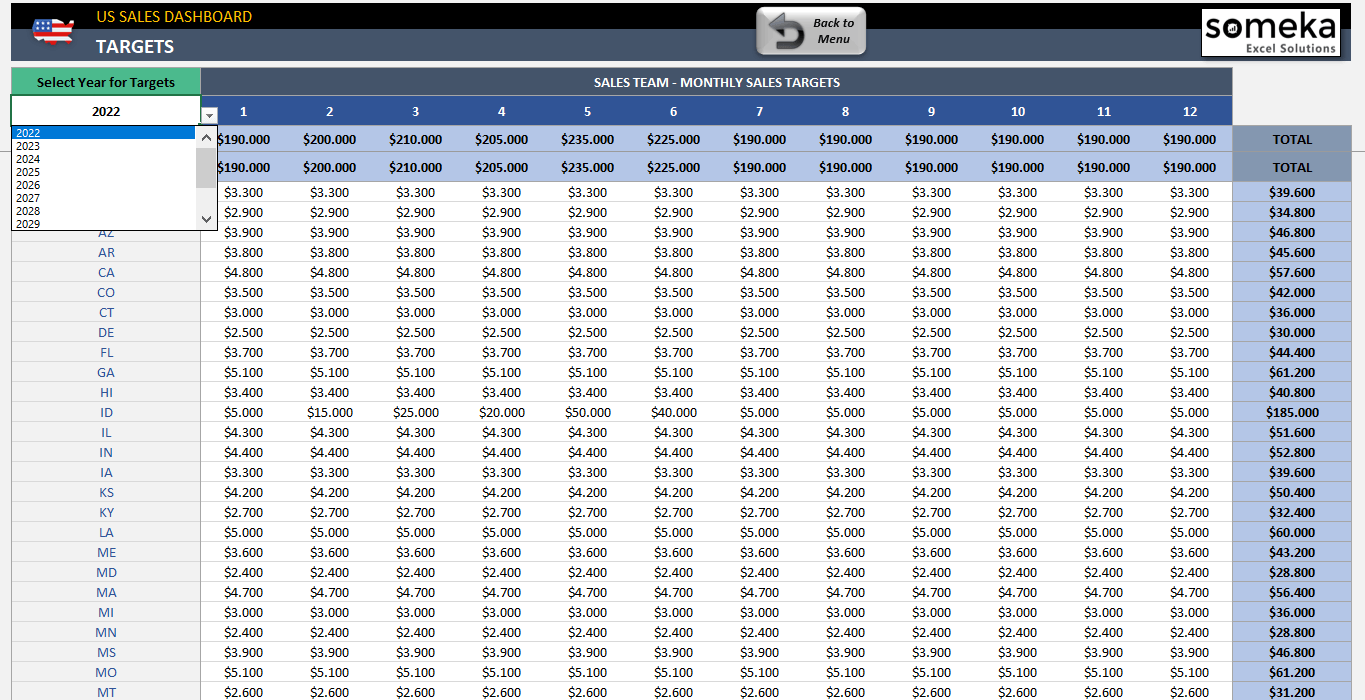
Targets
Achieving your sales target is the primary goal of your business. Therefore, you need to input a sales target for each rep in your team. In this section of the US Sales Map Excel Template, there are two different input tables.
Sales Team – Monthly Target: Input here your Sales Reps and their monthly sales targets on a monthly basis. But first of all, you should select a year for the targets you want to input (this tool covers yearly realization).
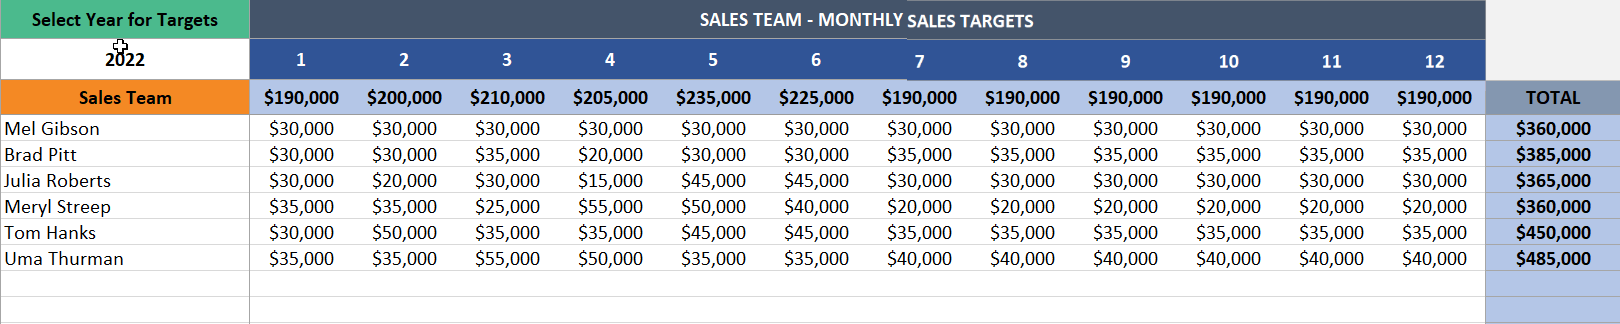
Moreover, you can add new salespeople up to 16.
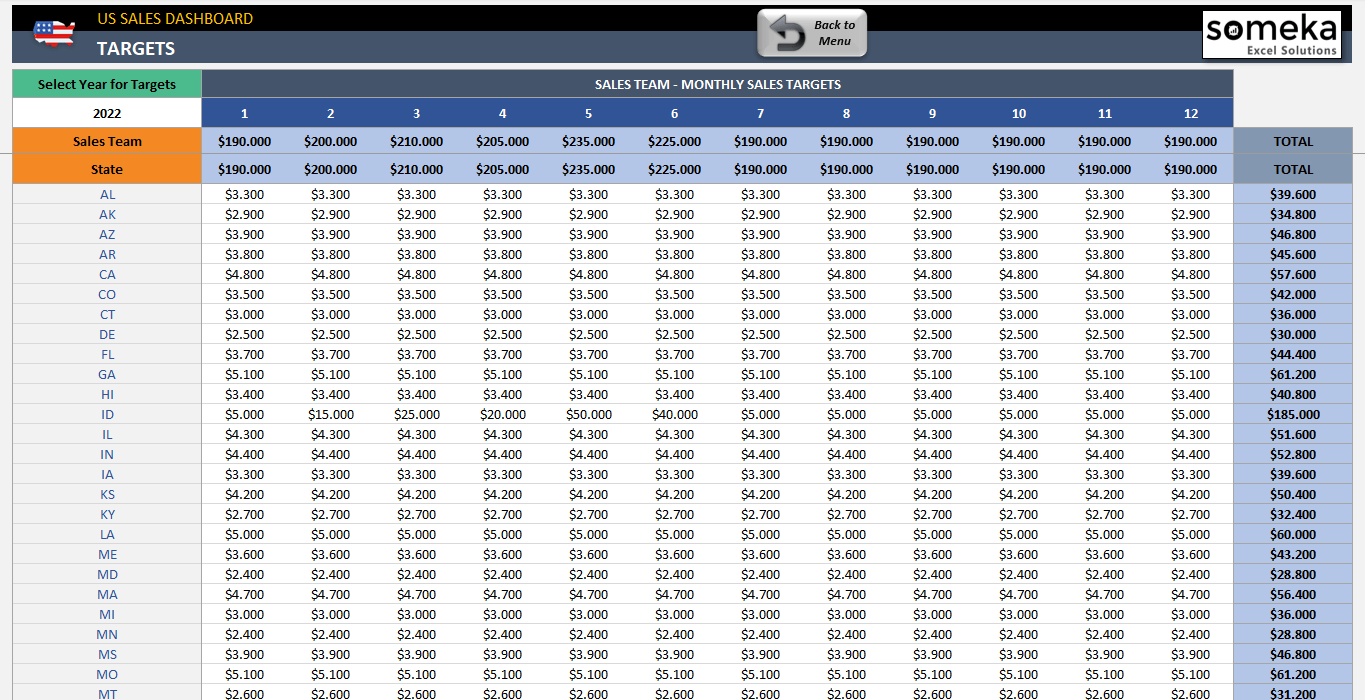
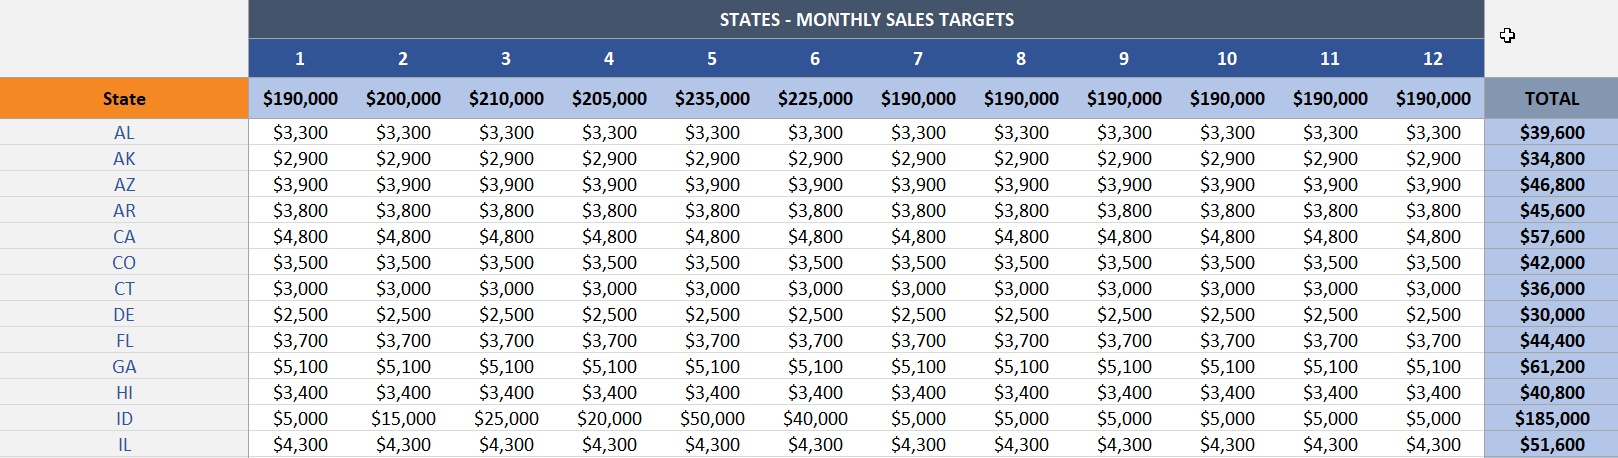
States – Monthly Sales Targets: Input here your total sales performance of each state on monthly basis.
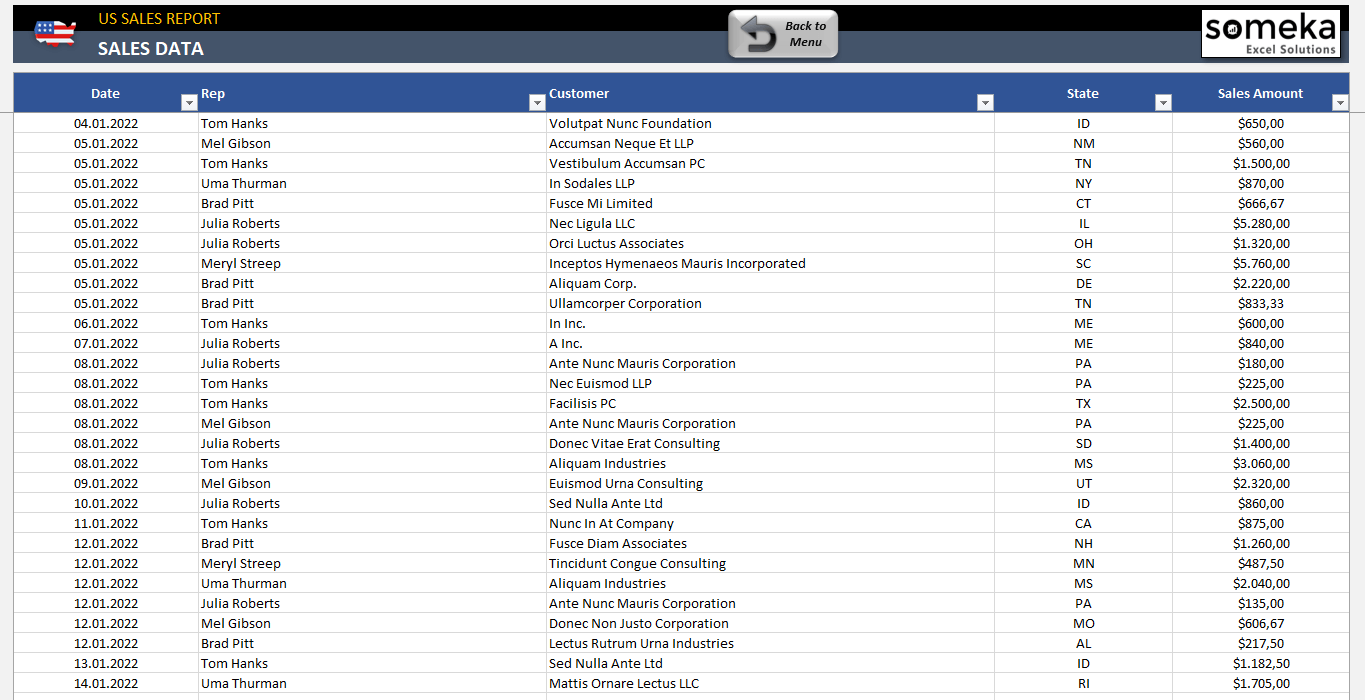
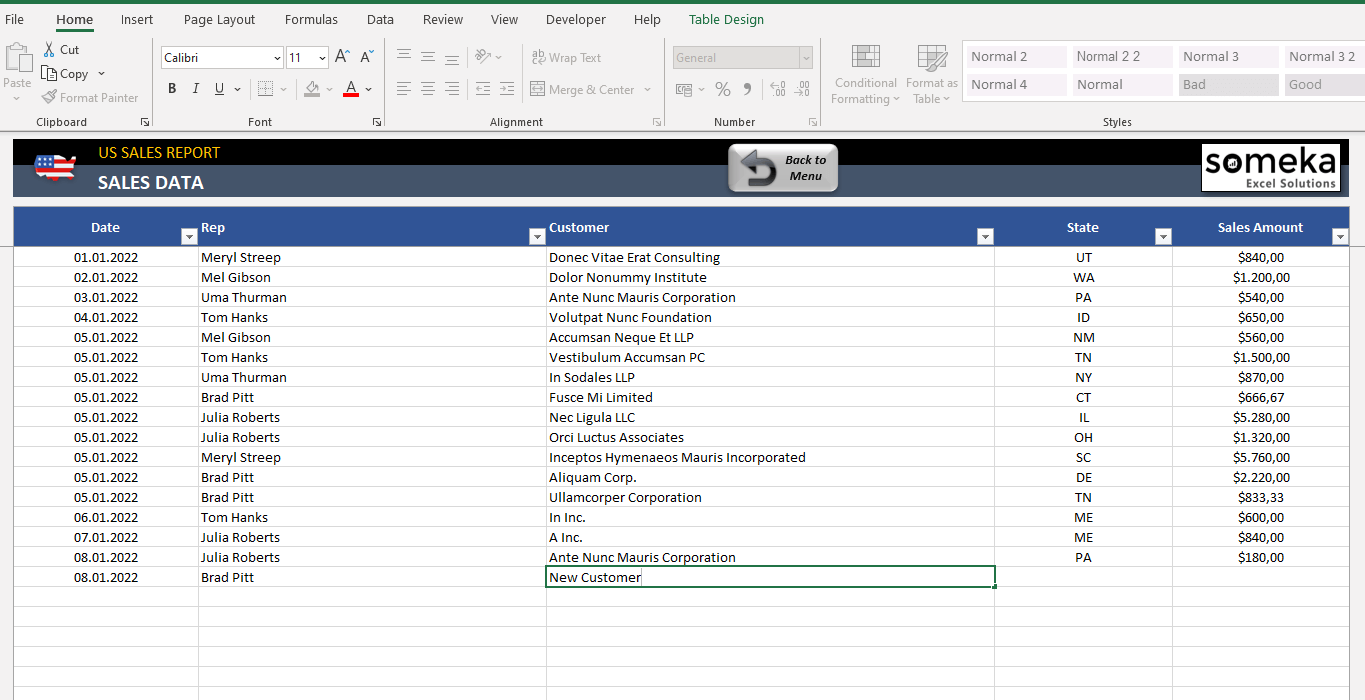
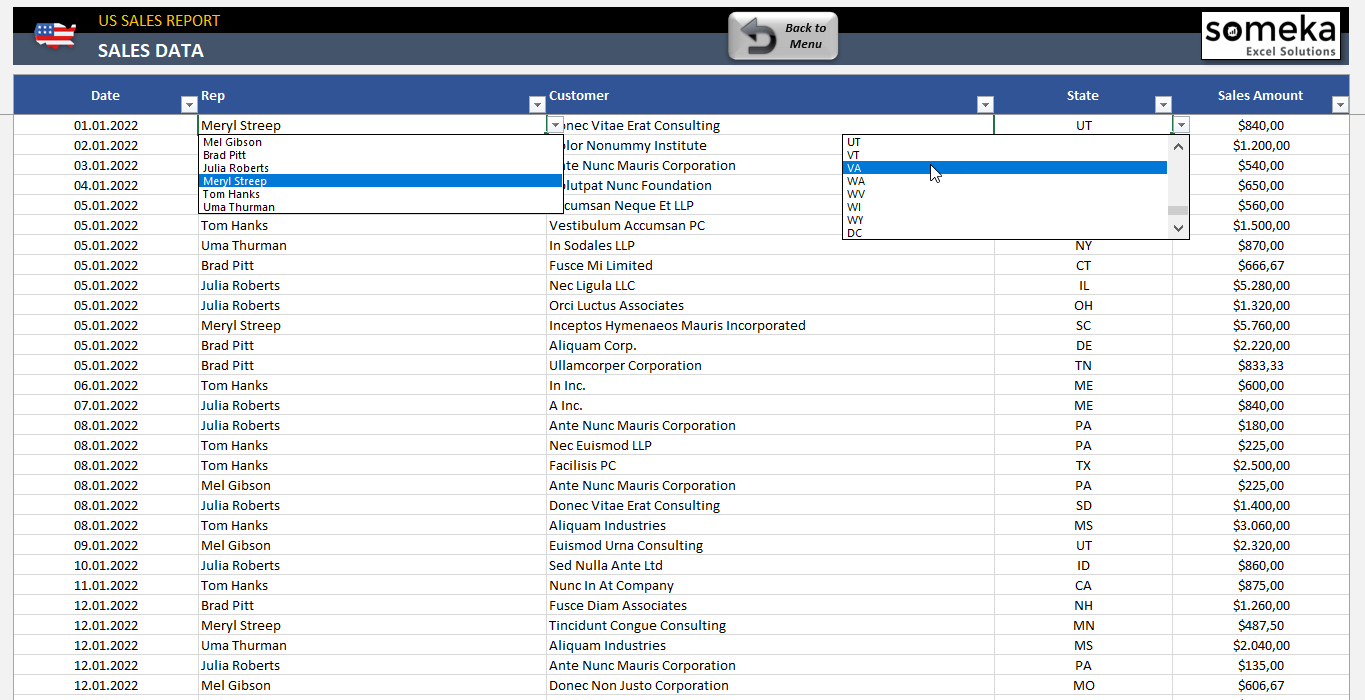
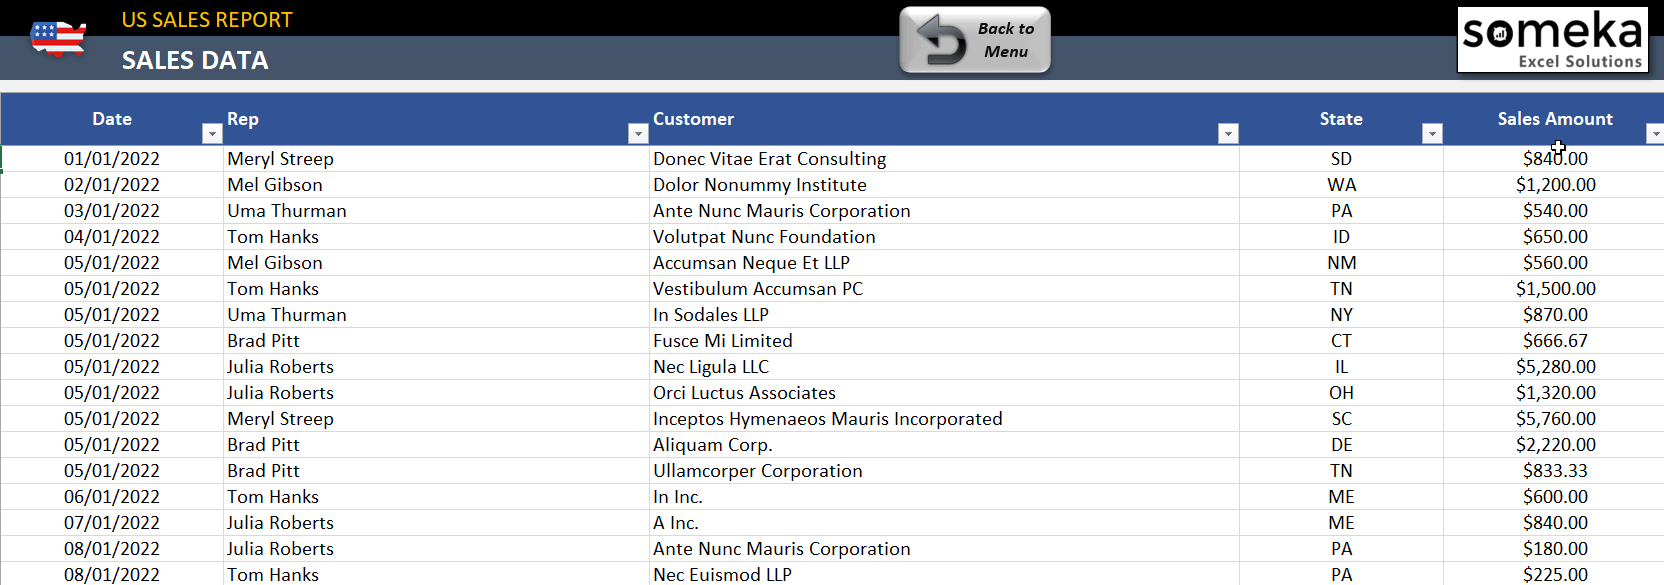
Sales Data
Sales data contains actual sales that your sales reps closed. Besides that, it’s a kind of database that gives important information like your customer details and historical sales data of your reps by state. By default, this section is available for up to 10000 rows. But, if you want to extend the region, simply insert rows and copy-paste formulas in the hidden columns.
OTHER FEATURES:
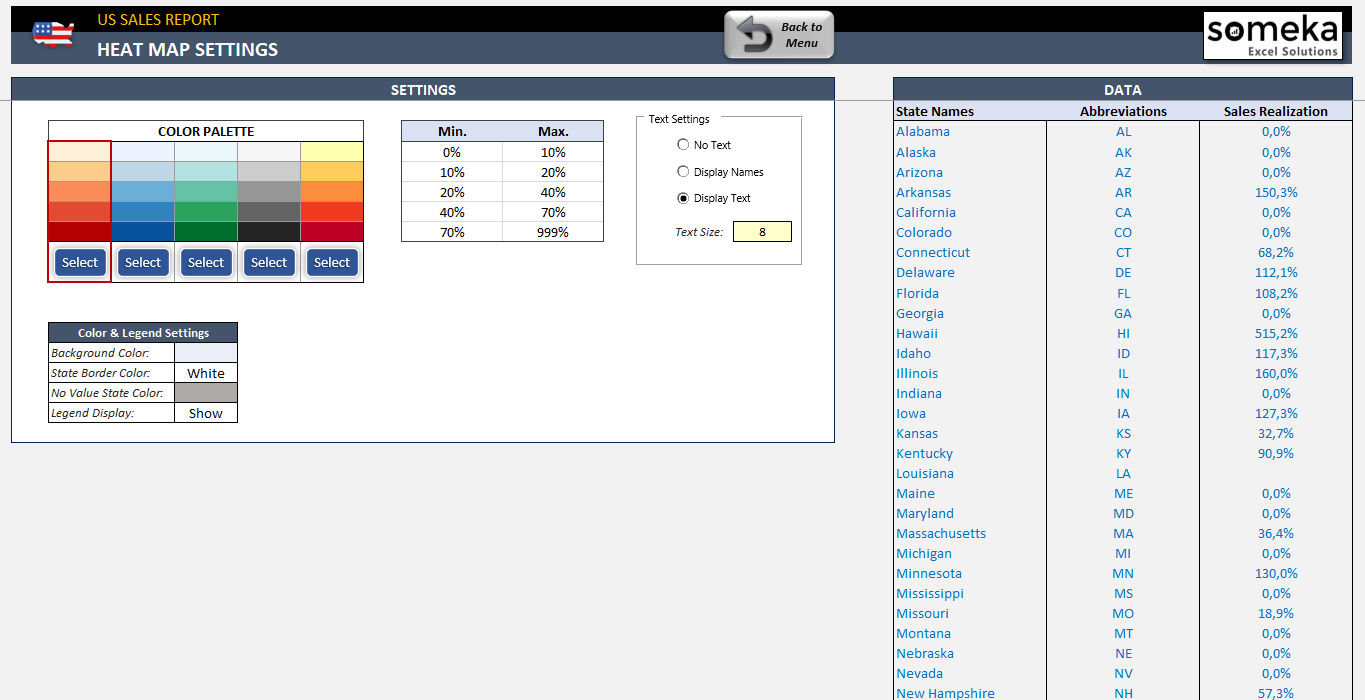
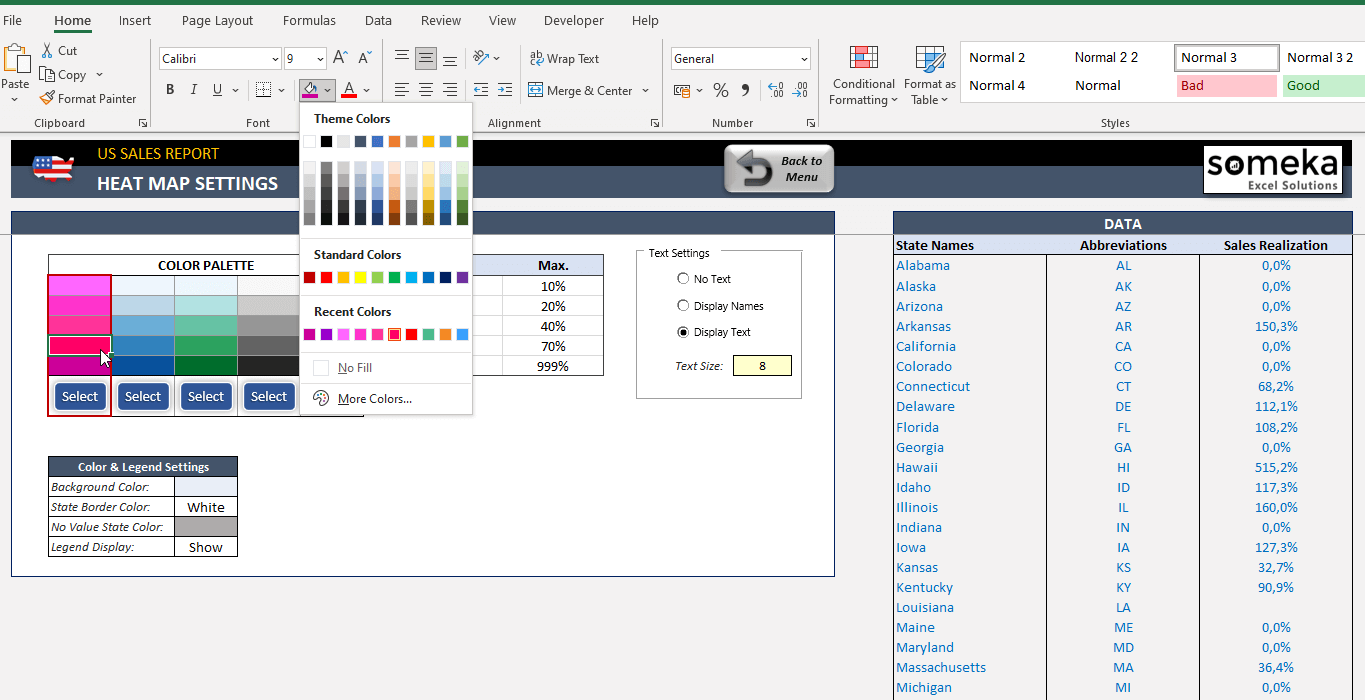
US Sales Map Settings: In this section, you can change the colors, data ranges, text sizes of US Sales Heat Map on the Dashboard. But, Data section takes your sales values from your inputs on Sales Data. So, we do not recommend you to make any manual changes there.
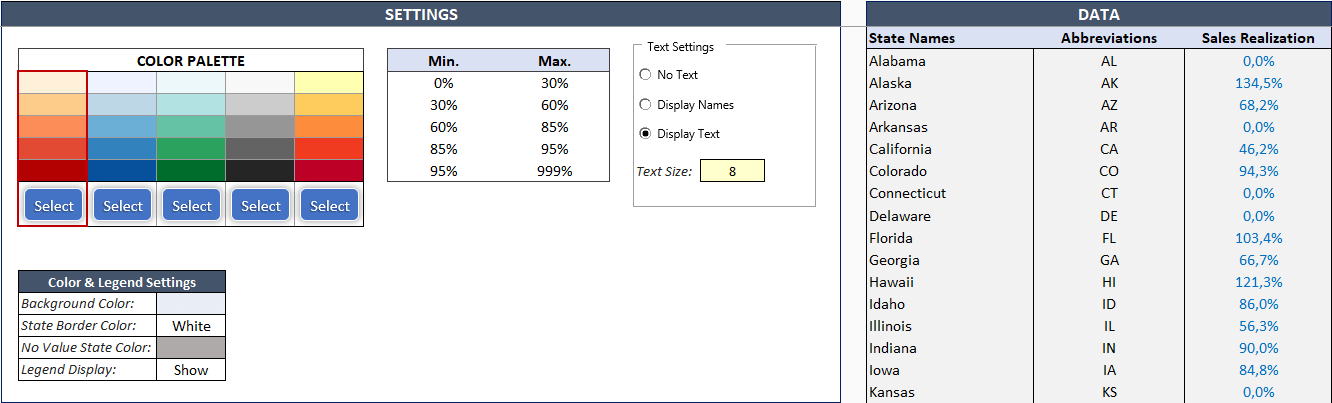
**You can check our Geographical Heat Map Generators collection
Export to PDF: When you finish your sales report, you can easily export it to PDF by clicking this button.
US SALES MAP GENERATOR FEATURES SUMMARY:
• Monthly Sales Analysis Report Template for all US states
• Works both on Mac and Windows
• No installation needed. Ready to use.
• Export to PDF feature
• Full Print Ready
• White Label
• Flexible customization options
• On Sheet Instructions
• Compatible with Excel 2013 and later versions
PRODUCT VIDEO
Watch the video below to see the template in action! Presentation also includes usage notes, explanations and tips & tricks about the template.
USER REVIEWS & COMMENTS
10 reviews for US Sales Map Excel Template
You must be logged in to post a review.
RELATED TEMPLATES
-
 This product has multiple variants. The options may be chosen on the product page
Client Task Management Excel Template
$49.95 – $99.95Comprehensive account management template in Excel. Plan and track customer tasks in one place. Works on Mac & Windows. No installation needed.
-
This product has multiple variants. The options may be chosen on the product page
Sales Forecast Excel Template
$0.00 – $99.95Demand planning and sales forecast template. Projection of future revenue based on historical sales data. SKU-level demand forecast. All in Excel.
-
This product has multiple variants. The options may be chosen on the product page
Competitor Price Comparison and Analysis Excel Template
$0.00 – $59.95Competitor Price Comparison Template will help you to analyse and calculate the correct price positioning for your products and services in Excel.
-
This product has multiple variants. The options may be chosen on the product page
Vendor Comparison Excel Template
$0.00 – $59.95Cost comparison spreadsheet. Compare prices from multiple vendors or suppliers. Printable and ready to use Excel template. No installation needed.
-
This product has multiple variants. The options may be chosen on the product page
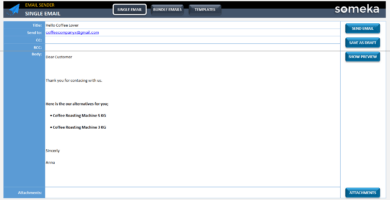
Mail Merge & Email Sender Excel Template
$0.00 – $59.95This Mail Merge & Email Sender Template in Excel will help you to create a single message or bulk emails and send them via Outlook with VBA.
-
This product has multiple variants. The options may be chosen on the product page
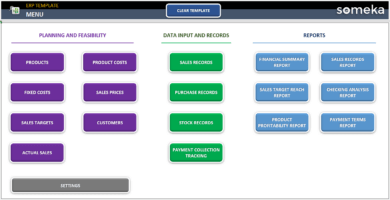
Excel ERP Template
$0.00 – $199.95ERP spreadsheet template as a mini ERP application in Excel. Simple yet powerful. Manage your processes, see projections and calculate financials.

Ketki G –
Totally worth to pay and purchase it. Happy that I am using the premium version of this tool. Gives me more freedom to make changes in colomns and colors.
Irum J Ball –
is there a way to add my corporate logo?
Someka –
Hello there, surely it is possible to add your own logo. To remove Someka’s logo follow the eaxact steps in the link provided.
Hope it helps you.
Calvin Rivera –
I was delighted to find your remarkable template on Google, and I truly appreciate your ability to consistently provide such helpful resources.
Mike Hill –
I really dont like the color selection of this template, it gaves me headache, is there anyway that you can change it for me?
Someka –
Greetings! We appreciate your input. Color is a very individual preference and some customers may be dissatisfied with the color scheme of our template. However, fear not!
Our team at Someka has a solution for you. Open the Settings Sheet to explore the Color Pallete, where you can make the necessary adjustments for your desired effect.
If you have any further questions, please feel free to contact us at contact@someka.net.
Vanessa Salvi –
From where I can select the exact month that I need?
Someka –
Hello, from Dashboard Section, you can use filter option to choose only one month or couple of months together to see the analytics.
Justin –
Very useful tamplate the features are wonderful and anyone can use it. Thanks
Beatrix –
I liked it but something is not working, when I fill in the monthly sales performance the info doesn’t show on the dashboard?
Someka –
Hi Beatrix,
After you input all your information in the “Sales Data” section, please make sure to click the “refresh” button on the dashboard, as shown in the image:
Leire –
Very complete tool
jason –
This is the primary template I use for my sales team. It’s a great and robust. If you think this one suits your needs you can’t go wrong.
donald –
It allows me to customize pretty much everything, down to editing map for each specific state or even single coloring. On the other hand, it is also simple enough to insert previous sales data easily. No matter what your experience is, it can be used by everyone.
Keep up the great work guys!